- Demographics of Russia
-
Demographics of Russia 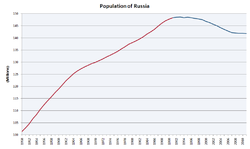
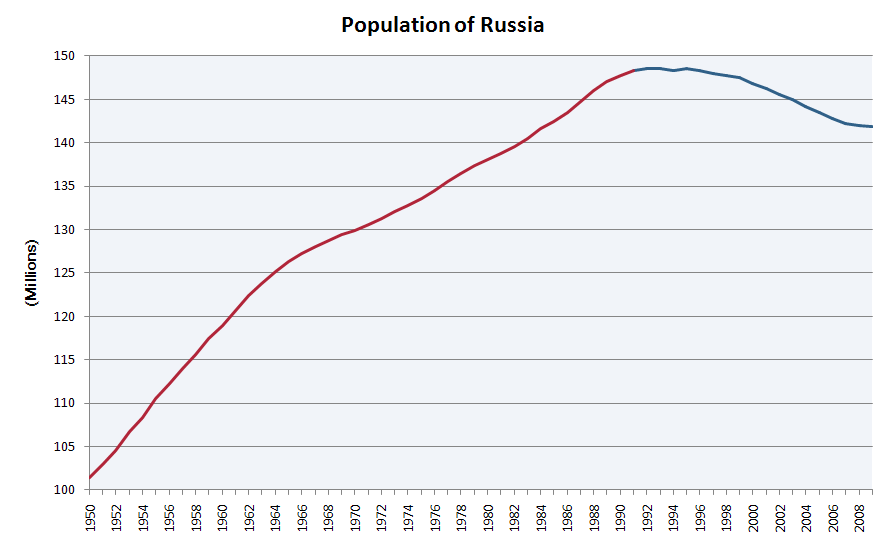
Population (in millions) 1950 – January 2010.[1]Population: 142,905,200 (2010 Russian Census) Growth rate: -0.06% (2010) Birth rate: 12.5 births/1,000 population (2010) Death rate: 14.2 deaths/1,000 population (2010) Life expectancy: 68.98 years (2010) –male: 63.03 years –female: 74.87 years Fertility rate: 1.54 children born/woman (2009) Infant mortality rate: 7.5 deaths/1,000 live births (2010) Net migration rate: 1.11 migrant(s)/1,000 population (2010) Age structure: 0-14 years: 14.9% 15-64 years: 71.8% 65-over: 13.3% (2009) Sex ratio: Total: 0.86 male(s)/female (2009) At birth: 1.05 male(s)/female Under 15: 1.05 male(s)/female (male 10,806,895/female 10,285,532) 15-64 years: 0.92 male(s)/female (male 48,864,763/female 53,048,315) 65-over: 0.46 male(s)/female (male 5,969,976/female 12,928,498) Nationality: Nationality: noun: Russian(s) adjective: Russian Major ethnic: Russians Language: Spoken: Russian, others The demographics of Russia is about the demographic features of the population of the Russian Federation, including population growth, population density, ethnic composition, education level, health, economic status, and other aspects of the population.
The population of Russia was 142,905,200 as per the preliminary results of the 2010 Census.[2] The population hit a historic peak at 148,689,000 in 1991, just before the breakup of the Soviet Union, but then began a decade-long decline, falling at a rate of about 0.5% per year due to declining birth rates and rising death rates. However the decline began to slow considerably in recent years, and in 2009 Russia recorded annual population growth for the first time in 15 years, with growth of 23,300.[3][4]
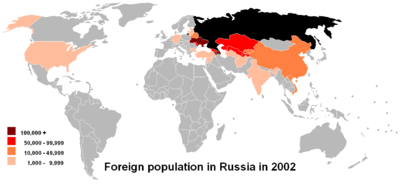
According to the 2002 census, ethnic Russians make up 80% of the total population, while six other ethnicities have a population exceeding 1 million – Tatars (3.8%), Ukrainians (2%), Bashkir (1.1%), Chuvash (1.1%), Chechens (0.9%) and Armenians (0.8%). In total, 160 different ethnic groups and indigenous peoples live within the Russian federation's borders.
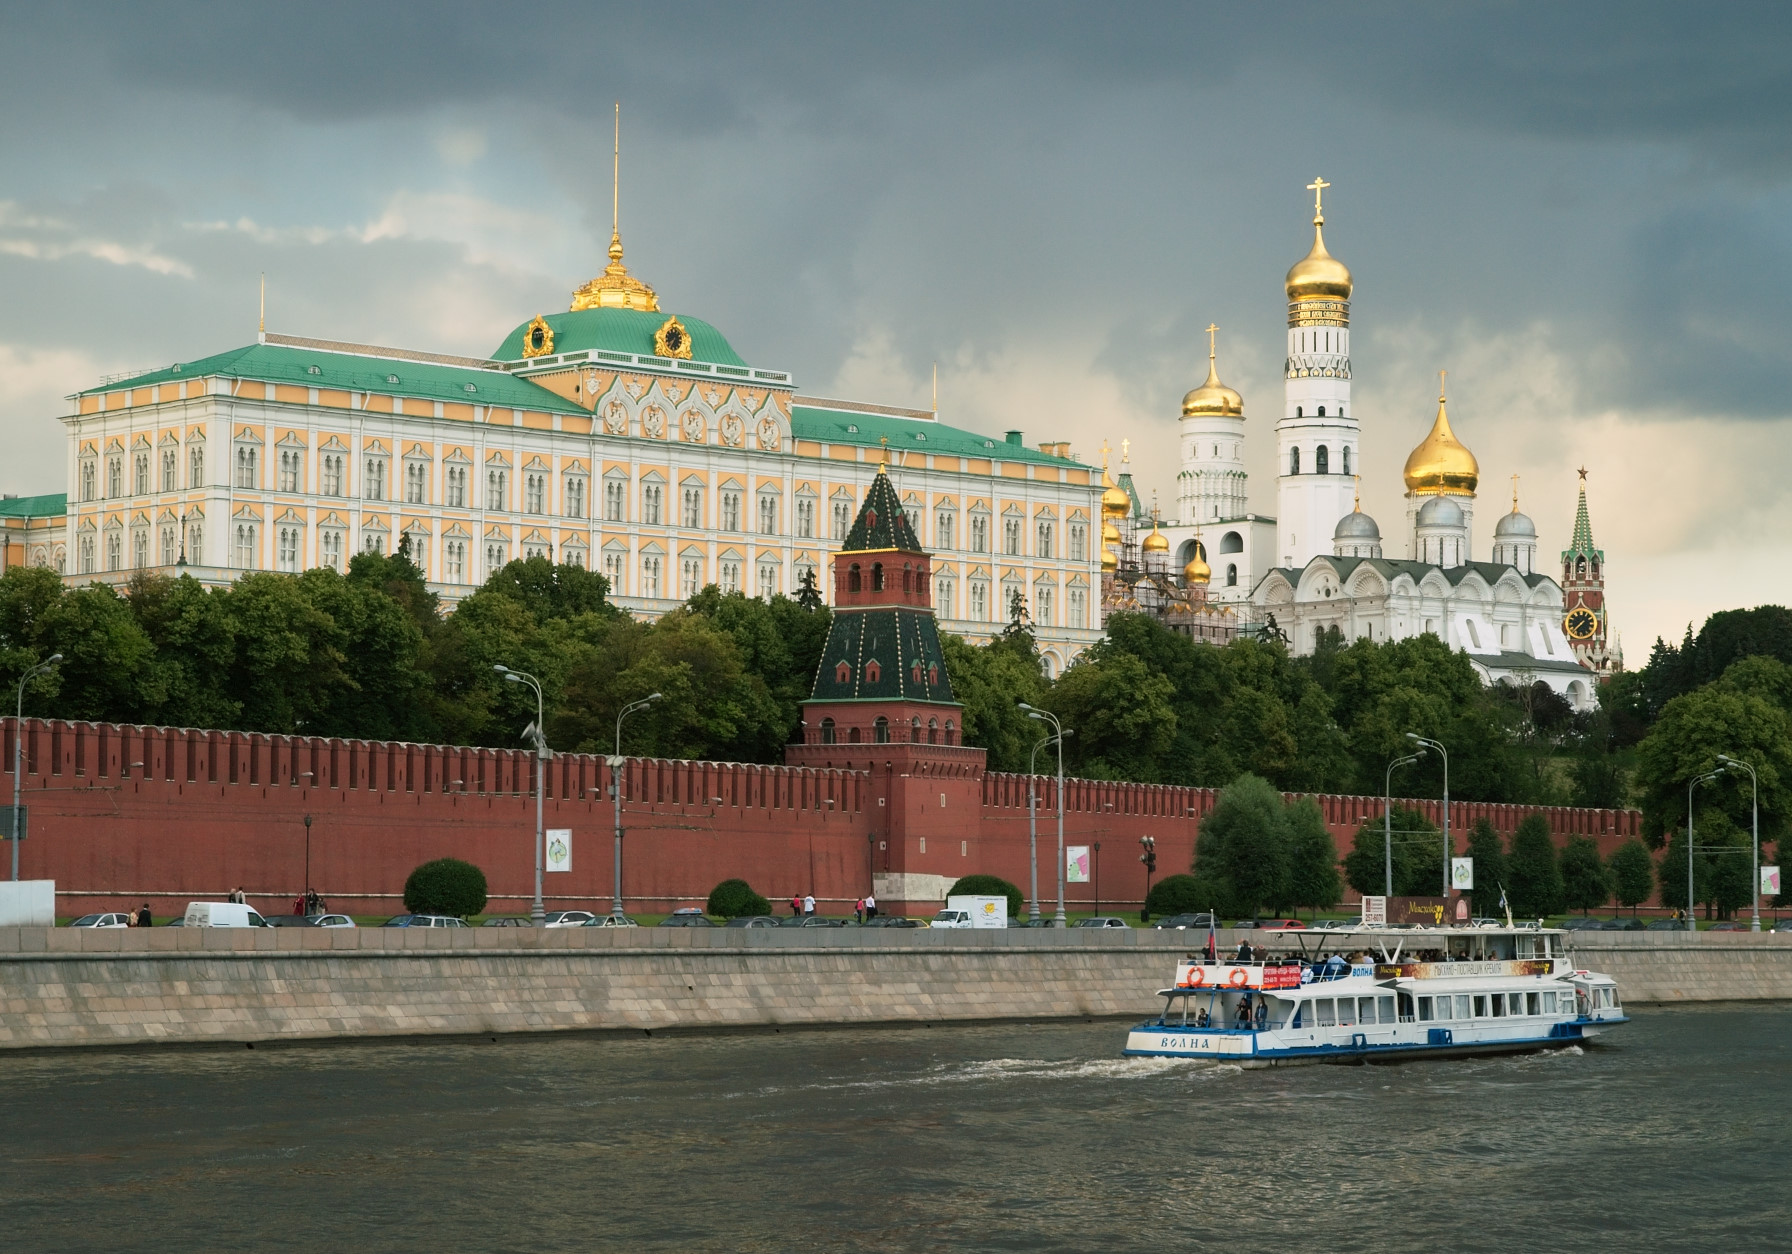
Russia's population density is 8.4 people per square kilometre (22 per square mile), making it one of the most sparsely populated countries in the world. The population is most dense in the European part of the country, centering around Moscow and Saint Petersburg. 74% of the population is urban.
Declining population
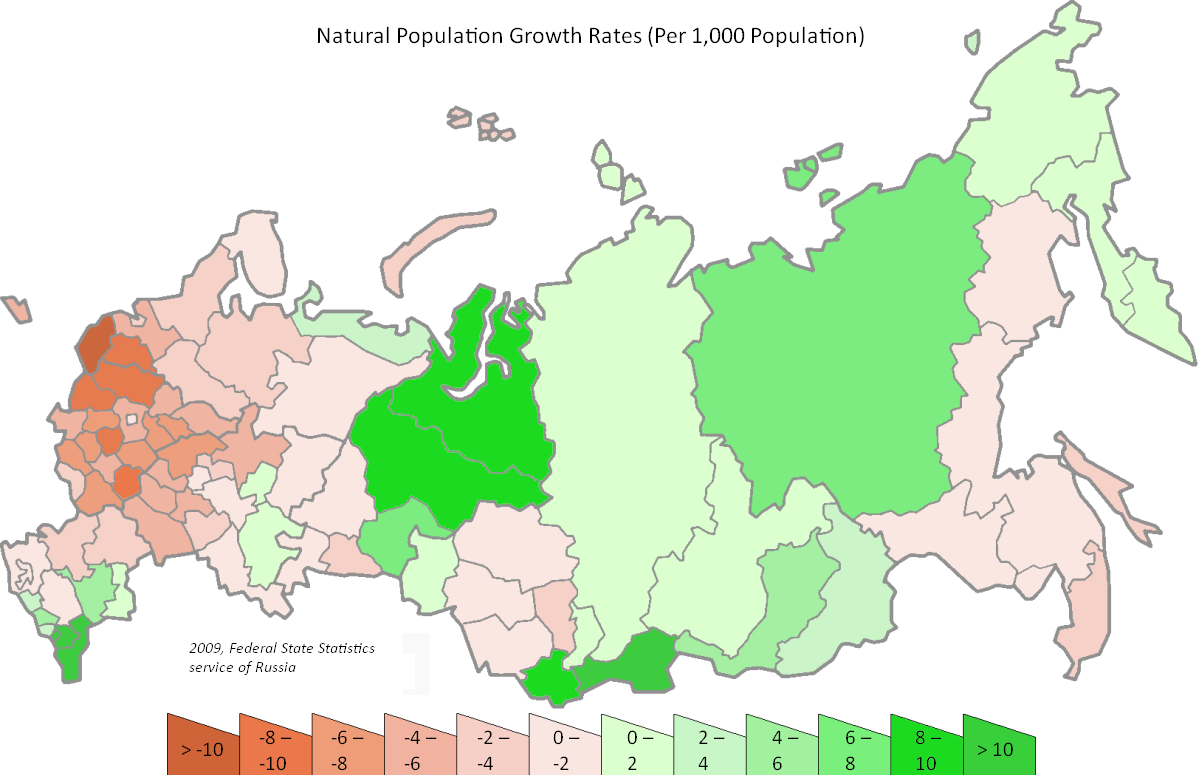
Main article: Russian Cross Natural population growth rates (per 1,000 population) by region in 2009.
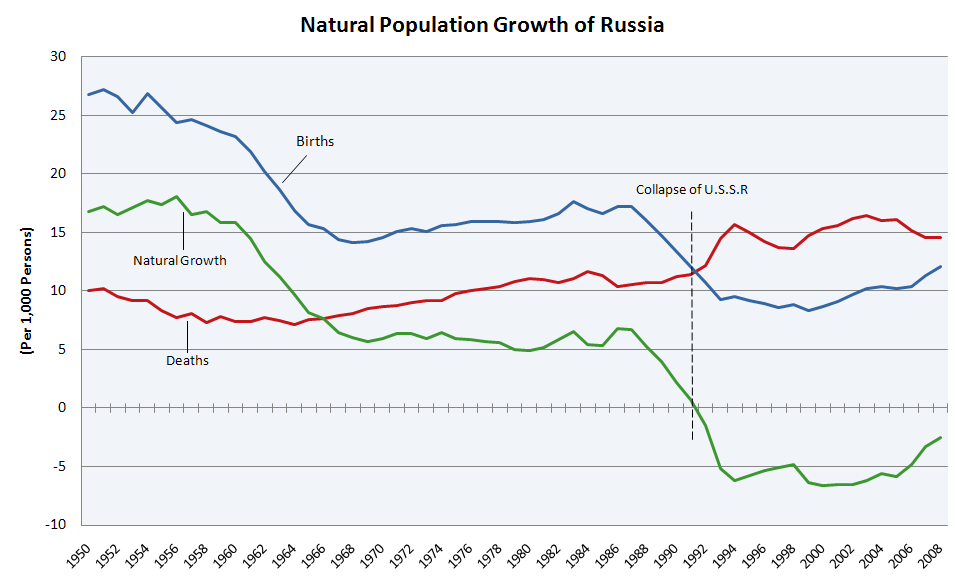
The population of Russia peaked at 148,689,000 in 1991, just before the breakup of the Soviet Union. Low birth rates and abnormally high death rates caused Russia's population to decline at a 0.5% annual rate, or about 750,000 to 800,000 people per year from the mid 1990s to the mid 2000s. The UN warned in 2005 that Russia's then population of about 143 million could fall by a third by 2050 if trends did not improve.[7][8] However, the Russian state statistics service Rosstat had more optimistic forecasts in 2009, whose Medium variant predicted that Russia's population would only fall to 139 million by 2030[9] (Low: 127 million; High: 147 million). Furthermore, in 2008 one demographic analyst (correctly) predicted a resumption in population growth by 2010.[10]
The number of Russians living in poverty has halved since the economic crisis following the disintegration of the Soviet Union, and the improving economy had a positive impact on the country's low birth rate. The birth rate of Russia rose from its lowest point of 8.27 births per 1000 people in 1999 to 12.6 per 1000 in 2010. Likewise, the fertility rate rose from its lowest point of 1.16 in 1999 to 1.54 in 2009. 2007 marked the highest growth in birth rates that the country had seen in 25 years, and 2009 marked the highest total birth rate since 1991.[11] For comparison, the United States[12] birth rate in 2009 was 13.8 per 1000 . While the Russian birth rate is comparable to that of other developed countries, its death rate is much higher, especially among working-age males due to a comparatively high rate of fatalities caused by heart disease and other external causes such as accidents. The Russian death rate in 2010 was 14.3 per 1000 citizens. For comparison, the US[12] death rate in 2009 was 8.4 per 1000 .
The causes for this sharp increase in mortality are widely debated, with some academics citing alcohol abuse as the main culprit,[13] and others citing the drastic and widely negative changes in lifestyle caused by economic reforms that followed the dissolution of the Soviet Union. According to a 2009 report by The Lancet,[14] a British medical journal, mass privatization, an element of the economic-reform package nicknamed shock therapy, clearly correlates with higher mortality rates. The report argues that the advocates of the economic reforms ignored the human cost of the policies they were promoting, such as unemployment and human suffering, leading to an early death. These conclusions were criticized by The Economist.[15] According to the Russian demographic publication Demoscope,[16] the rising male death rate was a long-term trend from 1960 to 2005. The only significant reversion of the trend was caused by Mikhail Gorbachev's anti-alcohol campaign, but its effect was only temporary. According to the publication, the sharp rise of death rates in the early 1990s was caused by the exhaustion of the effect of the anti-alcohol campaign, while the market reforms were of only secondary importance. The authors also claimed the Lancet's study is flawed because it used 1985 death rate as the base, while that was in fact the very maximum of the effect of the anti-alcohol campaign.[16]
Government measures to halt the demographic crisis was a key subject of Vladimir Putin's 2006 state of the nation address.[17] As a result, a national programme was developed with the goal to reverse the trend by 2020. Soon after, a study published in 2007 showed that the rate of population decrease had begun to slow: if the net decrease in January–August 2006 was 408,200 people, it was 196,600 in the same period in 2007. The death rate accounted for 357,000 of these, which is 137,000 less than in 2006. At the same time period in 2007, there were just over 1 million births in Russia (981,600 in 2006), whilst deaths decreased from 1,475,000 to 1,402,300. In all, the number of deaths exceeded the number of births by 1.3 times, down from 1.5 in 2006. Eighteen of the 83 provinces showed a natural growth of population (in 2006: 16). The Russian Ministry of Economic Development expressed hope that by 2020 the population would stabilize at 138–139 million, and by 2025, to increase again to its present day status of 143–145, also raising the life expectancy to 75 years.[18]
The natural population decline continued to slow through 2008—2010 due to declining death rates and increasing birth rates, and in 2009 the population saw yearly growth for the first time in 15 years.[3][4] In September 2009, the Ministry of Health and Social Development reported that Russia recorded natural population growth for the first time in 15 years, with 1,000 more births than deaths in August.[19] In April 2011 the Russian Prime Minister Vladimir Putin pledged to spend the 1.5 trillion rubles (£32.5 billion or $54 billion) on various measures to boost Russia's declining birthrate by 30 per cent in the next four years.[20]
Vital statistics
Before WW II
No exact vital statistics for Russia are available for the period before WW II. Andreev[21] made the following estimates:
Average population Live births Deaths Natural change Crude birth rate (per 1,000) Crude death rate (per 1,000) Natural change (per 1,000) 1927 94,596,000 4,688,000 2,705,000 1,983,000 49.6 28.6 21.0 1928 96,654,000 4,723,000 2,589,000 2,134,000 48.9 26.8 22.1 1929 98,644,000 4,633,000 2,819,000 1,814,000 47.0 28.6 18.4 1930 100,419,000 4,413,000 2,738,000 1,675,000 43.9 27.3 16.7 1931 101,948,000 4,412,000 3,090,000 1,322,000 43.3 30.3 13.0 1932 103,136,000 4,058,000 3,077,000 981,000 39.3 29.8 9.5 1933 102,706,000 3,313,000 5,239,000 -1,926,000 32.3 51.0 -18.8 1934 101,922,000 2,923,000 2,659,000 264,000 28.7 26.1 2.6 1935 102,684,000 3,577,000 2,421,000 1,156,000 34.8 23.6 11.3 1936 103,904,000 3,899,000 2,719,000 1,180,000 37.5 26.2 11.4 1937 105,358,000 4,377,000 2,760,000 1,617,000 41.5 26.2 15.3 1938 107,044,000 4,379,000 2,739,000 1,640,000 40.9 25.6 15.3 1939 108,785,000 4,329,000 2,600,000 1,729,000 39.8 23.9 15.9 1940 110,333,000 3,814,000 2,561,000 1,253,000 34.6 23.2 11.4 After WW II[22][23]
Average population Live births Deaths Natural change Crude birth rate (per 1,000) Crude death rate (per 1,000) Natural change (per 1,000) 1946 98,028,000 2,546,000 1,210,000 1,336,000 26.0 12.3 13.6 1947 98,834,000 2,715,000 1,680,000 1,035,000 27.5 17.0 10.5 1948 99,706,000 2,516,000 1,310,000 1,206,000 25.2 13.1 12.1 1949 101,160,000 3,089,000 1,187,000 1,902,000 30.5 11.7 18.8 1950 102,833,000 2,859,000 1,180,000 1,719,000 27.8 11.5 16.7 1951 104,439,000 2,938,000 1,210,000 1,779,000 28.1 11.6 17.0 1952 106,164,000 2,928,000 1,138,000 1,807,000 27.6 10.7 17.0 1953 107,828,000 2,822,000 1,118,000 1,696,000 26.2 10.4 15.7 1954 109,643,000 3,048,000 1,133,000 1,932,000 27.8 10.3 17.6 1955 111,572,000 2,942,000 1,037,000 1,921,000 26.4 9.3 17.2 1956 113,327,000 2,827,000 956,000 1,906,000 24.9 8.4 16.8 1957 115,035,000 2,880,000 1,017,000 1,916,000 25.0 8.8 16.7 1958 116,749,000 2,861,000 931,000 1,982,000 24.5 8.0 17.0 1959 118,307,000 2,796,228 920,225 1,876,003 23.6 7.8 15.9 1960 119,906,000 2,782,353 886,090 1,896,263 23.2 7.4 15.8 1961 121,586,000 2,662,135 901,637 1,760,498 21.9 7.4 14.5 1962 123,128,000 2,482,539 949,648 1,532,891 20.2 7.7 12.4 1963 124,514,000 2,331,505 932,055 1,399,450 18.7 7.5 11.2 1964 125,744,000 2,121,994 901,751 1,220,243 16.9 7.2 9.7 1965 126,749,000 1,990,520 958,789 1,031,731 15.7 7.6 8.1 1966 127,608,000 1,957,763 974,299 983,464 15.3 7.6 7.7 1967 128,361,000 1,851,041 1,017,034 834,007 14.4 7.9 6.5 1968 129,037,000 1,816,509 1,040,096 776,413 14.1 8.1 6.0 1969 129,660,000 1,847,592 1,106,640 740,952 14.2 8.5 5.7 1970 130,252,000 1,903,713 1,131,183 772,530 14.6 8.7 5.9 1971 130,934,000 1,974,637 1,143,359 831,278 15.1 8.7 6.3 1972 131,687,000 2,014,638 1,181,802 832,836 15.3 9.0 6.3 1973 132,434,000 1,994,621 1,214,204 780,417 15.1 9.2 5.9 1974 133,217,000 2,079,812 1,222,495 857,317 15.6 9.2 6.4 1975 134,092,000 2,106,147 1,309,710 796,437 15.7 9.8 5.9 1976 135,026,000 2,146,711 1,352,950 793,761 15.9 10.0 5.9 1977 135,979,000 2,156,724 1,387,986 768,738 15.9 10.2 5.7 1978 136,922,000 2,179,030 1,417,377 761,653 15.9 10.4 5.6 1979 137,758,000 2,178,542 1,490,057 688,485 15.8 10.8 5.0 1980 138,483,000 2,202,779 1,525,755 677,024 15.9 11.0 4.9 1981 139,221,000 2,236,608 1,524,286 712,322 16.1 10.9 5.1 1982 140,067,000 2,328,044 1,504,200 823,844 16.6 10.7 5.9 1983 141,056,000 2,478,322 1,563,995 914,327 17.6 11.1 6.5 1984 142,061,000 2,409,614 1,650,866 758,748 17.0 11.6 5.3 1985 143,033,000 2,375,147 1,625,266 749,881 16.6 11.4 5.2 1986 144,156,000 2,485,915 1,497,975 987,940 17.2 10.4 6.9 1987 145,386,000 2,499,974 1,531,585 968,389 17.2 10.5 6.7 1988 146,505,000 2,348,494 1,569,112 779,382 16.0 10.7 5.3 1989 147,342,000 2,160,559 1,583,743 576,816 14.7 10.7 3.9 1990 147,969,000 1,988,858 1,655,993 332,865 13.4 11.2 2.3 1991 148,394,000 1,794,626 1,690,657 103,969 12.1 11.4 0.7 1992 148,538,000 1,587,644 1,807,441 -219,797 10.7 12.2 -1.5 1993 148,459,000 1,378,983 2,129,339 -750,356 9.3 14.3 -5.1 1994 148,408,000 1,408,159 2,301,366 -893,207 9.5 15.5 -6.0 1995 148,376,000 1,363,806 2,203,811 -840,005 9.2 14.9 -5.7 1996 148,160,000 1,304,638 2,082,249 -777,611 8.8 14.1 -5.2 1997 147,915,000 1,259,943 2,015,779 -755,836 8.5 13.6 -5.1 1998 147,671,000 1,283,292 1,988,744 -705,452 8.7 13.5 -4.8 1999 147,215,000 1,214,689 2,144,316 -929,627 8.3 14.6 -6.3 2000 146,597,000 1,266,800 2,225,332 -958,532 8.6 15.2 -6.5 2001 145,976,000 1,311,604 2,254,856 -943,252 9.0 15.4 -6.5 2002 145,306,000 1,396,967 2,332,272 -935,305 9.6 16.1 -6.4 2003 144,566,000 1,477,301 2,365,826 -888,525 10.2 16.4 -6.1 2004 143,821,000 1,502,477 2,295,402 -792,925 10.4 16.0 -5.5 2005 143,114,000 1,457,376 2,303,935 -846,559 10.2 16.1 -5.9 2006 142,487,000 1,479,637 2,166,703 -687,066 10.4 15.2 -4.8 2007 142,115,000 1,610,122 2,080,445 -470,323 11.3 14.6 -3.3 2008 141,956,000 1,713,947 2,075,954 -362,007 12.1 14.6 -2.6 2009 141,909,000 1,761,687 2,010,543 -248,856 12.4 14.2 -1.8 2010 (p) 142,938,285 1,788,948 2,028,516 -239,568 12.5 14.2 -1.7 p=preliminary
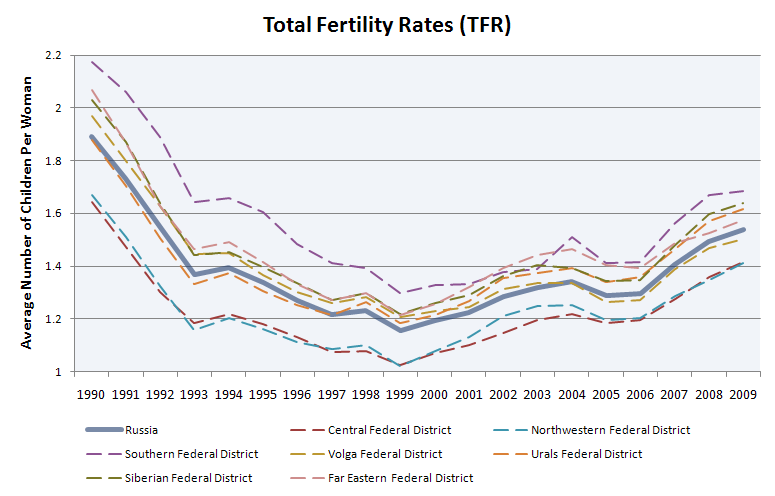
Total fertility rates
 Changes in the TFR since 1990.
In 1990, just prior to the dissolution of the Soviet Union, Russia's total fertility rate (TFR) stood at 1.89. Fertility rates had already begun to decline in the late 80s due to the natural progression of Russia's demographic structure, but the rapid and widely negative changes in society following the collapse greatly influenced the rate of decline.[24] The TFR hit an historic low of 1.16 in 1999 and has since begun to rise again, reaching 1.54 in 2009 (growth of 34.4%).[25] The only federal subject of Russia to see a decline in fertility since 1999 is Ingushetia, where the TFR has fallen by 20% from 2.44 to 1.97 as of 2009.[26]
In 2009, 8 of Russia's federal subjects had a TFR above 2.1 children per woman (the approximate minimum required to ensure population replacement). These federal subjects are Chechnya (3.38), Tyva (2.81), Ust-Orda Buryat Okrug (2.73), Agin-Buryat Okrug (2.63), Komi-Permyak (2.16), Evenk Okrug (2.58), Altai Republic (2.36), Nenets Autonomous Okrug (2.1). Of these federal subjects, four have an ethnic Russian majority (Altai, Evenk, Ust-Orda and Nenets).[26][27]
In every region in Russia rural areas reported higher TFR compared to urban areas. In most of the federal subjects in Siberia and the Russian Far East, the total fertility rates were high, but not high enough to ensure population replacement. For example, Zabaykalsky Krai had a TFR of 1.82, which is higher than the national average, but less than the 2.1 needed for population replacement.[26]
TFR in comparison with other countries
Compared to other G8 countries, in 2010, Russian TFR of 1,54 children/ woman[28] was significantly lower than that of the
 USA (2,09),
  France (1,97), the
  UK (1,92). Yet it approximately equals to the TFR of
  Canada (1,57), and is higher than in other G8 countries:
  Germany (1,42),
  Japan (1,39), and
  Italy (1,32).
Compared to other most populous nations, Russia has a lower TFR than
 Nigeria (4,82),
 Pakistan (3,28),
 India (2,65),
  Indonesia (2,28),
  Brazil (2,19), the USA, and the same TFR as
  China (1,54).
Compared to it's neighbors, Russia has a lower TFR than
 Mongolia (2,22),
  Azerbaijan (2,03),
  North Korea (1,94),
  Kazakhstan (1,87),
  Norway (1,77) and
  Finland (1,73). Russian TFR equals to the Chinese one, and is higher than in
  Georgia (1,44),
  Estonia (1,43),
  Latvia (1,31),
  Poland (1,29),
  Ukraine (1,27),
  Belarus (1,25), and
  Lithuania (1,24).
See also: List of countries by fertility rate
Ethnic groups
 Ethnic Russians as a percentage of the population by region (2002 census)Main article: Ethnic groups in RussiaFurther information: List of indigenous peoples of Russia
The Russian Federation is home to as many as 160 different ethnic groups and indigenous peoples. As of the 2002 census, 79.83% of the population (115,889,107 people) is ethnically Russian, followed by (groups larger than one million):[29][30]
- 3.83% Tatars (5,554,601)
- 2.03% Ukrainians (2,942,961)
- 1.15% Bashkirs (1,673,389)
- 1.13% Chuvashs (1,637,094)
- 0.94% Chechens (1,360,253)
- 0.78% Armenians (1,130,491)
Most smaller groups live compactly in their respective regions and can be categorized by language group The ethnic divisions used here are those of the official census, and may in some respects be controversial. The following lists all ethnicites resolved by the 2002 census, grouped by language:[29][30]
- Indo-European 122,687,275 (total 84.07%; 83.27% Slavs)
- Russians 115,889,107 (79.83%)
- Ukrainians 2,942,961 (2.03%)
- Armenians 1,130,491 (0.78%)
- Belarusians 807,970 (0.56%)
- Germans 597,212 (0.41%)
- Ossetians 514,875 (0.35%)
- Roma 182,766 (0.13%)
- Moldovans 172,330 (0.12%)
- Tajiks 120,136 (0.08%)
- Greeks 97,827 (0.07%)
- Poles 73,001 (0.05%)
- Iranians 50,242 (0.036%)
- Lithuanians 45,569 (0.03%)
- Bulgarians 31,965 (0.02%)
- Latvians 28,520 (0.02%)
- Tats 2,303 (0.00%)
- Turkic 12,106,587 (total 8.36%)
- Tatars 5,554,601 (3.83%)
- Bashkirs 1,673,389 (1.15%)
- Chuvashs 1,637,094 (1.13%)
- Kazakhs 653,962 (0.45%)
- Azerbaijani 621,840 (0.43%)
- Yakuts 443,852 (0.31%)
- Kumyks 422,409 (0.29%)
- Tuvans 243,442 (0.17%)
- Karachays 192,182 (0.13%)
- Uzbeks 122,916 (0.08%)
- Balkars 108,426 (0.07%)
- Turks 95,672 (0.06%)
- Nogais 90,666 (0.06%)
- Khakas 75,622 (0.05%)
- Altay peoples 67,239 (0.05%)
- Turkmens 33,053 (0.02%)
- Kyrgyz 31,808 (0.02%)
- Shors 13,975 (0.01%)
- Gagauz 12,210 (0.01%)
- Dolgans 7,261 (0.01%)
- Crimean Tatars 4,131 (0.00%)
- Tofalar 837 (0.00%)
- Caucasian 4,822,600 (total 3.30%)
- Chechens 1,360,253 (0.94%)
- Avars 814,473 (0.56%)
- Kabardians 519,958 (0.36%)
- Dargins 510,156 (0.35%)
- Ingush 413,016 (0.28%)
- Lezgins 411,535 (0.28%)
- Georgians 197,934 (0.14%)
- Laks 156,545 (0.11%)
- Tabasarans 131,785 (0.09%)
- Adyghe 128,528 (0.09%)
- Circassians 60,517 (0.04%)
- Abazas 37,942 (0.03%)
- Rutuls 29,929 (0.02%)
- Aguls 28,297 (0.02%)
- Abkhaz 11,366 (0.01%)
- Tsakhurs 10,366 (0.01%)
- Uralic 2,757,488 (1.91%)
- Mordvins 843,350 (0.58%)
- Udmurts 636,906 (0.44%)
- Mari 604,298 (0.42%)
- Komi 293,406 (0.20%)
- Komi-Permyak 125,235 (0.09%)
- Karelians 93,344 (0.06%)
- Finns 34,050 (0.02%)
- Khanty 28,678 (0.02%)
- Estonians 28,113 (0.02%)
- Mansi 11,432 (0.01%)
- Veps 8,240 (0.01%)
- Sami 1,991 (0.00%)
- Izhorians 314 (0.00%)
- Samoyedic 48,131 (0.03%)
- Yukaghir 1,509 (0.00%)
- Vietnamese 296,556 (0.20%)
- Semitic peoples 243,587 (0.17%)
- Jews 229,938 (0.16%)
- Assyrians 13,649 (0.01%)
- Koreans 148,556 (0.10%)
- Chukotko-Kamchatkan 28,777 (0.02%)
- Nivkh 5,162 (0.00%)
- Ket 1,494 (0.00%)
Some 1.6% of the population are ethnicities not native to the Russian territory. The census has an additional group of 'other' ethnicities of 42,980 (0.03%), including Hungarians, Czechs, Japanese, Chinese, Spaniards, Italians, Scandinavians and Romanians. There are even Africans in Russia (See Afro-Russian).[citation needed]
See also: Northern indigenous peoples of Russia, Detailed Table of 2002 census
Gradient
 International migration to and from Russia since 1998.ArrivalsDeparturesNet migration growth
The demographic structure of Russia has gradually changed over time. In 1970, the Soviet Union had the third largest population of Jews in the world, estimated at 2,150,000, following only that of the United States and Israel. By 2002, due to Jewish emigration, their number fell as low as 230,000. A sizeable emigration of other minorities has been enduring, too. Predominantly these are European peoples like Germans, Czechs, Greeks and members of their families. The main destinations are the USA (Jews, Belarussians, Chechens, Meskhetian Turks, Ukrainians and others), Israel (Jews), Germany (Germans and Jews), Poland (Poles and Jews), Canada (Finns and Ukrainians), Finland (Finns), France (Jews, Armenians and Romani) and the United Kingdom (mainly rich Russians).[citation needed]
At the same time, Russia experiences a constant flow of immigration. On average, close to 300,000 legal immigrants enter the country every year; about half are ethnic Russians from the other republics of the former Soviet Union. In addition, There are an estimated 4 million illegal immigrants from the ex-Soviet states in Russia.[31] There is a significant inflow of ethnic Georgians, Armenians, Azerbaijanis, Uzbeks, Kyrgyz, Tajiks, and Ukrainians into big Russian cities, something that is viewed unfavorably by some citizens.[32]
Median age and fertility
Median ages of ethnic groups vary considerably between groups. Ethnic Russians and other Slavic and Finnic groups have higher median age compared to the Caucasian groups.
Median ages are strongly correlated with fertility rates, ethnic groups with higher fertility rates have lower median ages, and vice versa. For example, in 2002, in the ethnic group with the lowest median age – Ingush – women 35 or older had, on average, 4.05 children; in the ethnic group with the highest median age – Jews – women 35 or older averaged only 1.37 children.[33] Ethnic Jews have both the highest median age and the lowest fertility rate; this is a consequence of Jewish emigration.[citation needed]
Ethnic Russians represent a significant deviation from the pattern, with second lowest fertility rate of all major groups, but relatively low median age (37.6 years). This phenomenon is at least partly due to the fact that children from mixed marriages are often registered as ethnic Russians in the census.[citation needed] The most noticeable trend in the past couple of decades is the convergence of birth rates between minorities (including Muslim minorities) and the Russian majority.[citation needed]
The following table shows the variation in median age and fertility rates according to 2002 census.[34]
Ethnic
GroupMedian
AgeMale Female Urban Urban
MUrban
FRural Rural
MRural
FChildren
/ woman
(15+)Children
/ woman
(35+)Predominant
religionRussian 37.6 34.0 40.5 37.1 33.5 40.1 39.0 35.7 41.7 1.446 1.828 Christianity Tatar 37.7 35.3 39.6 37.2 34.7 39.1 38.8 36.5 41.1 1.711 2.204 Islam Ukrainian 45.9 44.7 47.3 45.6 44.5 46.8 47.0 45.2 49.0 1.726 1.946 Christianity Bashkir 34.2 32.1 36.2 32.9 30.6 34.7 35.4 33.3 37.6 1.969 2.658 Islam Chuvash 38.6 36.4 40.4 37.9 36.3 39.1 39.4 36.5 42.5 1.884 2.379 Christianity Chechen 22.8 22.1 23.5 22.9 22.5 23.4 22.7 21.9 23.5 2.163 3.456 Islam Armenian 32.8 33.4 32.0 33.0 33.7 32.2 32.1 32.6 31.5 1.68 2.225 Christianity Mordvin 44.4 42.1 46.9 44.2 42.3 45.9 44.7 41.7 48.5 1.986 2.303 Christianity Avar 24.6 23.8 25.4 23.8 23.4 24.1 25.1 24.0 26.2 2.09 3.319 Islam Belarusian 48.0 45.9 50.2 47.7 45.8 49.6 49.1 46.1 52.4 1.765 1.941 Christianity Kazakh/Kyrgyz 30.2 29.4 31 29.5 29 30.1 30.6 29.7 31.4 2.015 2.964 Islam Udmurt 40.0 37.4 42.0 41.2 39.0 42.6 38.9 36.1 41.3 1.93 2.378 Christianity Azerbaijani 29.5 31.9 24.6 30.0 32.3 24.7 26.5 28.7 24.1 1.83 2.619 Islam Mari 36.7 34.5 38.5 36.4 34.6 37.7 36.9 34.5 39.3 1.917 2.493 Christianity German 39.7 38.2 41.2 39.6 38.0 41.0 40.0 38.4 41.4 1.864 2.443 Christianity Kabardin 28.2 27.1 29.3 28.8 27.4 30.2 27.7 26.9 28.4 1.799 2.654 Islam Ossetian 34.1 32.5 35.7 34.0 32.2 35.7 34.4 33.2 35.6 1.665 2.267 Christianity Dargwa 24.6 23.9 25.3 24.3 23.8 24.8 24.8 24.0 25.6 2.162 3.476 Islam Buryat 28.6 26.6 30.5 27.6 25.7 29.5 29.5 27.4 31.5 1.949 2.861 Buddhism Yakut 26.9 25.1 28.7 26.9 25.2 28.5 27.0 25.1 28.8 1.972 2.843 Christianity Kumyk 24.6 23.7 25.4 24.8 23.9 25.6 24.4 23.5 25.2 1.977 3.123 Islam Ingush 22.7 22.4 23.0 22.9 22.5 23.4 22.5 22.3 22.7 2.325 4.05 Islam Lezgian 25.4 25.2 25.7 25.0 25.2 24.8 25.9 25.2 26.6 2.045 3.275 Islam Komi 38.8 35.8 41.0 39.4 35.5 41.6 38.3 36.0 40.4 1.869 2.363 Christianity Tuvan 23.0 21.7 24.2 22.3 21.4 23.3 23.6 22.0 25.1 1.996 3.407 Buddhism Jewish 57.5 55.7 61.1 57.6 55.7 61.2 53.5 52.0 55.3 1.264 1.371 Judaism Karachay 29.5 28.3 30.5 27.6 26.4 28.9 30.5 29.5 31.5 1.86 2.836 Islam Kalmyk 31.3 29.2 33.3 28.6 26.3 31.3 33.9 32.6 35.1 1.853 2.625 Buddhism Adyghe 34.2 32.4 36.0 32.0 30.3 33.7 36.2 34.2 38.2 1.757 2.363 Islam Permyak 40.8 38.6 42.7 41.3 39.5 42.5 40.5 38.1 42.8 2.145 2.604 Christianity Balkar 30.1 29.5 30.7 29.3 28.8 29.8 30.9 30.1 31.9 1.689 2.624 Islam Karelian 45.7 42.4 48.6 44.7 41.3 47.2 47.0 43.5 51.2 1.823 2.108 Christianity Kazakh 30.7 28.4 32.9 30.1 27.9 32.4 31.2 28.8 33.5 1.872 2.609 Islam Altay 27.5 25.5 29.4 22.7 21.5 24.2 28.9 26.9 30.8 2.021 2.933 Buddhism Cherkess 31.2 30.1 32.3 29.7 28.3 30.9 32.1 31.1 33.3 1.807 2.607 Islam Languages
Main article: Languages of RussiaRussian is the common official language throughout Russia understood by 99% of its current inhabitants and widespread in many adjacent areas of Asia and Eastern Europe. National subdivisions of Russia have additional official languages (see their respective articles). There are more than 100 languages spoken in Russia, many of which are in danger of extinction.
Religion
Main article: Religion in Russia Cathedral of Christ the Saviour, Moscow
The most widespread religion in Russia is Eastern Orthodox Christianity, represented by the Russian Orthodox Church. A survey by ВЦИОМ in 2010 (with a 3.4% margin of error) found that 73% of the Russian population is Orthodox and 6% is Muslim. 1% believed in other faiths and the remainder were non-religious, or self-identified atheists or agnostics (self identified religious people and non-religious people can be atheists or agnostics). 16% of the population observed fasting during Lent.[35]
Over 80% of ethnic Russians identify themselves as Orthodox. Of these, approximately 2–4%[36] of the general population are integrated into church life (воцерковленные), while others attend on a less regular basis or not at all. Many non-religious ethnic Russians identify with the Orthodox faith for cultural reasons.[37] The majority of Muslims live in the Volga–Ural region and the North Caucasus, although Moscow, Saint Petersburg, and parts of Siberia also have sizable Muslim populations.[36][38] Other branches of Christianity present in Russia include Roman Catholicism (approx. 1%), Baptists, Pentecostals, Lutherans and other Protestant churches (together totalling about 0.5% of the population) and Old Believers. There is some presence of Judaism, Buddhism, and Krishnaism, as well. Shamanism and other pagan beliefs are present to some extent in remote areas, sometimes syncretized with one of the mainstream religions.
According to the 2002 Census, 9.96% of the Russian population belongs to ethnic groups which had traditionally practiced Islam (such as Tatars, Bashkirs, Chechens and Azeris). However the actual number of Muslims is expected to be much lower than this amount, due to the existence of a large number of Christian congregations among these groups (Keräşens and Nağaybäks among Tatars, Mozdok Christians among Kabardians, etc. According to Vyacheslav Sanin, one-third of Adzharians, 25% each of Tatars and Adyghe and more than 10% of Kazakhs living in Russia practice Christianity, with many more being atheist[39]). The number of Muslims among other ethnic groups is believed to be much smaller, amounting to only a few thousand.[40] Most of the Russian sources give a figure of around 6% of the total population based on surveys,[41] while Western sources give a figure of 10% to 15%.[42] Depending on sources the population varies, muslim population has also been estimated as high as 20 million, the Dawn newspaper says this value is a usual estimate.[43]
Roman Silantyev, an expert on Islam in Russia, claims that there are between 5,500 and 6,000 ethnic Slavs who are Muslim. At the same time there are more than 500,000 people of traditionally Muslim ethnicities who believe in Orthodoxy. One percent of all the adherents and over 400 priests in the Russian Orthodox Church are from Muslim ethnic groups.[40]
Education
Main article: Education in RussiaLiteracy
definition: age 15 and over can read and write
total literacy: 99.4% (2002)
male: 99.7%
female: 99.2%[38]Russia's free, widespread and in-depth educational system, inherited with almost no changes from the Soviet Union, has produced nearly 100% literacy. 97% of children receive their compulsory 9-year basic or complete 11-year education in Russian. Other languages are also used in their respective republics, for instance Tatar (1%), Yakut (0.4%) etc.[citation needed]
About 3 million students attend Russia's 519 institutions of higher education and 48 universities. As a result of great emphasis on science and technology in education, Russian medical, mathematical, scientific, and space and aviation research is generally of a high order.[44]
Labour force
The Russian labour force is undergoing tremendous changes. Although well-educated and skilled, it is largely mismatched to the rapidly changing needs of the Russian economy. The unemployment rate in Russia was 8.1% as of 2009. Unemployment is highest among women and young people. Following the breakup of the Soviet Union and the economic dislocation it engendered, the standard of living fell dramatically. However, since recovering from the 1998 economic crisis, the standard of living has been on the rise. As of 2007 about 15% of the population was living below the poverty line, compared to 40% in 1999.[45][46] The average yearly salary in Russia was $7,680 (about $13,800 PPP) as of May 2008, up from $455 per year in August 1999.[47][48]
According to the FMS, as of 2011, there were 7,000,000 immigrants working in Russia. Half of these were from Ukraine, while the remainder was mostly from Central Asia. Only 3 million or less than half of all the immigrants are legal. Illegal immigrants number 4 million, mostly from Tajikistan, Uzbekistan and Moldova.[31] The Census usually covers only a part of this population and the last one (2002 Census) counted one million non-citizens.
Health
Main article: Health in RussiaIn 2010, 1,140,368, or 56% of all deaths in Russia were caused by cardiovascular disease. The second leading cause of death was cancer which claimed 292,310 lives (14.3%). External causes of death such as suicide (1.7%), road accidents (1.4%), murders (0.9%), accidental alcohol poisoning (0.7%), and accidental drowning (0.5%), claimed 206,336 lives in total (10.2%). Other major causes of death were diseases of the digestive system (4.5%), respiratory disease (3.6%), infectious and parasitic diseases (1.6%), and tuberculosis (1.1%).[51] The infant mortality rate in 2010 was 7.5 deaths per 1,000 (down from 8.2 in 2009 and 16.9 in 1999).[52][53]
As of 2010, the average life expectancy in Russia was 63.03 years for males and 74.87 years for females.[54] The average Russian life expectancy of 68.98 years at birth is nearly 10 years shorter than the overall average figure for the European Union, or the United States.[55] The largest contributing factor to the relatively low life expectancy is high mortality among working-age males due to preventable causes such as accidents, alcohol poisoning, violent crimes, heart disease etc.[citation needed] Some infectious diseases are also implicated, such as AIDS/HIV and tuberculosis, which became more widespread in Russia in the 1990s because of the deterioration in the healthcare system. In the late 1950s, the USSR had a higher life expectancy than the United States,[56] but the Soviet Union has lagged behind Western countries in terms of mortality and life expectancy since the late 1960s. The life expectancy was about 70 in 1986,[57] prior to the transition-induced disruption of the healthcare system. The turmoil in the early 1990s caused life expectancy in Russia to steadily decrease while it was steadily increasing in the rest of the world. Recently however, Russian life expectancy has again begun to rise. Between 2005—2010 the male life expectancy in Russia rose by over four years, increasing the overall life expectancy by nearly 4 years to 68.98.[54]
Abortions
In the 1980s only 8–10% of married Russian women of reproductive age used hormonal and intrauterine contraception methods, compared to 20–40% in developed countries. This led to much higher abortion rates in Russia compared to developed countries: in the 1980s Russia had a figure of 120 abortions per 1,000 women of reproductive age compared with only 20 per 1,000 in Western countries. However, after the dissolution of the Soviet Union many changes took place, such as the demonopolization of the market for contraceptive drugs and media liberalization, which lead to a rapid conversion to more efficient pregnancy control practices. Abortion rates fell in the first half of the 1990s for the first time in Russia's history, even despite declining fertility rates. From the early 1990s to 2006, the number of expected abortions per women during her lifetime fell by nearly 2.5 times, from 3.4 to 1.2. As of 2004, the share of women of reproductive age using hormonal or intrauterine birth control methods was about 46% (29% intrauterine, 17% hormonal).[58]
Despite clear progress in family planning, the target of desired children at the desired time for a large portion of Russian families has not yet been achieved. According to a 2004 study, current pregnancies were termed "desired and timely" by 58% of respondents, while 23% described them as "desired, but untimely", and 19% said they were "undesired". The share of unexpected pregnancies remains much lower in countries with developed family planning culture, such as the Netherlands, whose percentage of unwanted pregnancies 20 years ago was half of that in Russia today.[58]
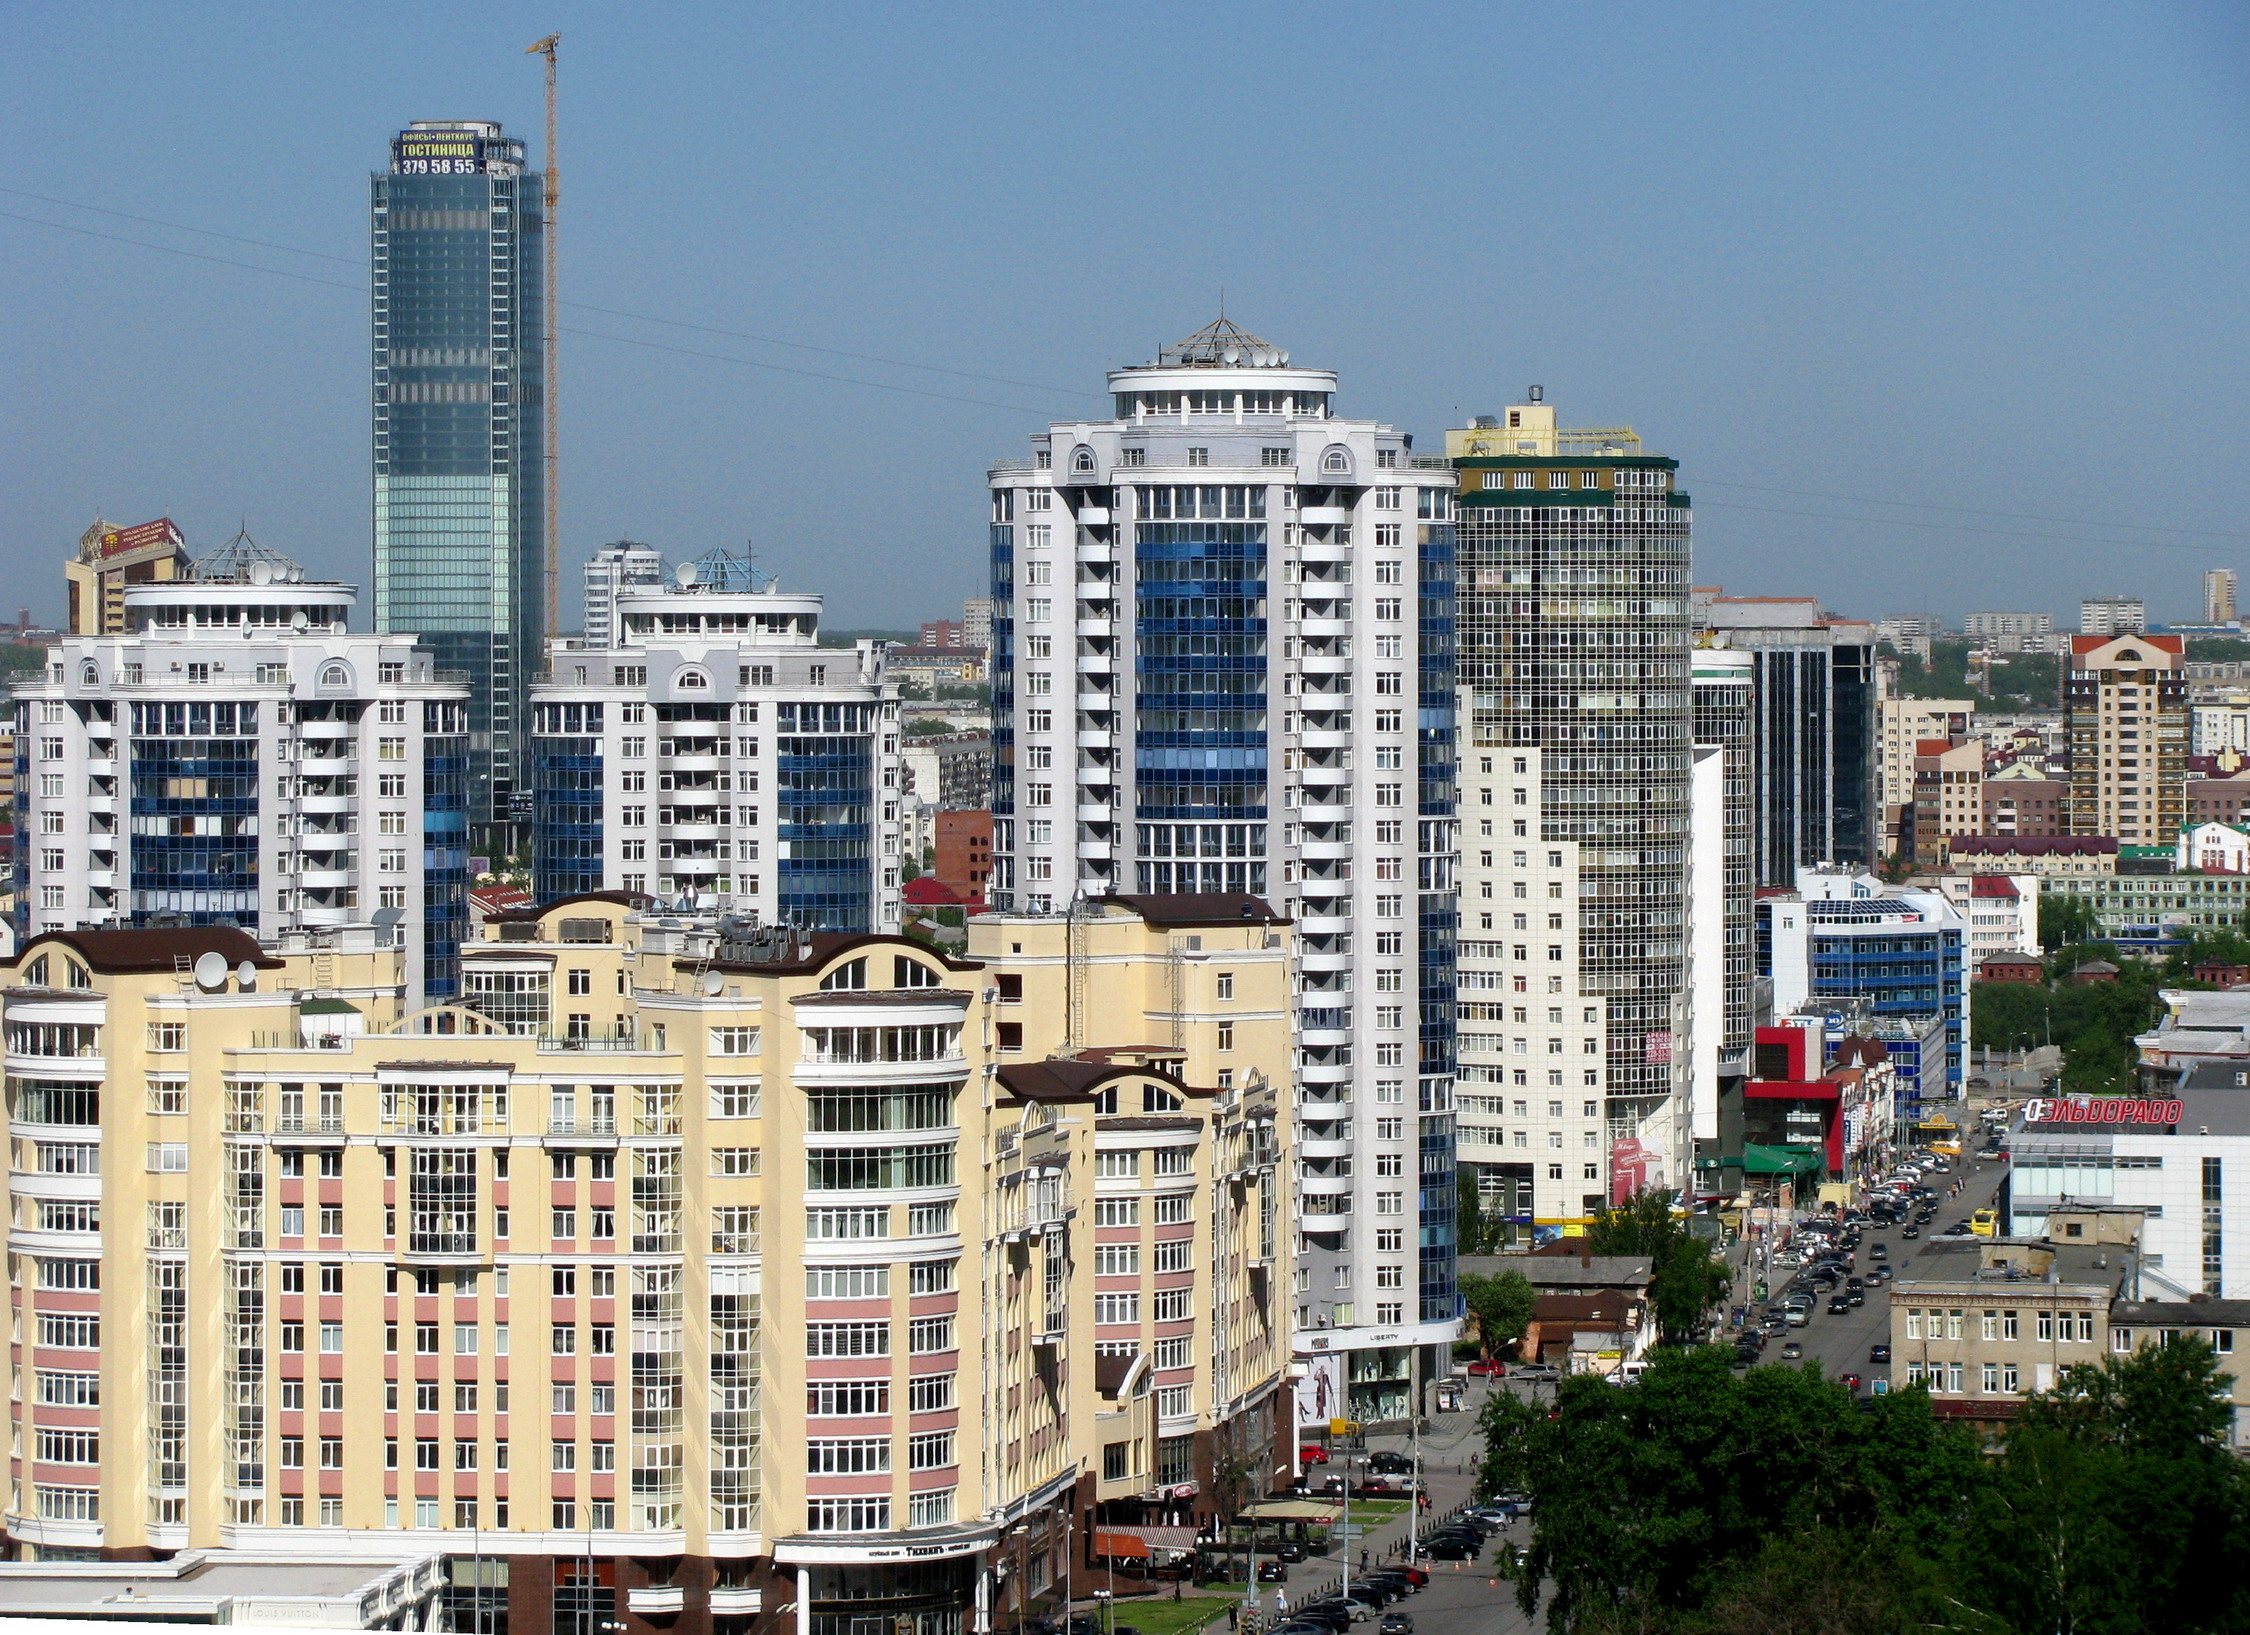
Population of main cities
Rank Core City Name in Russian Federal Subject Pop. 1 Moscow Москва Moscow 11,800,992 2 Saint Petersburg Санкт-Петербург Saint Petersburg 4,900,520 3 Novosibirsk Новосибирск Novosibirsk 1,397,191 4 Yekaterinburg Екатеринбург Sverdlovsk 1,332,264 5 Nizhny Novgorod Нижний Новгород Nizhny Novgorod 1,272,527 6 Samara Самара Samara 1 164 900 7 Kazan Казань Tatarstan 1 143 600 8 Omsk Омск Omsk 1,129,120 9 Chelyabinsk Челябинск Chelyabinsk 1,093,699 10 Rostov-on-Don Ростов-на-Дону Rostov 1,048,991 11 Ufa Уфа Bashkortostan 1,024,842 12 Volgograd Волгоград Volgograd 1,021,200 13 Krasnoyarsk Красноярск Krasnoyarsk 990,601 14 Perm Пермь Perm 985,794 15 Voronezh Воронеж Voronezh 843,496 16 Saratov Саратов Saratov 830,953 17 Tolyatti Тольятти Samara 720,346 18 Krasnodar Краснодар Krasnodar 710,686 19 Izhevsk Ижевск Udmurtia 611,043 20 Yaroslavl Ярославль Yaroslavl 606,336 Rosstat (2009)[59][60] Rural life
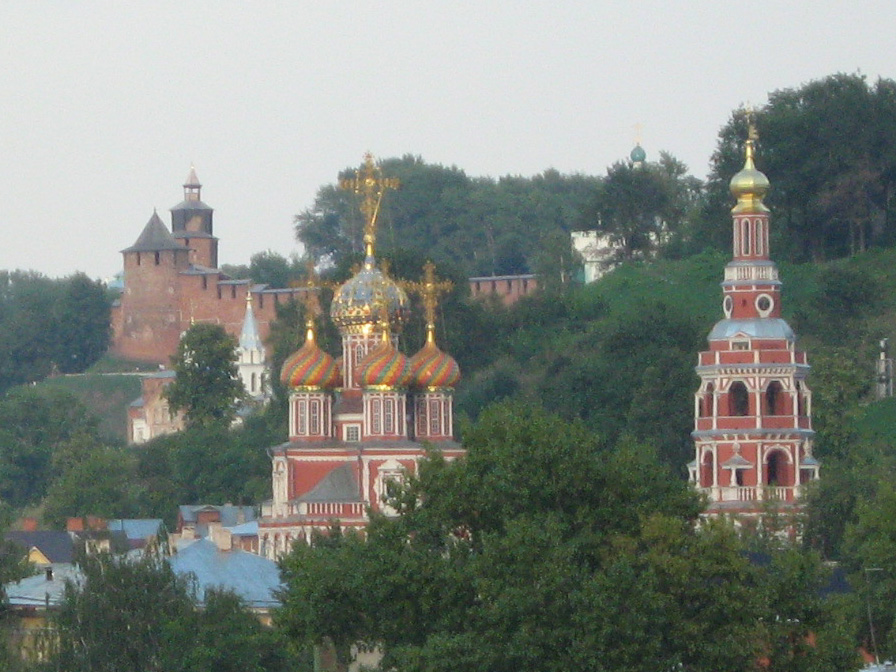
Rural life in Russia is distinct from many other nations. Russia is one of few nations that have small towns hundreds of kilometres from major population centres. Villages far from towns are classified by poor living conditions: low salaries, lack of heating equipment and sewage systems, and sometimes lack of electricity (mostly in Siberia). Sanitation and hygiene is also very poor in some areas that completely lack any plumbing whatsoever. Relatively few Russian people live in villages—rural population accounted for 27% of the total population according to the 2002 Russian Census.[61] Some people rent village houses and use them as dachas (summer houses).
Demographic statistics
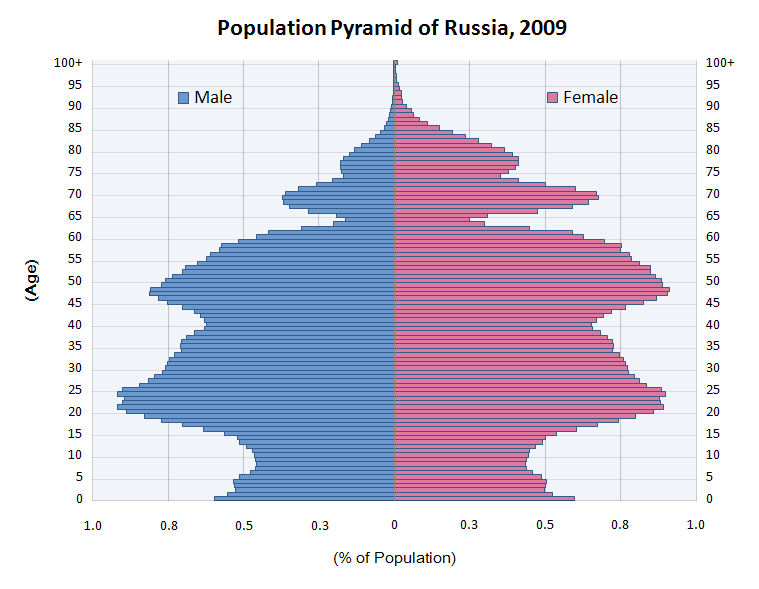
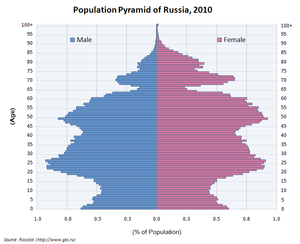 Population pyramid of Russia as of 1 January 2010
Population density
- 8.4 people per square kilometre (2010 Russian Census)[2]
Population distribution
- 74% urban, 26% rural (2010 Russian Census)
Population growth rate
- -0.06% (2010)[62]
Natural population growth rate
- -1.7 persons/1,000 population (2010)[52]
Births
- 1,789,600 (2010)[52]
Deaths
- 2,031,000 (2010)[52]
Birth rate
- 12.6 births/1,000 population (2010)[52]
Death rate
- 14.3 deaths/1,000 population (2010)[52]
Total fertility rate
Life expectancy at birth
total population: 68.98 years
male: 63.04 years
female: 74.87 years (2010) [54]Infant mortality rate
- 7.5 deaths/1,000 live births[52] (2010)
Under-five mortality rate
- 13 deaths/1,000 live births (2008)[63]
Median age
total: 38.8 years
male: 36.1 years
female: 41.1 years (2009)[64]Age structure
0–14 years: 14.9% (male 10,806,895/female 10,285,532)
15–64 years: 71.8% (male 48,864,763/female 53,048,315)
65 years and over: 13.3% (male 5,969,976/female 12,928,498) (2009)[64]Sex ratio
at birth: 1.05 male(s)/female
under 15 years: 1.05 male(s)/female
15–64 years: 0.92 male(s)/female
65 years and over: 0.46 male(s)/female
total population: 0.86 male(s)/female (2009) [64]Net migration rate
- 1.11 migrant(s)/1,000 population (2010)[62]
See also
- Demographics of Siberia
- Demographics of the Soviet Union
- Demography of Central Asia
- Health in Russia
- List of Russian people
- Soviet Census
- Russian Empire Census (1897)
- Russian Census (2002)
- Russian Census (2010)
References
- ^ Population data for 1992–2011 from Russian Federal Service of State Statistics (Rosstat)
- ^ a b "Сообщение Росстата". Perepis-2010.ru. http://www.perepis-2010.ru/message-rosstat.php. Retrieved 14 May 2011.
- ^ a b c 2009 demographic figures Rosstat Retrieved on 18 February 2010
- ^ a b Russia sees first population increase in 15 years BBC Retrieved on 18 February 2009
- ^ Russian death rates 1950–2008 Demoscope Retrieved on 29 May 2009
- ^ Russian birth rates 1950–2008 Demoscope Retrieved on 29 May 2009
- ^ Steven Eke (23 June 2005). "Russia's population falling fast". BBC News. http://news.bbc.co.uk/2/hi/europe/4125072.stm. Retrieved 15 March 2008.
- ^ United Nations ECOSOC,http://esa.un.org/unpp/ World Population Prospects: the 2008 Revision Population Database, Medium variant.
- ^ Rosstat Retrieved 16 March 2010
- ^ Sublime Oblivion: Faces of the Future Retrieved 16 March 2010
- ^ Russian policies ignite unprecedented birth rate in 2007 The Economic Times 21 March 2008
- ^ a b CIA Factbook – USA Retrieved on 27 March 2010
- ^ "WHO Life Expectancy Projections 2000 – ministry". World Health Organisation. http://www.who.int/inf-pr-2000/en/pr2000-life.html. Retrieved 7 January 2009.
- ^ Mass privatisation and the post-communist mortality crisis: a cross-national analysis The Lancet Retrieved on 02-12-09
- ^ Ex-communist reform – Mass murder and the market The Economist Retrieved on 02-12-09
- ^ a b Смертность в России сквозь призму приватизации (Russian)
- ^ "Vladimir Putin’s State-of-the-Nation Address". Mosnews.com. http://www.mosnews.com/column/2006/05/11/PutinAddress.shtml. Retrieved 2011-10-23.
- ^ Newsru, Население России за пять лет уменьшилось на 3,2 миллиона до 142 миллионов человек, 19.Oct.2007 Retrieved same date
- ^ In Russia the first time in 15 years recorded population growth Retrieved on 09-09-30
- ^ Tom Parfitt in Moscow. "Vladimir Putin pledges to spend £32bn on increasing Russian life expectancy , World news". The Guardian. UK. http://www.guardian.co.uk/world/2011/apr/21/vladimir-putin-increasing-russian-life-expectancy. Retrieved 14 May 2011.
- ^ E.Andreev, L.Darski, T.Kharkova "Histoire démographique de la Russie. 1927–1959"
- ^ E.Andreev, L.Darski, T.Kharkova "Histoire démographique de la Russie. 1927–1959"
- ^ "Goskomstat". Gks.ru. http://www.gks.ru/dbscripts/Cbsd/DBInet.cgi#1. Retrieved 14 May 2011.
- ^ Russia's Demographic "Crisis" 1996 RAND, page 13-18, Retrieved on 3 March 2009, ISBN 0-8330-2446-9
- ^ a b Tatiana Golikova on the expanded board meeting of the Health Ministry: "Despite the financial crisis, we have developed and launched a large-scale projects" Retrieved on 21 May 2010
- ^ a b c d "Rosstat TFR database". Gks.ru. http://www.gks.ru/dbscripts/Cbsd/DBInet.cgi?pl=2415002. Retrieved 14 May 2011.
- ^ Fertility Rate Statistics Demoscope.ru Retrieved on 10 September 2009
- ^ "The World Factbook 2009". Washington DC: Central Intelligence Agency. 2009. https://www.cia.gov/library/publications/the-world-factbook/rankorder/2127rank.html. Retrieved 7 December 09.
- ^ a b Ethnic groups in Russia, 2002 census, Demoscope Weekly. Retrieved 5 February 2009
- ^ a b Russia population census 2002, Vol. 4, Table 1. Retrieved 5 February 2009
- ^ a b "Новости NEWSru.com :: ФМС: в РФ нелегально работают 3 млн трудовых мигрантов, остальные 4 млн "халтурят" с налогами". Newsru.com. http://www.newsru.com/russia/23nov2010/migranty.html. Retrieved 14 May 2011.
- ^ Central Asia: Labor Migrants Face Abuse, Xenophobia Retrieved on 15 March 2008
- ^ 2002 Russian census, Женщины наиболее многочисленных национальностей по возрастным группам и числу рожденных детей по субъектам Российской Федерации
- ^ 2002 Russian census, Население отдельных национальностей по возрастным группам и полу по субъектам Российской Федерации
- ^ 21.04.2008 (21 April 2008). "83% россиян не соблюдают Великий пост / Апрель / 2008 / Сколько верующих / Дискуссии / Религия в светском обществе / СОВА". Sova-center.ru. http://www.sova-center.ru/religion/discussions/how-many/2008/04/d13143/. Retrieved 14 May 2011.
- ^ a b "Русская линия / Библиотека периодической печати / Как пишутся страшные сказки о Церкви". Rusk.ru. 31 August 2005. http://www.rusk.ru/st.php?idar=13228. Retrieved 14 May 2011.
- ^ in Russian:Социология религии[dead link]
- ^ a b Russia CIA World Factbook CIA World Factbook updated 6 March 2008
- ^ "Gorod 812". Online812.ru. 23 March 2011. http://www.online812.ru/2011/03/23/014/. Retrieved 14 May 2011.
- ^ a b "Ислам славянской национальности – новость в рубрике Общество на Newsland". Newsland.ru. http://newsland.ru/news/detail/id/630717/cat/42/. Retrieved 14 May 2011.
- ^ "(Russian)Опубликована подробная сравнительная статистика религиозности в России и Польше". religare.ru. 6 June 2007. http://www.religare.ru/article42432.htm. Retrieved 27 December 2007.
- ^ "CIA – The World Factbook". Cia.gov. https://www.cia.gov/library/publications/the-world-factbook/geos/rs.html. Retrieved 14 May 2011.
- ^ "Russian Muslims flood into streets for Eid prayers". Dawn.Com. 2011-08-31. http://www.dawn.com/2011/08/31/russian-muslims-flood-into-streets-for-eid-prayers.html. Retrieved 2011-10-23.
- ^ "Russia country guide – EUbusiness.com – business, legal and financial news and information from the European Union". Eubusiness.com. http://www.eubusiness.com/Russia/russia-country-guide/. Retrieved 14 May 2011.
- ^ Indexmundi Poverty Rates Retrieved on 16 March 2008
- ^ Российская газета. Неравномерности роста – Между регионами остаются серьёзные различия. (Rossiyskaya Gazeta, Unevenness of the growth – Significant discrepancies remain between the regions), 19.09.2007
- ^ Russians weigh an enigma with Putin’s protégé MSNBC Retrieved on 29 March 2009
- ^ "Putin’s Economy—Eight Years On". russiaprofile.org. http://www.russiaprofile.org/page.php?pageid=Business&articleid=a1187177738. Retrieved 27 December 2007.
- ^ "Life expectancy of the Russian Federation since 1950". Demoscope.ru. 26 April 2011. http://demoscope.ru/weekly/pril.php. Retrieved 14 May 2011.
- ^ Life Expectancy of the Russian Federation since 1992 Retrieved on 29 May 2008
- ^ Rosstat demographics report for the year 2008 Federal State Statistics Service, Retrieved on 3 June 2009
- ^ a b c d e f g Rosstat 2010 demographic figures Retrieved on 2 February 2011
- ^ Infant Mortality Rates Demoscope Retrieved on 27 April 2010
- ^ a b c Russian life expectancy figures for 2010 Rosstat Retrieved on 2 February 2011
- ^ "European Union". Central Intelligence Agency. https://www.cia.gov/library/publications/the-world-factbook/geos/ee.html. Retrieved 20 January 2008.
- ^ Yeltsin: healthier than the average Russian: Poverty, pollution and drink has slashed life expectancy, writes Phil Reeves The Independent, 29 September 1996
- ^ A Country Study: Soviet Union (Former) Federal Research Division, Library of Congress, Edited by Raymond E. Zickel 1989. Chapter 3 – Population – Vital Statistics
- ^ a b National Human Development Report Russian Federation 2008, UNDP,pages 47–49, Retrieved on 10 October 2009
- ^ Cities with over 1 million population Rosstat
- ^ Cities with population between 500,000 and 1 million Rosstat
- ^ "Resident population". Federal State Statistics Service. http://www.gks.ru/free_doc/2007/b07_12/05-01.htm. Retrieved 27 December 2007.
- ^ a b 2010 Rosstat overview Retrieved on 17 February 2011
- ^ UNICEF Rate of Progress Index UNICEF Retrieved on 27 December 2009
- ^ a b c Age structure of the Russian population as of 1 January 2009 Rosstat Retrieved on 8 October 2009
Further reading
- Gavrilova N.S., Gavrilov L.A. Aging Populations: Russia/Eastern Europe. In: P. Uhlenberg (Editor), International Handbook of the Demography of Aging, New York: Springer-Verlag, 2009, pp.113-131.
- Gavrilova N.S., Semyonova V.G., Dubrovina E., Evdokushkina G.N., Ivanova A.E., Gavrilov L.A. Russian Mortality Crisis and the Quality of Vital Statistics. Population Research and Policy Review, 2008, 27: 551-574.
- Gavrilova, N.S., Gavrilov, L.A., Semyonova, V.G., Evdokushkina, G.N., Ivanova, A.E. 2005. Patterns of violent crime in Russia. In: Pridemore, W.A. (ed.). Ruling Russia: Law, Crime, and Justice in a Changing Society. Boulder, CO: Rowman & Littlefield Publ., Inc, 117-145
- Gavrilova, N.S., Semyonova, V.G., Evdokushkina G.N., Gavrilov, L.A. The response of violent mortality to economic crisis in Russia. Population Research and Policy Review, 2000, 19: 397-419.
External links
- Igor Beloborodov, Demographic situation in Russia in 1992–2010 (report at the Moscow Demographic Summit — June, 2011)
- Nicholas Eberstadt, Russia’s Peacetime Demographic Crisis: Dimensions, Causes, Implications (NBR Project Report, May 2010)
- Edited by Julie DaVanzo, Gwen Farnsworth Russia's Demographic "Crisis" 1996 RAND ISBN 0-8330-2446-9
- Jessica Griffith The Regional Consequences of Russia’s Demographic Crisis University of Leicester
- Results of population policy and current demographic situation (2008)
- Interactive statistics for all countries, site of US Census bureau.
- 2009 World Population Data Sheet by the Population Reference Bureau
- Population density and distribution maps (text is in Russian; the topmost map shows population density based on 1996 data)
- Ethnic groups of Russia
- Problems with mortality data in Russia
- V. Borisov “Demographic situation in Russia and the role of mortality in reproduction of population”, 2005 (in English)
- Russian Empire:
- Iranians Diaspora in Russia: "The Persian Diaspora, List of Persians and Farsi Speaking Peoples living outside of Iran, Worldwide Outreach to Persians, Outreach to Muslims around the Globe". Farsinet.com. http://www.farsinet.com/pwo/diaspora.html. Retrieved 14 May 2011.
- (Russian) В погоне за малыми, an article about treatment of minorities in the Russian Empire, Kommersant-Money, 25 October 2005
- Choice between mass migration and birth rate increase as possible solutions of depopulation problem in Russia (in Russian)
People from Russia Leaders and religious - Pre-1168
- 1168–1917
- 1922–1991
- 1991–present
- RSFSR leaders
- General secretaries
- Soviet premiers (1st deputies)
- Soviet heads of state (and their spouses)
- Prime ministers (1st deputies)
- Foreign ministers
- Prosecutors general
- Metropolitans and patriarchs
- Saints
Military and explorers - Field marshals
- Soviet marshals
- Admirals
- Aviators
- Cosmonauts
Scientists and inventors - Aerospace engineers
- Astronomers and astrophysicists
- Biologists
- Chemists
- Earth scientists
- Electrical engineers
- IT developers
- Linguists and philologists
- Mathematicians
- Naval engineers
- Physicians and psychologists
- Physicists
- Weaponry makers
Artists and writers Sportspeople - Chess players
Demographics of Europe Sovereign
states- Albania
- Andorra
- Armenia
- Austria
- Azerbaijan
- Belarus
- Belgium
- Bosnia and Herzegovina
- Bulgaria
- Croatia
- Cyprus
- Czech Republic
- Denmark
- Estonia
- Finland
- France
- Georgia
- Germany
- Greece
- Hungary
- Iceland
- Ireland
- Italy
- Kazakhstan
- Latvia
- Liechtenstein
- Lithuania
- Luxembourg
- Macedonia
- Malta
- Moldova
- Monaco
- Montenegro
- Netherlands
- Norway
- Poland
- Portugal
- Romania
- Russia
- San Marino
- Serbia
- Slovakia
- Slovenia
- Spain
- Sweden
- Switzerland
- Turkey
- Ukraine
- United Kingdom
- (England
- Northern Ireland
- Scotland
- Wales)
- Vatican City
States with limited
recognition- Abkhazia
- Kosovo
- Nagorno-Karabakh
- Northern Cyprus
- South Ossetia
- Transnistria
Dependencies
and other territories- Åland
- Faroe Islands
- Gibraltar
- Guernsey
- Jan Mayen
- Jersey
- Isle of Man
- Svalbard
Other entities - European Union
Ethnic groups in Europe Sovereign
states- Albania
- Andorra
- Armenia
- Austria
- Azerbaijan
- Belarus
- Belgium
- Bosnia and Herzegovina
- Bulgaria
- Croatia
- Cyprus
- Czech Republic
- Denmark
- Estonia
- Finland
- France
- Georgia
- Germany
- Greece
- Hungary
- Iceland
- Ireland
- Italy
- Kazakhstan
- Latvia
- Liechtenstein
- Lithuania
- Luxembourg
- Macedonia
- Malta
- Moldova
- Monaco
- Montenegro
- Netherlands
- Norway
- Poland
- Portugal
- Romania
- Russia
- San Marino
- Serbia
- Slovakia
- Slovenia
- Spain
- Sweden
- Switzerland
- Turkey
- Ukraine
- United Kingdom
- (England
- Northern Ireland
- Scotland
- Wales)
States with limited
recognition- Abkhazia
- Kosovo
- Nagorno-Karabakh
- Northern Cyprus
- South Ossetia
- Transnistria
Dependencies
and other territories- Åland
- Faroe Islands
- Gibraltar
- Guernsey
- Jan Mayen
- Jersey
- Isle of Man
- Svalbard
Other entities Demographics of Asia Sovereign
states- Afghanistan
- Armenia
- Azerbaijan
- Bahrain
- Bangladesh
- Bhutan
- Brunei
- Burma (Myanmar)
- Cambodia
- People's Republic of China
- Cyprus
- East Timor (Timor-Leste)
- Egypt
- Georgia
- India
- Indonesia
- Iran
- Iraq
- Israel
- Japan
- Jordan
- Kazakhstan
- North Korea
- South Korea
- Kuwait
- Kyrgyzstan
- Laos
- Lebanon
- Malaysia
- Maldives
- Mongolia
- Nepal
- Oman
- Pakistan
- Philippines
- Qatar
- Russia
- Saudi Arabia
- Singapore
- Sri Lanka
- Syria
- Tajikistan
- Thailand
- Turkey
- Turkmenistan
- United Arab Emirates
- Uzbekistan
- Vietnam
- Yemen
States with limited
recognitionDependencies and
other territories- Christmas Island
- Cocos (Keeling) Islands
- Hong Kong
- Macau
Categories:- Demographics of Russia
- Russian population groups
- Ethnic groups in Russia


Wikimedia Foundation. 2010.