- Demographics of Romania
-
Demographics of Romania 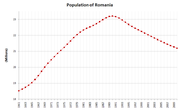
1961–2010Population: 20,298,580 (2010)[1] Growth rate: -0.22% (2010) Birth rate: 9.9 births/1,000 population (2010) Death rate: 12.1 deaths/1,000 population (2010) Life expectancy: 72.18 years (2008 est.) –male: 68.69 years –female: 75.89 years Fertility rate: 1.38 children born/woman (2008 est.) Infant mortality rate: {{{infant_mortality}}} Age structure: 0-14 years: 15.6% (male 1,778,864/female 1,687,659) Sex ratio: At birth: 1.06 male(s)/female (2008 est.) Under 15: 1.05 male(s)/female 15-64 years: 0.99 male(s)/female 65-over: 0.69 male(s)/female Nationality: Nationality: noun: Romanian(s) adjective: Romanian Major ethnic: Romanian Minor ethnic: Hungarian, German, Roma, Turkish-Tatar Language: Spoken: Romanian This article is about the demographic features of the population of Romania, including population density, ethnicity, education level, health of the populace, economic status, religious affiliations and other aspects of the population.
About 89.4% of the people of Romania are ethnic Romanians, whose language, Romanian, is an Eastern Romance language, descended primarily from Latin with some Slavic, German, Greek, Hungarian and Turkish borrowings. Romanians are by far the most numerous group of speakers of an Eastern Romance language today. It has been said that they constitute "an island of Latinity"[2] in Eastern Europe, surrounded on all sides either by Slavic peoples or by the Hungarians.
The Hungarian minority in Romania constitutes the country's largest minority, 6.6 per cent of the population.[3]
Contents
Population
Sources give varied estimates for Romania's historical population. The National Institute for Research and Development in Informatics (NIRDI) gives the following numbers:
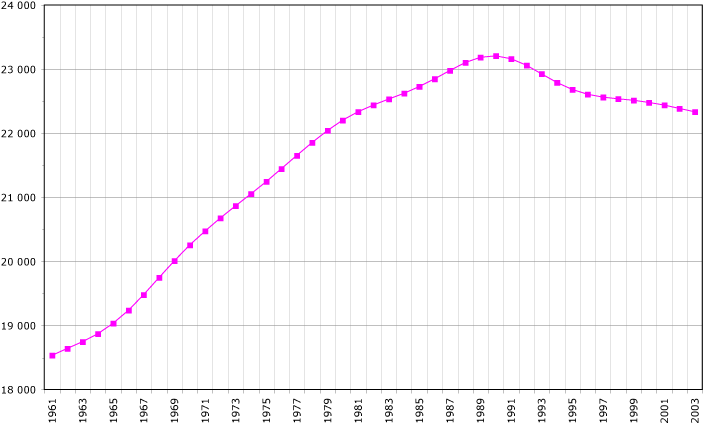
Population evolution
(censuses)
See also Demographic history of Romania
- 1866 — 4,424,961 (Wallachia and Moldavia without Bessarabia, Bucovina, and Transylvania)
- 1912 — 12,923,600 (adding Transylvania, Bessarabia, and Bukovina)
- 1930 — 18,057,028 (14,280,729 is without Bessarabia and Northern Bukovina)
- 1948 — 15,872,625
- 1956 — 17,489,450
- 1966 — 19,103,163
- 1977 — 21,559,910
- 1992 — 22,760,449[4]
- 2002 — 21,677,676
- 2011 —
- Statistics 1859–1992 from NIRDI[5]
However, the following numbers, very different for the early years, come from the Tacitus Historical Atlas[7]
- 1844 — 3.6 million
- 1861 — 3.9 million
- 1870 — 4.3 million
- 1880 — 4.5 million
- 1890 — 5.3 million
- 1900 — 6.0 million
- 1910 — 6.9 million
- 1915 — 7.8 million
- 1921 — 15.6 million
- 1930 — 17.9 million
- 1939 — 19.9 million
- 1940 — 15.9 million
- 1941 — 13.6 million
- 1946 — 15.8 million
- Statistics 1844–1946 from Tacitus Historical Atlas[8]
Thereafter, the numbers are essentially the same as the NIRDI numbers. (See also Demographic history of Romania.)
Ethnic groups
Main article: Minorities of Romania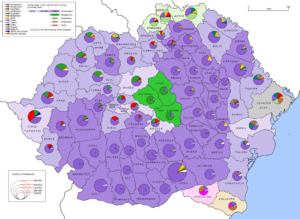 Ethnic map (census 1930)
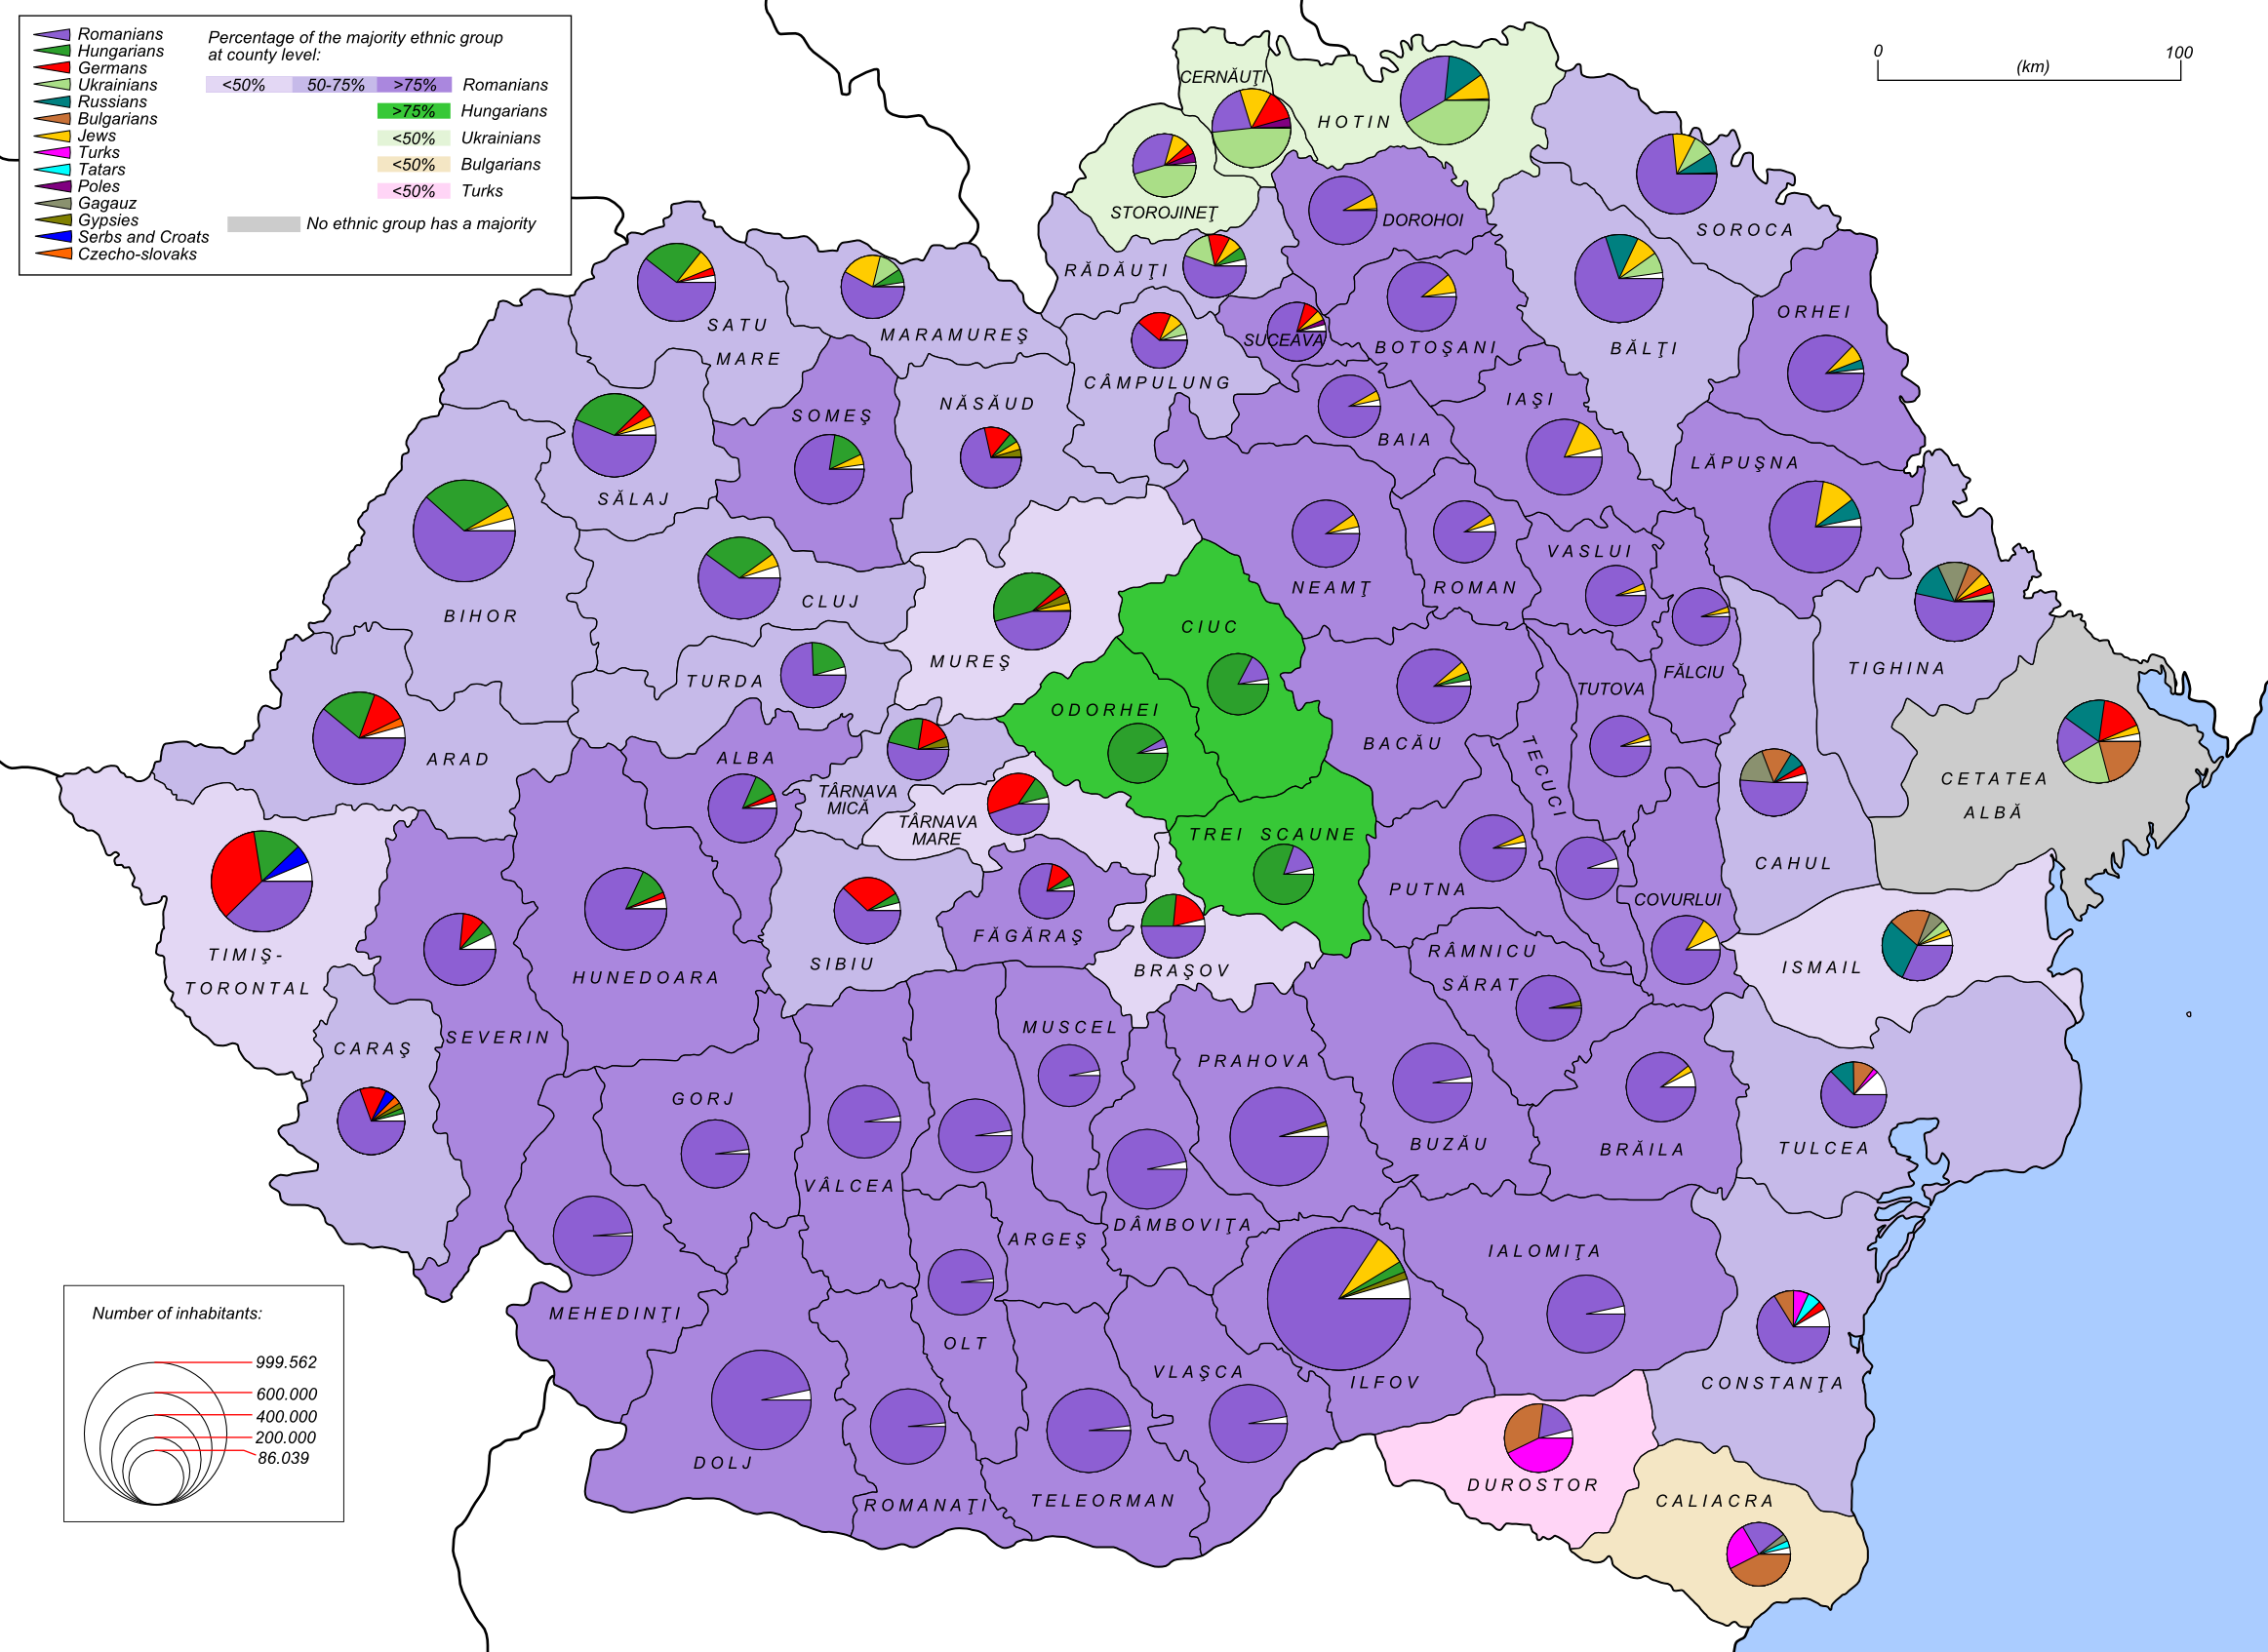
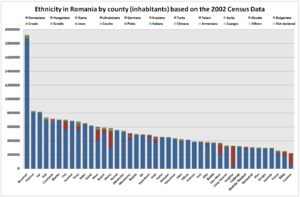 Ethnicity in Romania by county (inhabitants) based on the 2002 census data
 Ethnicity in Romania by county (%) based on 2002 census data
Before World War II, minorities represented more than 28% of the total population. During the war that percentage was halved, largely by the loss of the border areas of Bessarabia and northern Bukovina (to the former Soviet Union, now Moldova and Ukraine) and southern Dobrudja (to Bulgaria). Two-thirds of the ethnic German population either left or were deported after World War II, leaving behind a population of 60,000 ethnic Germans in Romania today. Of a total population of over half a million Jews before World War II, about half were killed during the Holocaust.[9] Mass emigration, mostly to Israel and United States, has reduced the surviving Jewish community to less than 6,000 in 2002.[10]
Hungarians (Székely and other Magyars; see Hungarians in Romania), especially in Harghita, Covasna, and Mureş counties, and the Roma are the principal minorities, with a declining German population (Banat Swabians in Timiş; Transylvanian Saxons in Sibiu, Braşov and elsewhere), and smaller numbers of Czechs, Slovaks, Serbs, Chinese, Croats, and Banat Bulgarians (in Banat), Ukrainians (especially in Maramureş and Bukovina), Greeks of Romania (especially in Brăila and Constanţa), Turks and Tatars (mainly in Constanţa), Armenians, Russians (Lipovans, Old Believers in Tulcea), Jews and others. Since the Romanian Revolution of 1989, Bucharest has again become an increasingly cosmopolitan city, including identifiable Chinese and Irish presences. Minority populations are greatest in Transylvania and the Banat, areas in the north and west of the country, which were possessions of the Habsburg Empire (after 1867 the Austro-Hungarian Empire) until World War I. Even before the union with Romania, ethnic Romanians comprised the overall majority in Transylvania. However, ethnic Hungarians and Germans were the dominant urban population until relatively recently, while Hungarians still constitute the majority in Harghita and Covasna counties.
Population of Romania according to ethnic group in 1930 [11] Ethnicity number % Romanians 12,981,324 71.9 Hungarians 1,425,507 7.9 Germans 745,421 4.1 Jews 728,115 4.0 Ruthenians and Ukrainians 582,115 3.2 Russians 409,150 2.3 Bulgarians 366,384 2.0 Romani 262,501 1.5 Turks 154,772 0.9 Gagauzians 105,750 0.6 Czechs and Slovaks 51,842 0.3 Serbs, Croats and Slovenes 51,062 0.3 Poles 48,310 0.3 Greeks 26,495 0.1 Tatars 22,141 0.1 Armenians 15,544 0.0 Hutsuls 12,456 0.0 Albanians 4,670 0.0 Others 56,355 0.3 Undeclared 7,114 0.0 Total 18,057,028 100.0 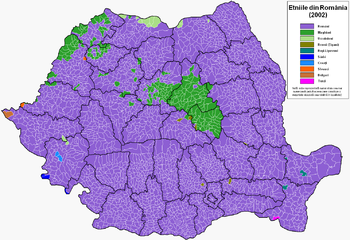 Ethnic map of Romania in 2002
Population of Romania according to ethnic group 1948–2002 Ethnic
groupcensus 19481 census 19562 census 19663 census 19774 census 19925 census 20026 Number % Number % Number % Number % Number % Number % Romanians 13,597,613 85.7 14,996,114 85.7 16,746,510 87.7 18,999,565 88.1 20,408,542 89.5 19,409,400 89.5 Hungarians 1,499,851 9.4 1,587,675 9.1 1,619,592 8.5 1,713,928 7.9 1,624,959 7.1 1,434,377 6.6 Romani 53,425 0.3 104,216 0.6 64,197 0.3 227,398 1.05 401,087 1.8 535,250 2.5 Ukrainians 37,582 0.2 60,479 0.4 54,705 0.3 55,510 0.3 65,764 0.3 61,091 0.3 Germans 343,913 2.2 384,708 2.2 382,595 2.0 359,109 1.6 119,462 0.5 60,088 0.3 Russians 39,332 0.2 38,731 0.2 39,483 0.2 21,206 0.2 7,983 0.1 36,397 0.2 Lipovans 11,090 0.1 30,623 0.2 Turks 28,782 0.2 14,329 0.2 18,040 0.1 23,422 0.1 29,832 0.1 32,596 0.2 Tatars 20,469 0.2 22,151 0.1 23,369 0.1 24,596 0.1 24,137 0.1 Serbs 45,447 0.3 46,517 0.3 44,236 0.3 34,429 0.2 29,408 0.1 22,518 0.1 Croats 7,500 0.0 4,085 0.0 6,786 0.0 Slovenes 175 0.0 Slovaks 35,143 0.2 23,331 0.2 22,151 0.1 21,286 0.1 19,594 0.1 17,199 0.2 Czechs 11,821 0.0 9,978 0.0 7,683 0.0 5,797 0.0 3,938 0.0 Bulgarians 13,408 0.1 12,040 0.1 11,193 0.1 10,372 0.0 9,851 0.1 8,092 0.0 Greeks 8,696 0.1 11,166 0.0 9,088 0.0 6,262 0.0 3,940 0.0 6,513 0.0 Jews 138,795 0.9 146,264 0.8 42,888 0.2 24,667 0.1 8,955 0.0 5,870 0.0 Poles 6,753 0.0 7,627 0.0 5,860 0.0 4,641 0.0 4,232 0.0 3,671 0.0 Armenians 6,987 0.0 6,441 0.0 3,436 0.0 2,342 0.0 1,957 0.0 1,780 0.0 Macedonians 1,176 0.0 6,867 0.0 731 0.0 Aromanians 982 0.0 21,736 0.1 Others/undeclared 15,897 0.1 17,522 0.1 6,990 0.0 5,731 0.0 9,368 0.0 28,303 0.1 Total 15,872,624 17,489,450 19,103,163 21,559,910 22,810,035 21,698,181 1 The results of the 1948 census are according to language. 2 Source: [1]. 3 Source: [2]. 4 Source: [3]. 5 Source: [4]. 6 Source: [5]. 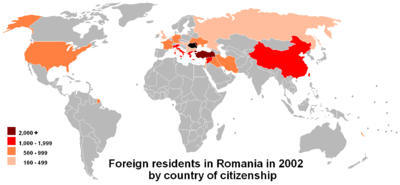
Vital statistics[12][13][14]
Before WW I
Average population (x 1000) Live births Deaths Natural change Crude birth rate (per 1000) Crude death rate (per 1000) Natural change (per 1000) 1900 6 050 235 000 146 000 89 000 38.8 24.2 14.6 1901 6 120 241 000 160 000 81 000 39.3 26.2 13.1 1902 6 210 242 000 172 000 70 000 39.0 27.7 11.3 1903 6 290 252 000 156 000 96 000 40.1 24.8 15.3 1904 6 390 256 000 156 000 100 000 40.1 24.4 15.7 1905 6 480 248 000 160 000 88 000 38.3 24.7 13.6 1906 6 570 262 000 157 000 105 000 39.9 23.9 16.0 1907 6 680 274 000 176 000 98 000 41.1 26.3 14.8 1908 6 770 273 000 185 000 88 000 40.3 27.4 12.9 1909 6 860 282 000 188 000 94 000 41.1 27.4 13.7 1910 6 970 274 000 173 000 101 000 39.3 24.8 14.5 1911 7 090 300 000 179 000 121 000 42.3 25.3 17.0 1912 7 240 314 000 166 000 148 000 43.4 22.9 20.5 1913 7 360 310 000 192 000 118 000 42.1 26.1 16.0 1914 7 770 327 000 183 000 144 000 42.1 23.5 18.6 1915 7 910 320 000 194 000 126 000 40.5 24.5 16.0 Between WW I and WW II
Average population (x 1000) Live births Deaths Natural change Crude birth rate (per 1000) Crude death rate (per 1000) Natural change (per 1000) 1919 15 920 366 000 328 000 38 000 23.0 20.6 2.4 1920 16 010 539 000 415 000 124 000 33.7 25.9 7.8 1921 16 240 620 000 372 000 248 000 38.2 22.9 15.3 1922 16 500 614 000 376 000 238 000 37.2 22.8 14.4 1923 16 770 609 000 372 000 237 000 36.4 22.1 14.3 1924 16 990 623 000 383 000 240 000 36.7 22.5 14.2 1925 17 190 606 000 362 000 244 000 35.2 21.1 14.1 1926 17 460 608 000 373 000 235 000 34.8 21.4 13.4 1927 17 690 603 000 393 000 210 000 34.1 22.2 11.9 1928 17 970 624 000 352 000 272 000 34.7 19.6 15.1 1929 17 640 601 000 378 000 223 000 34.1 21.4 12.7 1930 17 870 625 000 347 000 278 000 35.0 19.4 15.6 1931 18 190 605 000 379 000 226 000 33.3 20.8 12.5 1932 18 427 662 000 399 000 263 000 35.9 21.7 14.2 1933 18 653 598 000 348 000 250 000 32.1 18.7 13.4 1934 18 914 612 416 390 668 221 748 32.4 20.7 11.7 1935 19 088 585 503 402 720 182 783 30.7 21.1 9.6 1936 19 319 608 906 382 179 226 727 31.5 19.8 11.7 1937 19 535 601 310 377 954 223 356 30.8 19.3 11.4 1938 19 750 585 423 379 445 205 978 29.6 19.2 10.4 1939 19 934 563 817 370 348 193 469 28.3 18.6 9.7 After WW II
Average population (x 1000) Live births Deaths Natural change Crude birth rate (per 1000) Crude death rate (per 1000) Natural change (per 1000) 1946 15 760 391 273 296 439 94 834 24.8 18.8 6.0 1947 15 860 370 562 349 331 21 231 23.4 22.0 1.3 1948 15 893 379 868 248 238 131 630 23.9 15.6 8.3 1949 16 084 444 065 219 881 224 184 27.6 13.7 13.9 1950 16 311 426 820 202 010 224 810 26.2 12.4 13.8 1951 16 464 412 534 210 021 202 513 25.1 12.8 12.3 1952 16 630 413 217 195 287 217 930 24.8 11.7 13.1 1953 16 847 401 717 194 752 206 965 23.8 11.6 12.3 1954 17 040 422 346 195 091 227 255 24.8 11.4 13.3 1955 17 325 442 864 167 535 275 329 25.6 9.7 15.9 1956 17 583 425 704 174 847 250 857 24.2 9.9 14.3 1957 17 829 407 819 181 923 225 896 22.9 10.2 12.7 1958 18 056 390 500 156 493 234 007 21.6 8.7 13.0 1959 18 226 368 007 186 767 181 240 20.2 10.2 9.9 1960 18 403 352 241 160 720 191 521 19.1 8.7 10.4 1961 18 567 324 859 161 936 162 923 17.5 8.7 8.8 1962 18 681 301 985 172 429 129 556 16.2 9.2 6.9 1963 18 813 294 886 155 767 139 119 15.7 8.3 7.4 1964 18 927 287 383 152 476 134 907 15.2 8.1 7.1 1965 19 027 278 362 163 393 114 969 14.6 8.6 6.0 1966 19 141 273 678 157 445 116 233 14.3 8.2 6.1 1967 19 285 527 764 179 129 348 635 27.4 9.3 18.1 1968 19 721 526 091 188 509 337 582 26.7 9.6 17.1 1969 20 010 465 764 201 225 264 539 23.3 10.1 13.2 1970 20 253 427 034 193 255 233 779 21.1 9.5 11.5 1971 20 470 400 146 194 306 205 840 19.5 9.5 10.1 1972 20 663 389 153 189 793 199 360 18.8 9.2 9.6 1973 20 828 378 696 203 559 175 137 18.2 9.8 8.4 1974 21 029 427 732 191 286 236 446 20.3 9.1 11.2 1975 21 245 418 185 197 538 220 647 19.7 9.3 10.4 1976 21 446 417 353 204 873 212 480 19.5 9.6 9.9 1977 21 658 423 958 208 685 215 273 19.6 9.6 9.9 1978 21 855 416 598 211 846 204 752 19.1 9.7 9.4 1979 22 048 410 603 217 509 193 094 18.6 9.9 8.8 1980 22 201 398 904 231 876 167 028 18.0 10.4 7.5 1981 22 353 381 101 224 635 156 466 17.0 10.0 7.0 1982 22 478 344 369 224 120 120 249 15.3 10.0 5.3 1983 22 553 321 498 233 892 87 606 14.3 10.4 3.9 1984 22 625 350 741 233 699 117 042 15.5 10.3 5.2 1985 22 725 358 797 246 670 112 127 15.8 10.9 4.9 1986 22 823 376 896 242 330 134 566 16.5 10.6 5.9 1987 22 940 383 199 254 286 128 913 16.7 11.1 5.6 1988 23 054 380 043 253 370 126 673 16.5 11.0 5.5 1989 23 152 369 544 247 306 122 238 16.0 10.7 5.3 1990 23 207 314 746 247 086 67 660 13.6 10.6 2.9 1991 23 185 275 275 251 760 23 515 11.9 10.9 1.0 1992 22 789 260 393 263 855 -3 462 11.4 11.6 -0.2 1993 22 755 249 994 263 323 -13 329 11.0 11.6 -0.6 1994 22 731 246 736 266 101 -19 365 10.9 11.7 -0.9 1995 22 681 236 640 271 672 -35 032 10.4 12.0 -1.5 1996 22 608 231 348 286 158 -54 810 10.2 12.7 -2.4 1997 22 546 236 891 279 316 -42 425 10.5 12.4 -1.9 1998 22 503 237 297 269 166 -31 869 10.5 12.0 -1.4 1999 22 458 234 600 265 194 -30 594 10.4 11.8 -1.4 2000 22 435 234 521 255 820 -21 299 10.5 11.4 -0.9 2001 22 132 220 368 259 603 -39 235 10.0 11.7 -1.8 2002 21 803 210 529 269 666 -59 137 9.7 12.4 -2.7 2003 21 734 212 459 266 575 -54 116 9.8 12.3 -2.5 2004 21 673 216 261 258 890 -42 629 10.0 11.9 -2.0 2005 21 635 221 020 262 101 -41 081 10.2 12.1 -1.9 2006 21 588 219 483 258 094 -38 611 10.2 12.0 -1.8 2007 21 547 214 728 251 965 -37 237 10.0 11.7 -1.7 2008 21 513 221 900 253 202 -31 302 10.3 11.8 -1.5 2009 21 480 222 400 257 200 -34 800 10.4 12.0 -1.6 2010 21 432 212 200 259 700 -47 500 9.9 12.1 -2.2 Note: The 2010 Romanian Census gave a figure of 20,298,580, which would translate to a birth rate of 10.5 and a death rate of 12.8.
Largest urban agglomerations
Largest cities of Romania
July 1, 2010 estimates[15]Rank City Name County Pop. Rank City Name County Pop. 
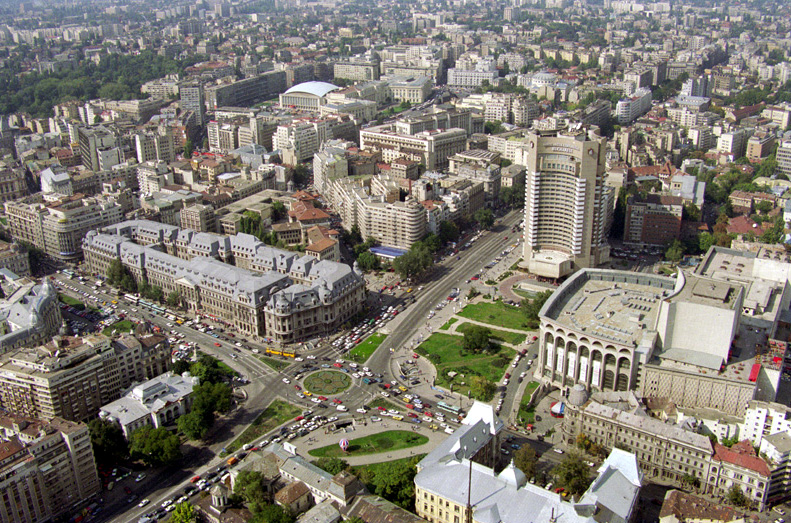
Bucharest
1 Bucharest Bucharest 1,942,254 11 Oradea Bihor 204,477 
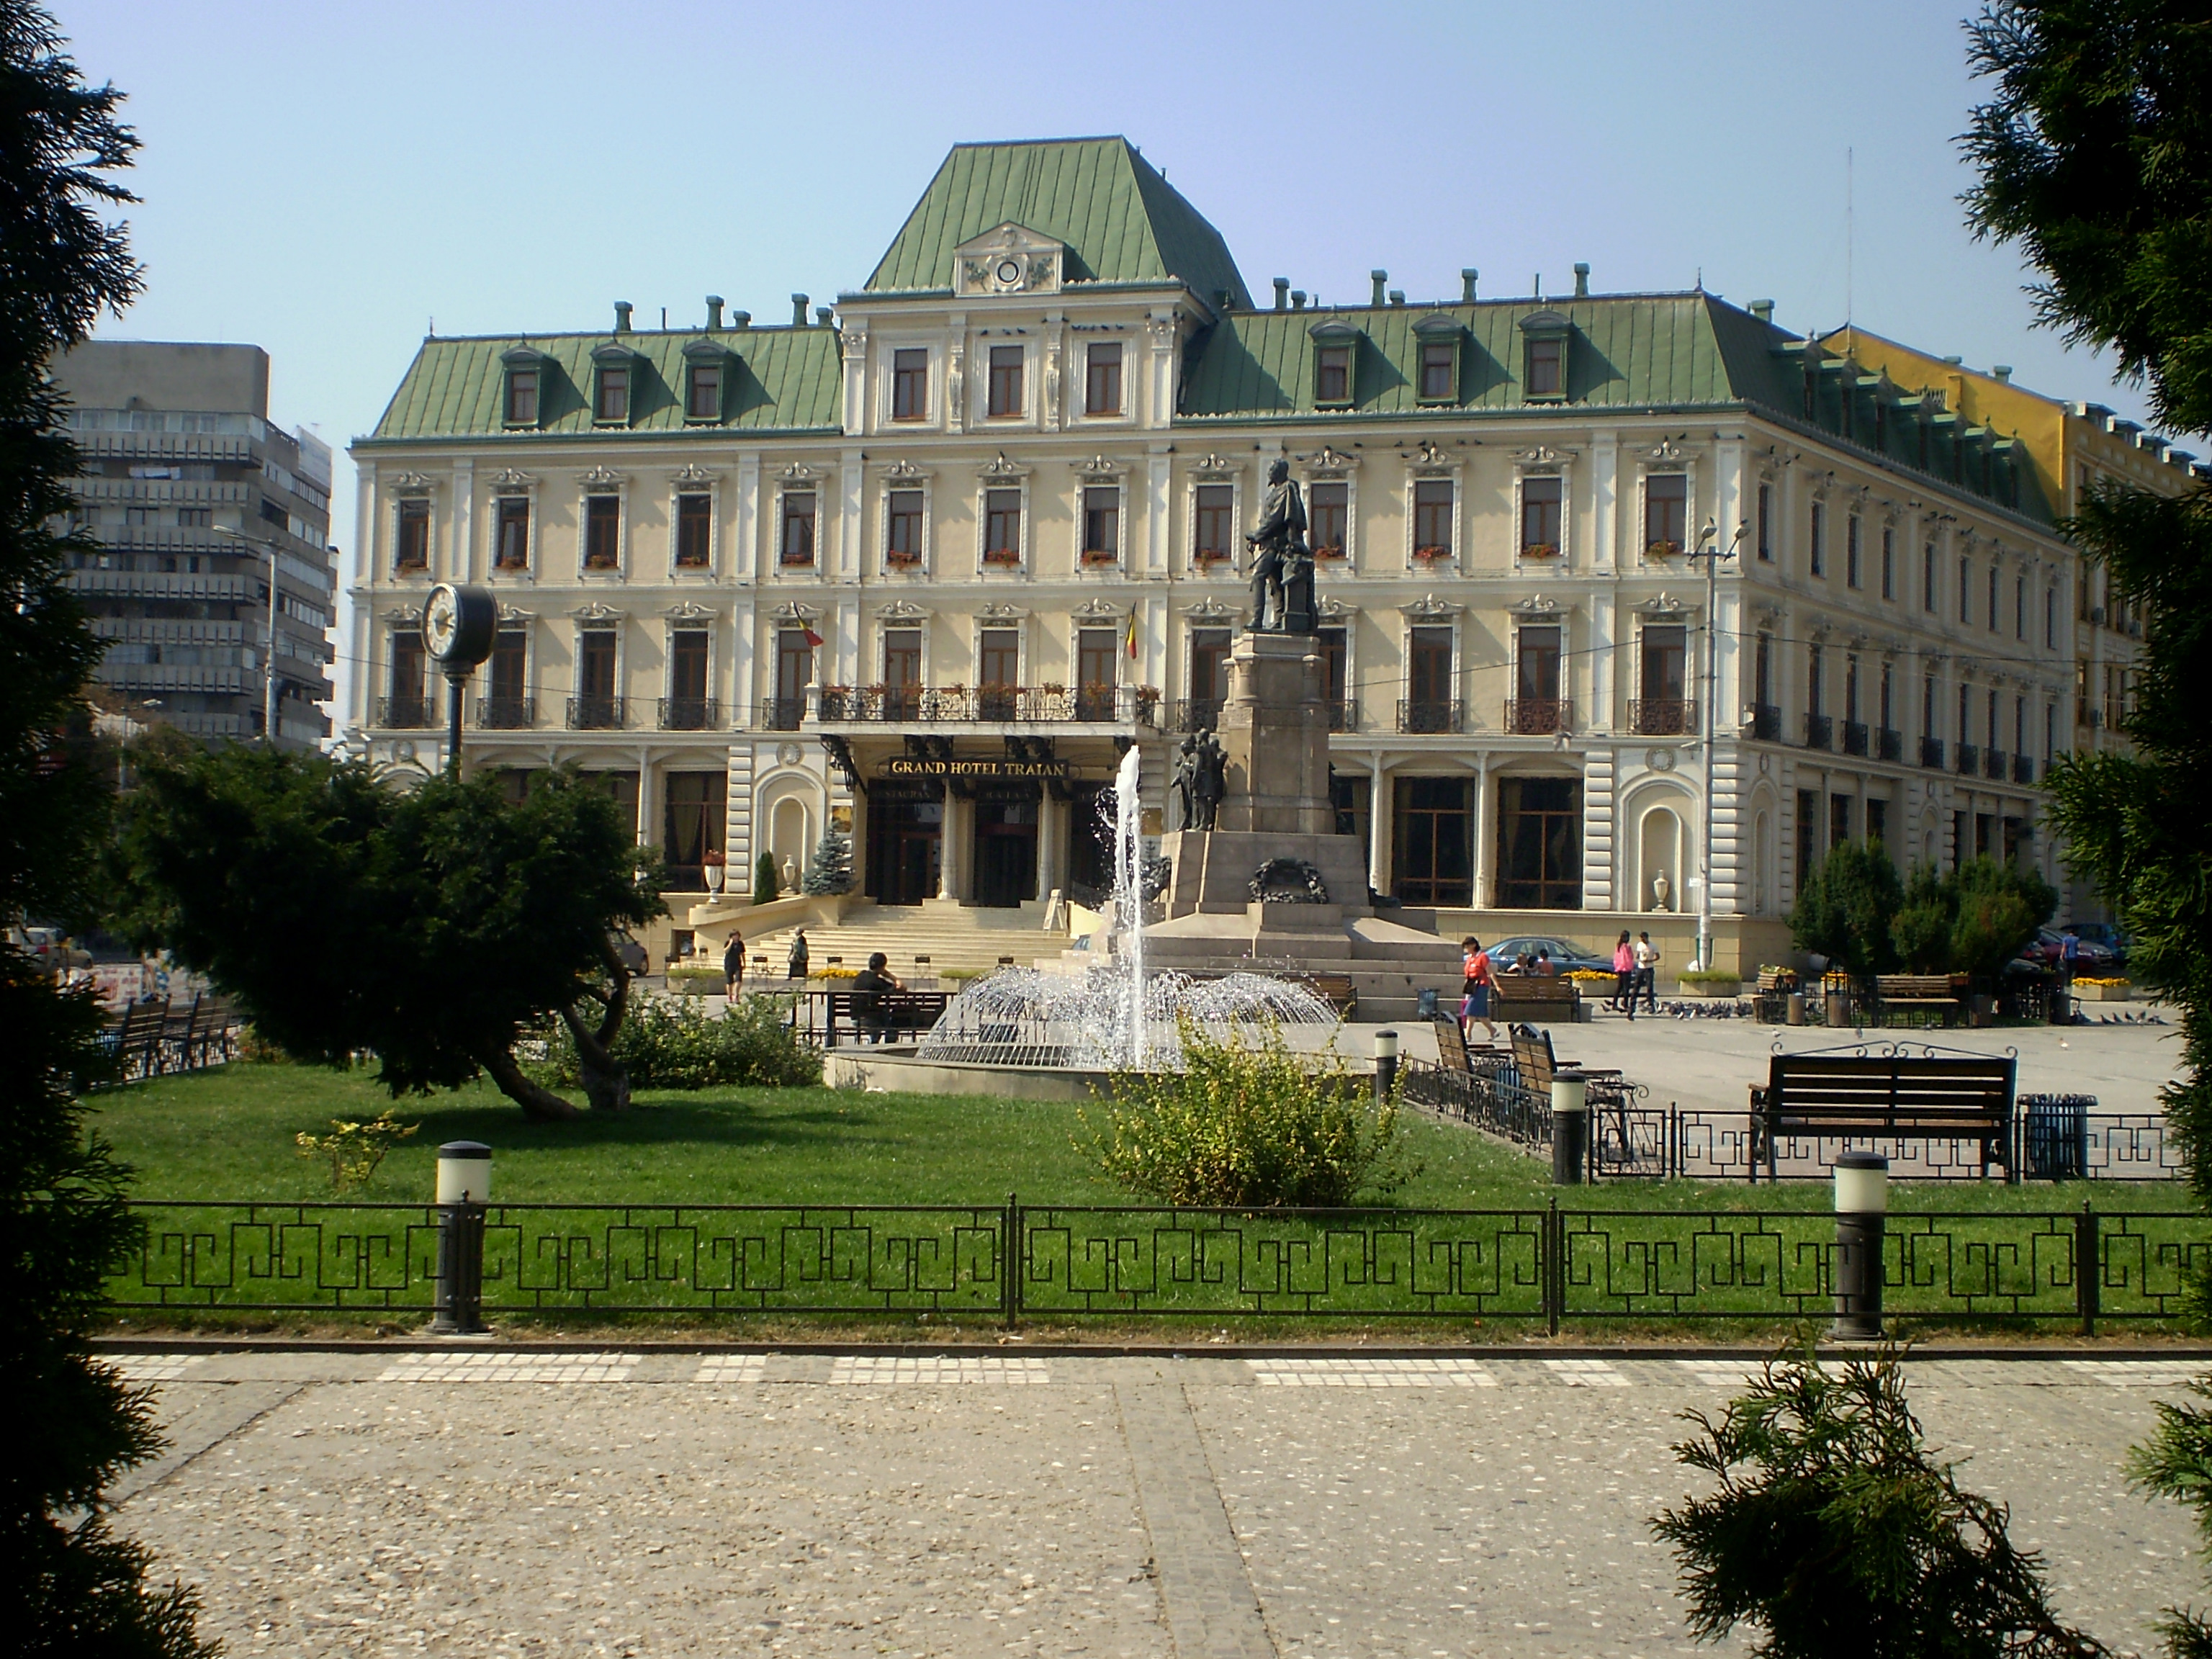
Iaşi
2 Timișoara Timiş 311,428 12 Bacău Bacău 177,087 3 Iaşi Iaşi 309,631 13 Piteşti Argeş 166,893 4 Cluj-Napoca Cluj 305,636 14 Arad Arad 166,003 5 Constanţa Constanţa 301,221 15 Sibiu Sibiu 154,548 6 Craiova Dolj 298,740 16 Târgu Mureş Mureş 145,151 7 Galaţi Galaţi 290,593 17 Baia Mare Maramureş 139,154 8 Braşov Braşov 276,914 18 Buzău Buzău 132,210 9 Ploieşti Prahova 227,194 19 Botoşani Botoşani 116,110 10 Brăila Brăila 210,245 20 Satu Mare Satu Mare 112,705 CIA World Factbook demographic statistics
The following demographic statistics are from the CIA World Factbook, unless otherwise indicated.
Age structure
- 0-14 years: 15.5% (male 1,772,583/female 1,681,539)
- 15–64 years: 69.7% (male 7,711,062/female 7,784,041)
- 65 years and over: 14.7% (male 1,332,120/female 1,934,076) (2010 est.)
As a consequence of the pro-natalist policies of the Nicolae Ceauşescu regime, Romania has a higher proportion of young adults in its population than any other Western country except Slovenia. 8.55% of the Romanian population was born in the period from 1976 to 1980, compared with 6.82% of Americans and 6.33% of Britons.[16]
Urban-rural ratio
- Urban — 55.20%
- Rural — 44.80%
Population growth rate
The population growth rate is -0.127% (2007 estimate).[18] In common with many Eastern European countries, Romania has experienced a decline in population in recent years. The population fell by 1,129,000 or 4.95% in the decade 1992–2002. In three counties, Caraş-Severin, Hunedoara and Teleorman, the population fell by more than 10% over the same period. Only two counties, Ilfov and Iaşi saw their population increase.[citation needed]
Net migration rate
- -0.13 migrant(s)/1,000 population (2006 est.)[18]
Sex ratio
- at birth:
- 1.06 male(s)/female
- under 15 years:
- 1.05 male(s)/female
- 15–64 years:
- 0.99 male(s)/female
- 65 years and over:
- 0.71 male(s)/female
- total population:
- 0.95 male(s)/female (2008 est.)
Infant mortality rate
17.3 deaths/1,000 live births (2002).[19]
Life expectancy at birth
- Total population: 72.18 years
- male: 68.69 years
- female: 75.89 years (2008 est.)
Total fertility rate
1.38 children born/woman (2008 est.)
Nationality
The noun form is Romanian(s), and the adjectival form is Romanian.
Religion
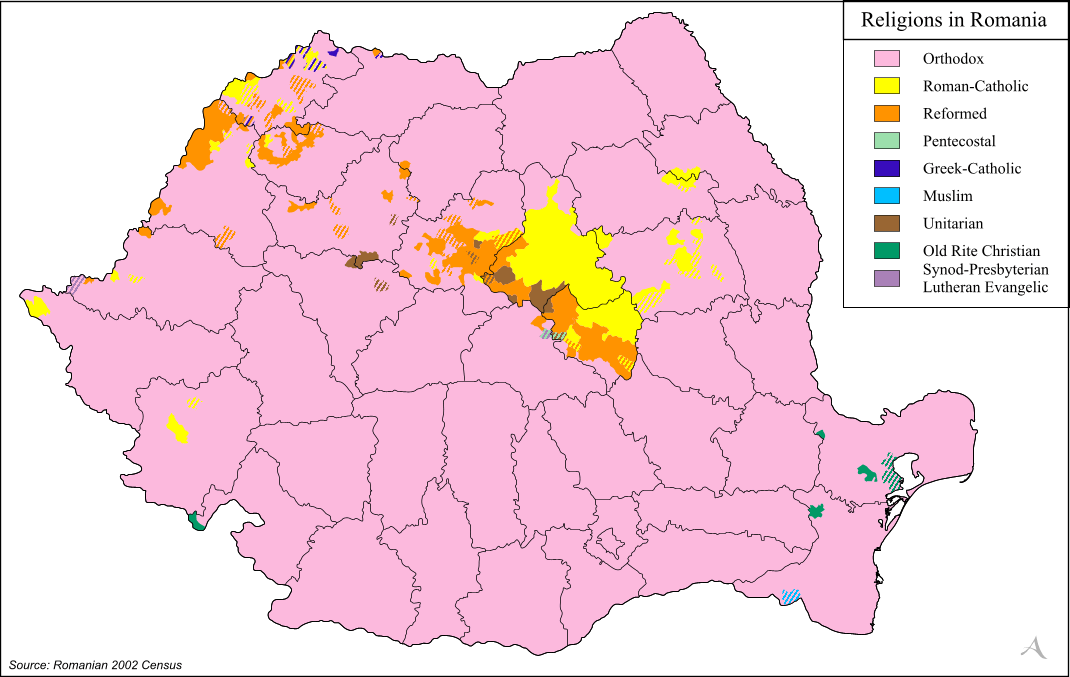
Main article: Religion in Romania Distribution of religions in Romania
- Romanian Orthodox — 86.7%
- Roman Catholic — 4.7%
- Protestant Churches (Calvin, Lutheran, Pentecostal, Baptist, Adventist) — 5.3%
- Greek Catholic - Uniate — 0.9%
- Islam — 0.3%
- Atheist — ~0.04% (9,271 people)
- No religion — 0.1%
- Other religions — 2.0%
- Refused to declare — 0.1%
Religious affiliation tends to follow ethnic lines, with most ethnic Romanians identifying with the Romanian Orthodox Church. The Greek Catholic or Uniate church, reunified with the Orthodox Church by fiat in 1948, was restored after the 1989 revolution. The 2002 census indicates that 0.9% of the population is Greek Catholic, as opposed to about 10% prior to 1948. Roman Catholics, largely ethnic Hungarians and Germans, constitute 4.7% of the population; Calvinists, Baptists (see Baptist Union of Romania and Convention of the Hungarian Baptist Churches of Romania), Pentecostals, and Lutherans make up another 5%. There are smaller numbers of Unitarians, Muslims, and other religions.
See also
Notes
- ^ http://eng.newwelfare.org/2006/02/18/the-pension-system-in-romania/
- ^ See, for example, Fabio Bordignon, "Italian Decentralisation in Romania", SEF 2003, Warsaw. Abstract available online.
- ^ http://www.presidency.ro/?lang=ro
- ^ http://www.dictsociologie.netfirms.com/_IndDem/populatieInd.htm
- ^ ICI.ro
- ^ http://recensamant.referinte.transindex.ro/?pg=8
- ^ Tacitus.nu
- ^ Tacitus.nu
- ^ Jewishvirtuallibrary.org
- ^ Comunitati evreiesti din România, B'nai B'rith International and Federaţia Comunitatii Evreiesti din România. Accessed online 4 December 2006
- ^ (in Romanian) Populaţia pe Neamuri. Institutul Central de Statistică. pp. XXIV. http://upload.wikimedia.org/wikipedia/ro/3/3d/Recensamant1930-II-XXIV.jpg. Retrieved 2008-07-20.
- ^ B.R. Mitchell. European historical statistics, 1750-1975.
- ^ http://unstats.un.org/unsd/demographic/products/dyb/dybsets/1948%20DYB.pdf United nations. Demographic Yearbook 1948
- ^ National Institute of Statistics of Romania
- ^ "Largest Romanian cities in 2010" (in Romanian). evz.ro. August 28, 2011. http://www.evz.ro/detalii/stiri/iasi-sau-timisoara-care-este-cel-de-al-doilea-mare-oras-din-romania-dupa-bucuresti-943339.html. Retrieved August 28, 2011.
- ^ NationMaster - Total population > Age 25-29 > % of the total (most recent) by country
- ^ National Institute of Statistics, INSSE.ro, July 1, 2007 (Romanian)
- ^ a b CIA.gov
- ^ UNDP.ro (Romanian)
External links
- United Nations Statistics - Romania
- Romanian National Statistic Institute (site is in Romanian, pdf files are in Romanian and English)
- Population density map
Demographics of Europe Sovereign
states- Albania
- Andorra
- Armenia
- Austria
- Azerbaijan
- Belarus
- Belgium
- Bosnia and Herzegovina
- Bulgaria
- Croatia
- Cyprus
- Czech Republic
- Denmark
- Estonia
- Finland
- France
- Georgia
- Germany
- Greece
- Hungary
- Iceland
- Ireland
- Italy
- Kazakhstan
- Latvia
- Liechtenstein
- Lithuania
- Luxembourg
- Macedonia
- Malta
- Moldova
- Monaco
- Montenegro
- Netherlands
- Norway
- Poland
- Portugal
- Romania
- Russia
- San Marino
- Serbia
- Slovakia
- Slovenia
- Spain
- Sweden
- Switzerland
- Turkey
- Ukraine
- United Kingdom
- (England
- Northern Ireland
- Scotland
- Wales)
- Vatican City
States with limited
recognition- Abkhazia
- Kosovo
- Nagorno-Karabakh
- Northern Cyprus
- South Ossetia
- Transnistria
Dependencies
and other territories- Åland
- Faroe Islands
- Gibraltar
- Guernsey
- Jan Mayen
- Jersey
- Isle of Man
- Svalbard
Other entities - European Union
Categories:


Wikimedia Foundation. 2010.