- Demographics of Montenegro
-
This article is about the demographic features of the population of Montenegro, including population density, ethnicity, education level, health of the populace, economic status, religious affiliations and other aspects of the population.
Contents
Total population
The 2003 census was undertaken by Montenegro, which, together with Serbia, constituted Serbia and Montenegro. The census population was 620,145 (including diaspora 672,656).
- According to a 2005 estimate made by the Statistical Office of Montenegro, Montenegro has about 623,000 inhabitants. [1]
- According to a 2006 estimate made by the Statistical Office of Montenegro, Montenegro has about 624,000 inhabitants. [2]
- According to a 2007 estimate made by the Statistical Office of Montenegro, Montenegro has about 625,000 inhabitants. [3]
- According to a 2008 estimate made by the Statistical Office of Montenegro, Montenegro has 627,478 inhabitants. [4]
The following demographic statistics are from the CIA World Factbook, unless otherwise indicated.
Age structure
- 0-14 years: 15.5% (male 50,060/female 52,823)
- 15-64 years: 71% (male 244,057/female 225,620)
- 65 years and over: 13.5% (male 35,551/female 53,696) (2011 est.)
Median age
- total: 37.8 years
- male: 36.5 years
- female: 39.2 years (2011 est.)
Sex ratio
- at birth: 1.072 male(s)/female
- under 15 years: 0.95 male(s)/female
- 15-64 years: 1.08 male(s)/female
- 65 years and over: 0.67 male(s)/female
- total population: 0.99 male(s)/female (2011 est.)
Vital statistics [1] [2]
Average population (x 1000) Live births Deaths Natural change Crude birth rate (per 1000) Crude death rate (per 1000) Natural change (per 1000) 1947 372 10 800 4 300 6 500 29.0 11.6 17.5 1948 380 11 600 4 600 7 000 30.5 12.1 18.4 1949 389 12 600 4 700 7 900 32.4 12.1 20.3 1950 397 11 904 3 682 8 222 30.0 9.3 20.7 1951 407 12 898 4 416 8 482 31.7 10.9 20.8 1952 415 13 308 3 859 9 449 32.1 9.3 22.8 1953 422 13 880 4 775 9 105 32.9 11.3 21.6 1954 428 14 428 3 862 10 566 33.7 9.0 24.7 1955 435 13 550 3 935 9 615 31.1 9.0 22.1 1956 441 13 654 3 871 9 783 31.0 8.8 22.2 1957 447 13 751 4 172 9 579 30.8 9.3 21.4 1958 453 13 684 3 537 10 147 30.2 7.8 22.4 1959 460 12 614 3 469 9 145 27.4 7.5 19.9 1960 467 13 127 3 583 9 544 28.1 7.7 20.4 1961 474 12 994 3 335 9 659 27.4 7.0 20.4 1962 481 13 006 3 747 9 259 27.0 7.8 19.2 1963 487 12 982 3 454 9 528 26.7 7.1 19.6 1964 493 12 599 3 550 9 049 25.6 7.2 18.4 1965 499 12 333 3 431 8 902 24.7 6.9 17.8 1966 505 12 209 3 199 9 010 24.2 6.3 17.8 1967 510 11 486 3 385 8 101 22.5 6.6 15.9 1968 515 11 027 3 429 7 598 21.4 6.7 14.8 1969 520 11 259 3 325 7 934 21.7 6.4 15.3 1970 525 10 636 3 516 7 120 20.3 6.7 13.6 1971 531 10 866 3 264 7 602 20.5 6.1 14.3 1972 539 10 938 3 512 7 426 20.3 6.5 13.8 1973 546 10 665 3 304 7 361 19.5 6.1 13.5 1974 554 10 551 3 199 7 352 19.0 5.8 13.3 1975 561 10 557 3 279 7 278 18.8 5.8 13.0 1976 568 10 711 3 465 7 246 18.9 6.1 12.8 1977 575 10 738 3 559 7 179 18.7 6.2 12.5 1978 582 10 584 3 660 6 924 18.2 6.3 11.9 1979 585 10 365 3 826 6 539 17.7 6.5 11.2 1980 583 10 542 3 703 6 839 18.1 6.4 11.7 1981 586 10 335 3 680 6 655 17.6 6.3 11.4 1982 593 10 579 3 618 6 961 17.8 6.1 11.7 1983 599 10 657 4 194 6 463 17.8 7.0 10.8 1984 606 10 521 3 915 6 606 17.4 6.5 10.9 1985 613 10 724 3 926 6 798 17.5 6.4 11.1 1986 619 10 455 3 922 6 533 16.9 6.3 10.6 1987 626 10 567 3 990 6 577 16.9 6.4 10.5 1988 632 10 190 3 661 6 529 16.1 5.8 10.3 1989 638 9 634 3 833 5 801 15.1 6.0 9.1 1990 644 9 257 3 519 5 738 14.4 5.5 8.9 1991 592 9 606 3 970 5 636 16.2 6.7 9.5 1992 594 9 524 4 393 5 131 16.0 7.4 8.6 1993 596 8 922 4 471 4 451 15.0 7.5 7.5 1994 599 8 887 4 660 4 227 14.8 7.8 7.1 1995 601 9 492 4 931 4 561 15.8 8.2 7.6 1996 603 9 094 4 982 4 112 15.1 8.3 6.8 1997 606 8 758 5 153 3 605 14.5 8.5 5.9 1998 608 9 211 5 312 3 899 15.1 8.7 6.4 1999 610 8 828 5 393 3 435 14.5 8.8 5.6 2000 613 9 184 5 412 3 772 15.0 8.8 6.2 2001 615 8 839 5 431 3 408 14.4 8.8 5.5 2002 617 8 499 5 513 2 986 13.8 8.9 4.8 2003 618 8 344 5 704 2 640 13.5 9.2 4.3 2004 621 7 849 5 707 2 142 12.6 9.2 3.5 2005 624 7 352 5 839 1 513 11.8 9.4 2.4 2006 624 7 531 5 968 1 563 12.1 9.6 2.5 2007 626 7 834 5 979 1 855 12.5 9.5 3.0 2008 629 8 258 5 708 2 550 13.1 9.1 4.1 2009 631 8 642 5 862 2 780 13.7 9.3 4.4 2010 633 7 415 5 628 1 787 11.7 8.9 2.8 Nationality/Ethnicity
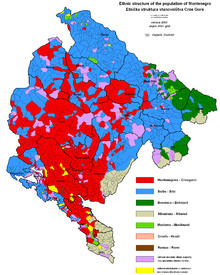
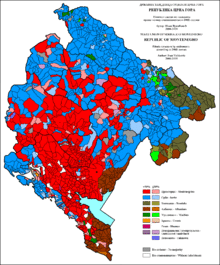
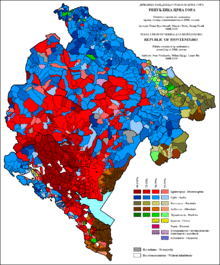
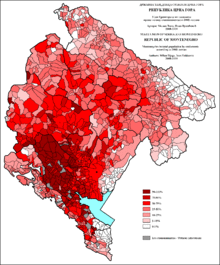
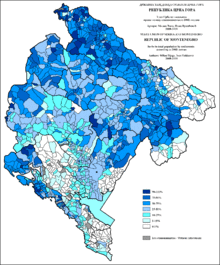
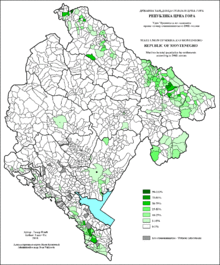
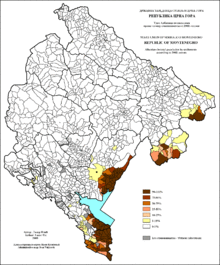
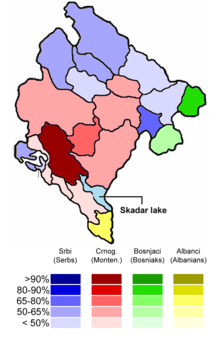
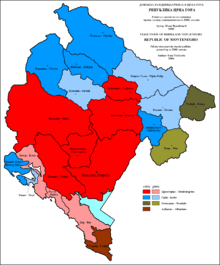
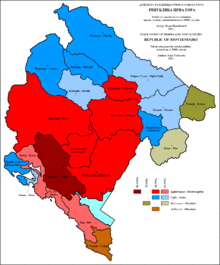
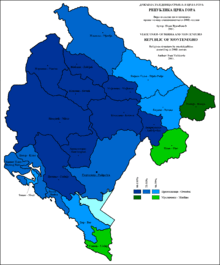
Population of Montenegro according to ethnic group 1948-20031
Ethnic
groupcensus 1948 census 1953 census 1961 census 1971 census 1981 census 1991 census 2003 Number % Number % Number % Number % Number % Number % Number % Montenegrins 342,009 90.7 363,686 86.6 383,988 81.4 355,632 67.2 400,488 68.5 380,647 61.9 267,669 43.2 Serbs 6,707 1.8 13,864 3.3 14,087 3.0 39,512 7.5 19,407 3.3 57,453 9.3 198,414 32.0 Croats 6,808 1.8 9,814 2.3 10,664 2.3 9,192 1.7 6,904 1.2 6,244 1.0 6,811 1.1 Yugoslavs 1,559 0.3 10,943 2.1 31,243 5.3 26,159 4.3 1,860 0.3 Muslims 387 0.1 6,424 1.5 30,665 6.5 70,236 13.3 78,080 13.4 89,614 14.6 24,625 4.0 Bosniaks 48,184 7.8 Albanians 19,425 5.1 23,460 5.6 25,803 5.5 35,671 6.7 37,735 6.5 40,415 6.6 31,163 5.0 Romani 162 0.0 230 0.1 183 0.0 396 0.1 1,471 0.3 3,282 0.5 2,601 0.4 Macedonians 133 0.0 362 0.1 593 0.1 723 0.1 875 0.1 1,072 0.2 819 0.1 Others/undeclared 1,558 0.4 2,033 0.5 4,352 0.9 7,299 1.4 8,107 1.4 10,149 1.7 37,9992 6.1 Total 377,189 419,873 471,894 529,604 584,310 615,035 620,1453 1 Source: [5] Statistical Office of Montenegro 2 including 415 Slovenes (0.07%), 362 Hungarians (0.06%), 240 Russians (0.03%), 225 Egyptians (0.04%), 127 Italians (0.02%), 118 Germans (0.02%), 2,180 others (0.31%), no response 26,906 (4.34%), Regional affiliation 1,258 (0.2%), Unknown 6,168 (0.99%)
3 The total population including diaspora was 672,656 (Montenegrins 273,366 or 40.64%, Serbs: 201,892 or 30.01%, Bosniaks: 63,272 or 9.41%, Albanians: 47,682 or 7.09%, Muslims: 28,714 or 4.27%, Croats: 7,062 or 1.05%)
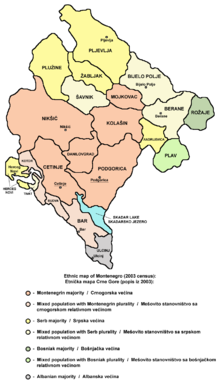
Ethnic structure
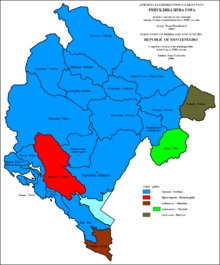
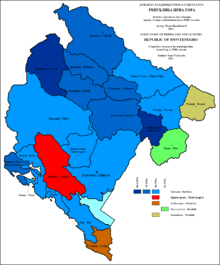
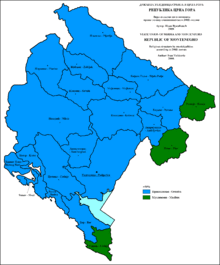
According to the 2003 census (November 2003 data)
Andrijevica total 6.384
- Montenegrins 1.475 or 23,10%
- Muslims 8 or 0,13%
- Serbs 4.155 or 65,08%
- Albanians 0 or 0,00%
- Croats 2 or 0,03%
- Bosniaks 0 or 0,00%
- Roma 0 or 0,00%
- other 22 or 0,34%
not declared 234 or 3,67% no data 488 or 7,64%
Bar total 45.223
- Montenegrins 19.960 or 44,14%
- Muslims 2.852 or 6,31%
- Serbs 11.218 or 24,81%
- Albanians 5.450 or 12,05%
- Croats 268 or 0,59%
- Bosniaks 1.026 or 2,27%
- Roma 50 or 0,11%
- other 722 or 1,60%
- not declared 1.771 or 3,92%
- no data 1.906 or 4,21%
Berane total 40.885
- Montenegrins 9282 or 22,70%
- Muslims 2.994 or 7,32%
- Serbs 16.939 or 41,43%
- Albanians 41 or 0,10%
- Croats 50 or 0,12%
- Bosniaks 8.994 or 22,00%
- Roma 133 or 0,33%
- other 222 or 0,54%
- not declared 223 or 0,55%
- no data 837 or 2,05%
Bijelo Polje total 57.124
- Montenegrins 9.214 or 16,13%
- Muslims 9.816 or 17,18%
- Serbs 20.743 or 36,31%
- Albanians 35 or 0,06%
- Croats 49 or 0,09%
- Bosniaks 14.409 or 25,22%
- Roma 146 or 0,26%
other 165 or 0,29% not declared 1.033 or 1,81% no data 1.514 or 2,65%
Budva total 16.095
- Montenegrins 7.333 or 45,56%
- Muslims 205 or 1,27%
- Serbs 6.510 or 40,45%
- Albanians 60 or 0,37%
- Croats 177 or 1,10%
- Bosniaks 22 or 0,14%
- Roma 37 or 0,23%
- other 460 or 2,86%
- not declared 1.153 or 7,16%
- no data 138 or 0,86%
Cetinje total 18.749
- Montenegrins 16.927 or 90,28%
- Muslims 21 or 0,11%
- Serbs 865 or 4,61%
- Albanians 46 or 0,25%
- Croats 47 or 0,25%
- Bosniaks 5 or 0,03%
- Roma 131 or 0,70%
- other 170 or 0,91%
- not declared 303 or 1,62%
- no data 234 or 1,25%
Danilovgrad total 16.400
- Montenegrins 11.141 or 67,93%
- Muslims 53 or 0,32%
- Serbs 4.177 or 25,47%
- Albanians 8 or 0,05%
- Croats 42 or 0,26%
- Bosniaks 0 or 0,00%
- Roma 11 or 0,07%
- other 127 or 0,77%
- not declared 428 or 2,61%
- no data 413 or 2,52%
Herceg Novi total 33971
- Montenegrins 9.651 or 28,41%
- Muslims 218 or 0,64%
- Serbs 17.818 or 52,45%
- Albanians 25 or 0,07%
- Croats 831 or 2,45%
- Bosniaks 89 or 0,26%
- Roma 290 or 0,85%
- other 1.350 or 3,97%
- not declared 2.800 or 8,24%
- no data 899 or 2,65%
Kolasin total 9.975
- Montenegrins 5.022 or 50,35%
- Muslims 34 or 0,34%
- Serbs 4.449 or 44,60%
- Albanians 1 or 0,01%
- Croats 11 or 0,11%
- Bosniaks 1 or 0,01%
- Roma 0 or 0,00%
- other 74 or 0,74%
- not declared 337 or 3,38%
- no data 46 or 0,46%
Kotor total 23.481
- Montenegrins 11.002 or 46,85%
- Muslims 109 or 0,46%
- Serbs 7.197 or 30,65%
- Albanians 63 or 0,27%
- Croats 1.842 or 7,84%
- Bosniaks 17 or 0,07%
- Roma 36 or 0,15%
- other 746 or 3,18%
- not declared 2.255 or 9,60%
- no data 214
Mojkovac total 10.274
- Montenegrins 5.627 or 54,77%
- Muslims 18 or 0,18%
- Serbs 4.200 or 40,88%
- Albanians 1 or 0,01%
- Croats 3 or 0,03%
- Bosniaks9 or 0,09%
- Roma 0 or 0,00%
- other 53 or 0,52%
- not declared 332 or 3,23%
- no data 31 or 0,30%
Niksic total 76.671
- Montenegrins 47.923 or 62,50%
- Muslims 733 or 0,96%
- Serbs 20.433 or 26,65%
- Albanians 32 or 0,04%
- Croats 139 or 0,18%
- Bosniaks 177 or 0,23%
- Roma 346 or 0,45%
- other 743 or 0,97%
- not declared 5.483 or 7,15%
- no data 662 or 0,86%
Plav total 21.604
- Montenegrins 790 or 3,66%
- Muslims 1.249 or 5,78%
- Serbs 2.731 or 12,64%
- Albanians 5.673 or 26,26%
- Croats 4 or 0,02%
- Bosniaks 10.960 or 50,73%
- Roma 0 or 0,00%
- other 78 or 0,36%
- not declared 73 or 0,34%
- no data 46 or 0,21%
Pljevlja total 36.918
- Montenegrins 7.750 or 20,99%
- Muslims 3.088 or 8,36%
- Serbs 21.972 or 59,52%
- Albanians 11 or 0,03%
- Croats 17 or 0,05%
- Bosniaks 2.023 or 5,48%
- Roma 0 or 0,00%
- other 148 or 0,40%
- not declared 1.705 or 4,62%
- no data 204 or 0,55%
Pluzine total 4.294
- Montenegrins 1.400 or 32,60%
- Muslims 1 or 0,02%
- Serbs 2.601 or 60,57%
- Albanians 0 or 0,00%
- Croats 1 or 0,02%
- Bosniaks 0 or 0,00%
- Roma 0 or 0,00%
- other 12 or 0,28%
- not declared 260 or 6,05%
- no data 19 or 0,44%
Podgorica total 179.403
- Montenegrins 98.562 or 54,94%
- Muslims 4.782 or 2,67%
- Serbs 44.992 or 25,08%
- Albanians 14.238 or 7,94%
- Croats 734 or 0,41%
- Bosniaks 2.672 or 1,49%
- Roma 1.542 or 0,86%
- other 2.184 or 1,22%
- not declared 7.506 or 4,18%
- no data 2.191 or 1,22%
Rozaje total 27.562
- Montenegrins 453 or 1,64%
- Muslims 1.670 or 6,06%
- Serbs 916 or 3,32%
- Albanians 1.190 or 4,32%
- Croats 8 or 0,03%
- Bosniaks 22.512 or 81,68%
- Roma 15 or 0,05%
- other 405 or 1,47%
- not declared 73 or 0,26%
- no data 320 or 1,16%
Savnik total 2.972
- Montenegrins 1.386 or 46,64%
- Muslims 5 or 0,17%
- Serbs 1.416 or 47,64%
- Albanians 0 or 0,00%
- Croats 3 or 0,10%
- Bosniaks 0 or 0,00%
- Roma 0 or 0,00%
- other 25 or 0,84%
- not declared 130 or 4,37%
- no data 7 or 0,24%
Tivat total 13.991
- Montenegrins 4.126 or 29,49%
- Muslims 165 or 1,18%
- Serbs 4.911 or 35,10%
- Albanians 144 or 1,03%
- Croats 2.761 or 19,73%
- Bosniaks 56 or 0,40%
- Roma 20 or 0,14%
- other 470 or 3,36%
- not declared 1.122 or 8,02%
- no data 216 or 1,54%
Ulcinj total 26.435
- Montenegrins 2.523 or 9,54%
- Muslims 692 or 2,62%
- Serbs 1.520 or 5,75%
- Albanians 20.664 or 78,17%
- Croats 70 or 0,26%
- Bosniaks 300 or 1,13%
- Roma 118 or 0,45%
- Black Montenegrins 185 or 0,70%
- other 185 or 0,70%
- not declared 216 or 0,82%
- no data 147 or 0,56%
Zabljak total 4.245
- Montenegrins 1.819 or 42,85%
- Muslims 1 or 0,02%
- Serbs 2.129 or 50,15%
- Albanians 0 or 0,00%
- Croats 3 or 0,07%
- Bosniaks 0 or 0,00%
- Roma 0 or 0,00%
- other 15 or 0,35%
- not declared 278 or 6,55%
This census witnessed the forming of the Bosniak nation; although there are still people who declare themselves as Muslims by nationality. Also, there are very few people left who consider themselves Yugoslavs. Also a noticeable difference compared to 1991 census is the reemerging in the number of Serbs, from nearly 60,000 to 200,000 in a decade (compared to 1931s 90% strong Serb community).
Others include small ethnic groups of perceived non-European/Slavic origins: Roma, Balkan Egyptians and Black Montenegrins whom are thought to be local Turks.
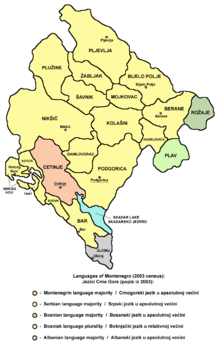
Linguistic structure
- Serbian: 393,740 (63.49%)
- Serbs - 197,684 (50.21%)
- Montenegrins - 156,374 (39.71%)
- Slavic Muslims - 8,696 (2.21%)
- Bosniacs - 2,723 (0.69%)
- Croats - 2,529 (0.64%)
- Yugoslavs - 1,705 (0.43%)
- Albanians - 306 (0.08%)
- Romany - 157 (0.04%)
- others - 1,847 (0.47%)
- undeclared and undefined - 18,610 (4.73%)
- regional affiliation - 891 (0.23%)
- unknown - 2,218 (0.56%)
- Montenegrin: 136,208 (21.96%)
- Montenegrins - 106,214 (78%)
- Slavic Muslims - 13,627 (10%)
- Bosniacs - 12,549 (9.21%)
- Croats - 1,375 (1.01%)
- Serbs - 349 (0.26%)
- Albanians - 330 (0.24%)
- Yugoslavs - 33 (0.02%)
- Romany - 8 (0.01%)
- others - 349 (0.26%)
- undeclared and undefined - 1,106 (0.81%)
- regionally declared - 80 (0.06%)
- unknown - 188 (0.14%)
- Albanian: 32,603 (5.26%)
- Albanians - 30,382 (93.19%)
- Montenegrins - 776 (2.38%)
- Slavic Muslims - 414 (1.27%)
- Romany - 288 (0.88%)
- Bosniacs - 15 (0.05%)
- Serbs - 8 (0.02%)
- Yugoslavs - 8 (0.02%)
- Croats - 3 (0.01%)
- others - 361 (1.11%)
- undeclared and undefined - 168 (0.51%)
- regionally declared - 74 (0.23%)
- unknown - 106 (0.32%)
- Bosniac language: 19,906 (3.2%)
- Bosniacs - 18,662 (93.75%)
- Muslims by nationality - 1,094 (5.5%)
- Albanians - 72 (0.36%)
- Montenegrins - 37 (0.19%)
- Croats - 2 (0.01%)
- Yugoslavs - 2 (0.01%)
- others - 15 (0.07%)
- undeclared and undefined - 11 (0.05%)
- regionally declared - 6 (0.03%)
- unknown - 5 (0.02%)
- Bosnian: 14,172 (2.29%)
- Bosniacs - 13,718 (96.8%)
- Slavic Muslims - 282 (1.99%)
- Albanians - 38 (0.27%)
- Montenegrins - 24 (0.17%)
- Serbs - 6 (0.04%)
- Croats - 6 (0.04%)
- Yugoslavs - 1 (0.01%)
- others - 15 (0.11%)
- undeclared and undefined - 20 (0.14%)
- regionally declared - 60 (0.42%)
- unknown - 2 (0.01%)
- Croatian: 2,791 (0.45%)
- Croats - 2,438 (87.35%)
- Serbs - 92 (3.3%)
- Montenegrins - 82 (2.94%)
- Yugoslavs - 15 (0.54%)
- Slavic Muslims - 11 (0.39%)
- Bosniacs - 5 (0.18%)
- Albanians - 4 (0.14%)
- others - 36 (1.29%)
- undeclared and undefined - 84 (3.01%)
- regionally declared - 14 (0.5%)
- unknown - 10 (0.36%)
- Roma: 2,602 (0.42%)
- Macedonian: 507 (0.08%)
- Hungarian: 255 (0.04%)
- Slovene: 232 (0.04%)
- German: 126 (0.02%)
- other: 3,101 (0.5%)
- nondeclared and unknown: 13,902 (2.2%)
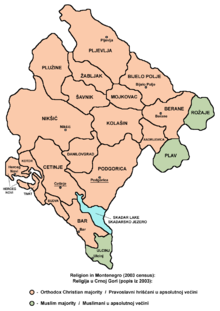
Religious structure
- See also: Serbian Orthodox Church, Montenegrin Orthodox Church, Roman Catholic Archdiocese of Bar, Islam in Montenegro
- Orthodox Christianity - 460,383 (74.24%)
- Montenegrins - 241,728 (52.51%)
- Serbs - 196,333 (42.65%)
- Yugoslavs - 1,286 (0.28%)
- Romany - 250 (0.05%)
- Croats - 107 (0.02%)
- Slavic Muslims - 71 (0.01%)
- Bosniacs - 32 (0.01%)
- Albanians - 27 (0.01%)
- others - 2,191 (0.48%)
- undeclared and undefined - 15,853 (3.44%)
- regionally declared - 651 (0.14%)
- unknown - 1,854 (0.4%)
- Muslim - 110,034 (17.74%)
- Bosniacs - 47,852 (43.49%)
- Slavic Muslims - 24,111 (21.91%)
- Albanians - 22,834 (20.75%)
- Montenegrins - 11,710 (10.64%)
- Romany - 1,942 (1.77%)
- Yugoslavs - 38 (0.03%)
- Serbs - 33 (0.03%)
- Croats - 6 (0.01%)
- others - 486 (0.44%)
- undeclared and undefined - 766 (0.7%)
- regionally declared - 75 (0.07%)
- unknown - 181 (0.16%)
- Roman Catholic - 21,972 (3.54%)
- Albanians - 8,126 (36.98%)
- Croats - 6,262 (28.5%)
- Montenegrins - 5,000 (22.76%)
- Yugoslavs - 128 (0.58%)
- Serbs - 114 (0.52%)
- Romany - 11 (0.05%)
- Bosniacs - 4 (0.02%)
- Slavic Muslims - 4 (0.02%)
- others - 1,112 (5.06%)
- undeclared and undefined - 689 (3.14%)
- regionally declared - 370 (1.68%)
- unknown - 152 (0.69%)
- Protestant - 383 (0.06%)
- Montenegrins - 144 (37.6%)
- Serbs - 51 (13.32%)
- Romany - 18 (4.7%)
- Bosniacs - 7 (1.83%)
- Croats - 7 (1.83%)
- Yugoslavs - 4 (1.04%)
- Albanians - 2 (0.52%)
- Slavic Muslims - 1 (0.26%)
- others - 103 (26.89%)
- undeclared and undefined - 31 (8.09%)
- regionally declared - 7 (1.83%)
- unknown - 8 (2.09%)
- occult - 58 (0.01%)
- Montenegrins - 27 (46.55%)
- Serbs - 2 (3.45%)
- Bosniacs - 1 (1.72%)
- Slavic Muslims - 1 (1.72%)
- Croats - 1 (1.72%)
- others - 3 (5.17%)
- undeclared and undefined - 2 (3.45%)
- unknown - 1 (1.72%)
- Jewish - 12
- Montenegrins - 2 (16.67%)
- Serbs - 2 (16.67%)
- others - 8 (66.66%)
- agnostics - 2,424 (0.39%)
- nondeclared - 13,867 (2.24%)
- none - 6,003 (0.97%)
- unknown - 5,009 (0.8%)
Refugees from Kosovo
- Montenegrins - 5,817
- Serbs - 4,495
- Roma - 3,105
- Muslims - 1,823
- Egyptians - 1,539
- Albanians - 457
- Bosniaks - 333
- Gorani 83
- Ashkali - 79
- Yugoslavs - 72
- Croats - 27
- Macedonians - 23
- Slovenes 9
- other - 53
- nondeclared - 32
- Total - 17,947
See also
References
Demographics of Europe Sovereign
states- Albania
- Andorra
- Armenia
- Austria
- Azerbaijan
- Belarus
- Belgium
- Bosnia and Herzegovina
- Bulgaria
- Croatia
- Cyprus
- Czech Republic
- Denmark
- Estonia
- Finland
- France
- Georgia
- Germany
- Greece
- Hungary
- Iceland
- Ireland
- Italy
- Kazakhstan
- Latvia
- Liechtenstein
- Lithuania
- Luxembourg
- Macedonia
- Malta
- Moldova
- Monaco
- Montenegro
- Netherlands
- Norway
- Poland
- Portugal
- Romania
- Russia
- San Marino
- Serbia
- Slovakia
- Slovenia
- Spain
- Sweden
- Switzerland
- Turkey
- Ukraine
- United Kingdom
- (England
- Northern Ireland
- Scotland
- Wales)
- Vatican City
States with limited
recognition- Abkhazia
- Kosovo
- Nagorno-Karabakh
- Northern Cyprus
- South Ossetia
- Transnistria
Dependencies
and other territories- Åland
- Faroe Islands
- Gibraltar
- Guernsey
- Jan Mayen
- Jersey
- Isle of Man
- Svalbard
Other entities - European Union
Ethnic groups of Montenegro Montenegrins · Serbs · Albanians · Bosniaks(+Muslims by nationality) · Croats · Macedonians · Roma (+Ashkali) · Turks · YugoslavsSee also: Demographics · Demographic history Categories:
Wikimedia Foundation. 2010.

