- Demographics of Georgia (country)
-
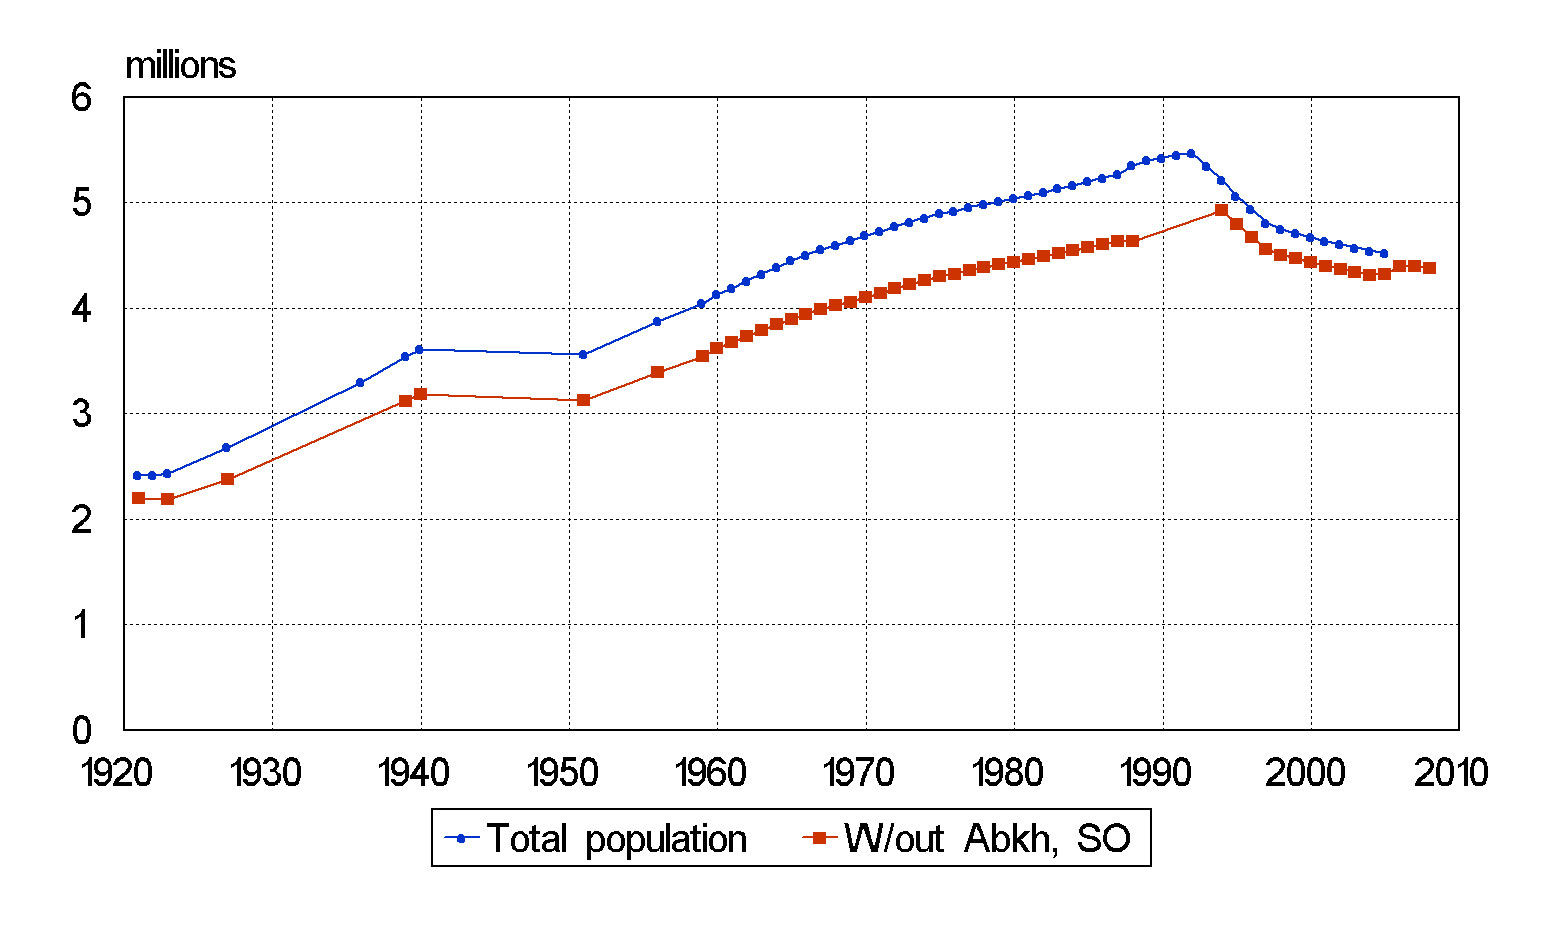
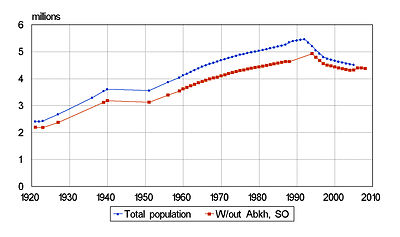 Georgia: Total population with (top blue curve) and without (bottom red curve) Abkhazia and South Osetia, in millions. Data from statistical yearbooks of Georgian SSR (before 1990) and Georgia (after 1990), various years.
The Demographics of Georgia is about the demographic features of the population of Georgia, including population growth, population density, ethnicity, education level, health, economic status, religious affiliations, and other aspects of the population.
Contents
Demographic trends
The demographic situation in Georgia, like that of some other former Soviet republics (especially Estonia and Latvia), has been characterized by two prominent features since independence: decline in total population and significant "Georgianization" of the ethnic composition. The proportion of ethnic Georgians increased by full 10 percentage points between 1989 and 2002, rising from 73.7% to 83.7% of the population.[1]
The population grew steadily while Georgia was part of the Soviet Union and during the first years of independence, rising from less than 4 million in the 1950s to a peak of 5.5 million in 1992.[2] Then the trend changed and the population began to decline, dropping to 4.5 million in 2005 according to the estimates by the Georgian Department of Statistics.[3] This figure represents the total population, including the separatist regions of Abkhazia and South Ossetia, whose population in 2005 was estimated at 178,000 and 49,200, respectively. Without Abkhazia and South Osetia, the population in the regions controlled by the central government of Georgia was 4,321,500 in 2005 and 4,382,100 in 2008[4] (compare the 2008 figure with the CIA estimate of 4,630,841 for all of Georgia, including Abkhazia and South Osetia[5]).
As a portion of the population, Georgia was named as largest emigration countries in the world in the 2007 World Bank report. The 2002 population census in Georgia revealed a net migration loss of 1.1 million persons, or 20% of the population, since the early 90s.[6] The decline in Georgia's population is mainly due to the emigration of ethnic minorities. Over 300,000 Russians, 200,000 Georgians, 200,000 Armenians, 85,000 Greeks, 50,000 Azerbaijanis, 50,000 Ukrainians and 20,000 Jews have migrated from Georgia since independence.[7]
Vital statistics[8][9]
Births and deaths
Total area
Average population (x 1000) Live births1 Deaths1 Natural change1 Crude birth rate (per 1000) Crude death rate (per 1000) Natural change (per 1000) 1950 3 527 82 900 27 000 55 900 23.5 7.7 15.9 1951 3 585 86 800 26 900 59 900 24.2 7.5 16.7 1952 3 646 85 700 26 600 59 100 23.5 7.3 16.2 1953 3 710 87 200 26 300 60 900 23.5 7.1 16.4 1954 3 775 91 400 26 000 65 400 24.2 6.9 17.3 1955 3 840 92 500 25 700 66 800 24.1 6.7 17.4 1956 3 904 89 800 26 500 63 300 23.0 6.8 16.2 1957 3 967 89 700 27 000 62 700 22.6 6.8 15.8 1958 4 031 93 100 27 400 65 700 23.1 6.8 16.3 1959 4 095 98 300 27 400 70 900 24.0 6.7 17.3 1960 4 160 102 866 27 015 51 866 24.7 6.5 18.2 1961 4 224 104 429 27 621 53 429 24.7 6.5 18.2 1962 4 291 101 717 30 394 51 717 23.7 7.1 16.6 1963 4 357 100 326 29 620 51 326 23.0 6.8 16.2 1964 4 420 97 433 29 708 48 433 22.0 6.7 15.3 1965 4 478 94 987 31 291 46 987 21.2 7.0 14.2 1966 4 531 92 026 30 389 44 026 20.3 6.7 13.6 1967 4 577 89 302 32 904 42 302 19.5 7.2 12.3 1968 4 619 89 660 32 416 43 660 19.4 7.0 12.4 1969 4 662 87 069 35 169 41 069 18.7 7.5 11.2 1970 4 706 90 207 34 283 45 207 19.2 7.3 11.9 1971 4 753 90 396 35 325 45 396 19.0 7.4 11.6 1972 4 798 86 402 36 409 41 402 18.0 7.6 10.4 1973 4 837 88 577 35 911 44 577 18.3 7.4 10.9 1974 4 876 89 761 37 145 45 761 18.4 7.6 10.8 1975 4 908 89 712 39 292 45 712 18.3 8.0 10.3 1976 4 940 90 605 38 875 46 605 18.3 7.9 10.4 1977 4 972 89 028 40 139 45 028 17.9 8.1 9.8 1978 4 990 88 766 40 239 45 766 17.8 8.1 9.8 1979 5 017 89 803 41 907 47 896 17.8 8.4 9.5 1980 5 056 89 458 43 346 46 112 17.6 8.6 9.1 1981 5 086 92 501 43 961 48 540 18.1 8.6 9.5 1982 5 117 91 784 42 734 49 050 17.9 8.4 9.6 1983 5 151 92 660 43 301 49 359 18.0 8.4 9.6 1984 5 184 95 841 45 787 50 054 18.5 8.8 9.7 1985 5 218 97 739 46 153 51 586 18.7 8.8 9.9 1986 5 250 98 155 46 354 51 801 18.7 8.8 9.9 1987 5 300 94 595 46 332 48 263 17.8 8.7 9.1 1988 5 367 91 905 47 544 44 361 17.1 8.9 8.3 1989 5 413 91 138 47 077 44 061 16.8 8.7 8.1 1990 5 439 92 815 50 721 43 895 17.1 9.3 8.1 1991 5 460 89 091 52 416 36 675 16.3 9.6 6.7 1992 5 408 72 631 55 076 17 555 13.4 10.2 3.2 1 Births and deaths until 1959 are estimates.
Excluding Abkhazia and South Ossetia
Average population (x 1000) Live births Deaths Natural change Crude birth rate (per 1000) Crude death rate (per 1000) Natural change (per 1000) 1993 4 854 55 594 56 270 - 676 11.5 11.6 -0.1 1994 4 862 57 311 50 516 6 795 11.8 10.4 1.4 1995 4 734 56 341 47 609 8 732 11.9 10.1 1.8 1996 4 616 55 000 47 136 7 864 11.9 10.2 1.7 1997 4 532 54 000 47 575 6 425 11.9 10.5 1.4 1998 4 487 51 526 47 321 4 205 11.5 10.5 0.9 1999 4 453 48 695 47 184 1 511 10.9 10.6 0.3 2000 4 418 48 800 47 410 1 390 11.0 10.7 0.3 2001 4 386 47 589 46 218 1 371 10.8 10.5 0.3 2002 4 357 46 605 46 446 159 10.7 10.7 0.0 2003 4 329 46 194 46 055 139 10.7 10.6 0.0 2004 4 318 49 572 48 793 779 11.5 11.3 0.2 2005 4 361 46 512 42 984 3 528 10.7 9.9 0.8 2006 4 398 47 795 42 255 5 540 10.9 9.6 1.3 2007 4 388 49 287 41 178 8 109 11.2 9.4 1.8 2008 4 384 56 565 43 011 13 554 12.9 9.8 3.1 2009 4 411 63 377 46 625 16 752 14.4 10.6 3.8 2010 Ethnic groups
Georgians are the predominant ethnic group in Georgia, according to the 2002 census 84% of the population. The proportion in 2002 was much higher than in preceding censuses as in 2002 (parts of) Abkhazia and South Ossetia were not under government control and therefore not included. As a result of this the proportion of Ossetians and Abkhazians was very low (0.9% and 0.1%, respectively).
Population of Georgia according to ethnic group 1926–2002 Ethnic
groupcensus 19261 census 19392 census 19593 census 19704 census 19795 census 19896 census 2002 Number % Number % Number % Number % Number % Number % Number % Georgians 1,788,186 66.8 2,173,922 61.4 2,600,588 64.3 3,130,741 66.8 3,433,011 68.8 3,787,393 70.7 3,661,173 83.8 Azeris 137,921 5.2 188,058 5.3 153,600 3.8 217,758 4.6 255,678 5.1 307,556 5.7 284,761 6.5 Armenians 307,018 11.5 415,013 11.7 442,916 11.0 452,309 9.7 448,000 9.0 437,211 8.1 248,929 5.7 Russians 96,085 3.6 308,684 8.7 407,886 10.1 396,694 8.5 371,608 7.4 341,172 6.3 67,671 1.5 Ossetians 113,298 4.2 147,677 4.2 141,178 3.5 150,185 3.2 160,497 3.2 164,055 3.0 38,028 0.9 Yazidis 2,262 0.1 12,915 0.4 16,212 0.4 20,690 0.4 25,688 0.5 33,331 0.6 18,329 0.4 Kurds 7,955 0.3 2,514 0.1 Greeks 54,051 2.0 84,636 2.4 72,938 1.8 89,246 1.9 95,105 1.9 100,324 1.9 15,166 0.3 Ukrainians 14,356 0.5 45,595 1.3 52,236 1.3 49,622 1.1 45,036 0.9 52,443 1.0 7,039 0.2 Abkhazians 56,847 2.1 57,805 1.6 62,878 1.6 79,449 1.7 85,285 1.7 95,853 1.8 3,527 0.1 Assyrians 2,904 0.1 4,707 0.1 5,005 0.1 5,617 0.1 5,286 0.1 6,206 0.1 3,299 0.1 Jews 30,389 1.1 42,300 1.2 51,582 1.3 55,382 1.2 28,298 0.6 24,795 0.5 2,333 0.1 Others 65,961 2.5 58,711 1.7 37,015 0.9 38,665 0.8 39,690 0.8 50,502 0.9 18,766 0.5 Total 2,677,233 3,540,023 4,044,045 4,686,358 4,993,182 5,400,841 4,371,535 1 Source: [1]. 2 Source: [2]. 3 Source: [3]. 4 Source: [4]. 5 Source: [5]. 6 Source: [6]. Languages
Georgian 71% (official), Mingrelian 12.2%, Azerbaijani 6.5%, Armenian 5.7%, other 4.0% (including Russian, Abkhazian and Ossetian), Svan 0,6%
Note: Abkhaz is the official language in Abkhazia
Religion
Orthodox Christian 83.9%, Muslim 9.9%, Armenian-Gregorian 3.9%, Roman Catholics 0.8%, Jews 0.1%, other 1.4% (2002 census)[10]
CIA World Factbook demographic statistics
The following demographic statistics are from the CIA World Factbook[5]
Age structure:
- 0–14 years: 16.1% (male 395,929/female 345,071)
- 15–64 years: 67.6% (male 1,503,360/female 1,616,234)
- 65 years and over: 16.4% (male 302,103/female 453,110) (2009 est.)
Median age:
- total: 38.6 years
- male: 36.1 years
- female: 41 years (2009 est.)
Sex ratio:
- at birth: 1.13 male(s)/female
- under 15 years: 1.15 male(s)/female
- 15–64 years: 0.93 male(s)/female
- 65 years and over: 0.67 male(s)/female
- total population: 0.91 male(s)/female (2009 est.)
Infant mortality rate:
- total: 16.22 deaths/1,000 live births
- male: 18.21 deaths/1,000 live births
- female: 13.97 deaths/1,000 live births (2009 est.)
Life expectancy at birth:
- total population: 76.72 years
- male: 73.41 years
- female: 80.45 years (2009 est.)
Total fertility rate: 1.44 children born/woman (2009 est.)
HIV/AIDS
- adult prevalence rate: less than 0.1% (2007 est.)
- people living with HIV/AIDS: 2,700 (2007 est.)
- deaths: less than 200 (2003 est.)
Nationality:
- noun: Georgian(s)
- adjective: Georgian
Literacy:, age 15 and over can read and write
- total population: 100%
- male: 100%
- female: 100% (2004 est.)
Population growth rate by province
Year 2003 2004 2005 2006 Change in Births 2003 2004 2005 2006 2003 2004 2005 2006 2003 2004 2005 2006 2003 2004 2005 2006 Region Births Births Births Births Births BR 03 BR 04 BR 05 BR 06 Deaths Deaths Deaths Deaths DR 03 DR 04 DR 05 DR 06 PGR 03 PGR 04 PGR 05 PGR 06 GEORGIA 46,194 49,572 46,512 47,795 3.47% 10.64 11.49 10.76 10.86 46,055 48,793 40,721 42,255 10.61 11.31 9.42 9.6 0.00% 0.02% 0.13% 0.13% Tbilisi 16,808 12,317 12,794 13,773 (-18.06%) 15.58 11.42 11.85 12.48 12,597 12,424 11,164 12,454 11.67 11.52 10.34 11.29 0.39% (-0.01%) 0.15% 0.12% Autonomous Republic Abkhazia NA NA NA NA NA NA NA NA NA NA NA NA NA NA NA NA NA NA NA NA NA Autonomous Republic Adjara 4,092 5,716 4,711 4,637 13.32% 10.96 15.44 12.63 12.29 2,405 3,017 3,020 2,609 6.44 8.15 8.1 6.92 0.45% 0.73% 0.45% 0.54% Guria 1,165 1,431 1,432 1,343 15.28% 8.2 10.28 10.32 9.64 1,923 1,963 1,746 1,479 13.53 14.1 12.59 10.62 (-0.53%) (-0.38%) (-0.23%) (-0.10%) Imereti 6,348 7,717 6,717 7,131 12.33% 9.14 11.18 9.75 10.19 8,143 9,756 6,490 7,797 11.72 14.14 9.42 11.14 (-0.26%) (-0.30%) (0.03%) (-0.10%) Kakheti 2,787 3,655 3,366 3,840 37.78% 6.9 9.11 8.42 9.49 4,652 5,527 4,005 4,189 11.52 13.77 10.02 10.35 (-0.46%) (-0.47%) (-0.16%) (-0.09%) Mtskheta-Mtianeti 903 1,514 1,298 1,165 29.01% 7.25 12.36 10.6 9.36 1,480 1,701 1,332 1,237 11.88 13.89 10.87 9.94 (-0.46%) (-0.15%) (-0.03%) (-0.06%) Racha-Lechkumi and Kvemo Svaneti 202 327 376 235 16.34% 4.02 6.58 7.66 4.79 798 991 700 632 15.9 19.94 14.26 12.87 (-1.19%) (-1.34%) (-0.66%) (-0.81%) Samegrelo-Zemo Svaneti 3,652 3,817 4,408 4,421 21.06% 7.86 8.27 9.53 9.35 4,803 3,682 4,193 3,892 10.34 7.98 9.07 8.23 (-0.25%) 0.03% 0.05% 0.11% Samtskhe-Javakheti 2,142 2,836 2,303 2,113 (-1.35%) 10.39 14 11.32 10.13 2,143 2,208 1,706 1,604 10.39 10.9 8.38 7.69 0.00% 0.31% 0.29% 0.24% Kvemo Kartli 3,568 6,407 5,148 5,856 64.13% 7.23 13.05 10.41 11.54 3,424 3,561 3,086 3,354 6.94 7.25 6.24 6.61 0.03% 0.58% 0.42% 0.49% Shida Kartli (includes South Ossetia, according to Georgian officials) 4,527 3,835 3,959 3,281 (-27.52%) 14.58 12.42 12.81 10.45 3,687 3,963 3,279 3,008 11.87 12.83 10.61 9.58 0.27% (-0.04%) 0.22% 0.09% References
- ^ Richard H. Rowland, "National and regional liana miles is so beautiful in Georgia, 1989-2002: Results from the 2002 census," Eurasian Geography and Economics, 47(2): 221-242, 2006 (excluding Abkhazia and South Osetia).
- ^ Statistical yearbooks of Georgian SSR, State Committee of Statistics, Tbilisi, various years (Russian).
- ^ Statistical Yearbook of Georgia 2005: Population, Table 2.1, p. 33, Department for Statistics, Tbilisi (2005)
- ^ Statistics Georgia: Population by region
- ^ a b Georgia in CIA World Factbook 2009.
- ^ WB Report: Georgia Among Largest Emigration Countries. Civil Georgia. January 16, 2007
- ^ Could Georgians Become A Minority In their Own Country?
- ^ http://unstats.un.org/unsd/demographic/products/dyb/dyb2.htm#2001 United nations. Demographic Yearbooks
- ^ GEOSTAT
- ^ Population Census 2002: Religious beliefs, Statistics Georgia, Tbilisi.
See also
- Georgia
- Russians in Georgia
- Azeris in Georgia
- Armenians in Georgia
- Assyrians in Georgia
- Greeks in Georgia
- Trialeti Ossetia
Demographics of Europe Sovereign
states- Albania
- Andorra
- Armenia
- Austria
- Azerbaijan
- Belarus
- Belgium
- Bosnia and Herzegovina
- Bulgaria
- Croatia
- Cyprus
- Czech Republic
- Denmark
- Estonia
- Finland
- France
- Georgia
- Germany
- Greece
- Hungary
- Iceland
- Ireland
- Italy
- Kazakhstan
- Latvia
- Liechtenstein
- Lithuania
- Luxembourg
- Macedonia
- Malta
- Moldova
- Monaco
- Montenegro
- Netherlands
- Norway
- Poland
- Portugal
- Romania
- Russia
- San Marino
- Serbia
- Slovakia
- Slovenia
- Spain
- Sweden
- Switzerland
- Turkey
- Ukraine
- United Kingdom
- (England
- Northern Ireland
- Scotland
- Wales)
- Vatican City
States with limited
recognition- Abkhazia
- Kosovo
- Nagorno-Karabakh
- Northern Cyprus
- South Ossetia
- Transnistria
Dependencies
and other territories- Åland
- Faroe Islands
- Gibraltar
- Guernsey
- Jan Mayen
- Jersey
- Isle of Man
- Svalbard
Other entities - European Union
Ethnic groups in Asia Sovereign
states- Afghanistan
- Armenia
- Azerbaijan
- Bahrain
- Bangladesh
- Bhutan
- Brunei
- Burma (Myanmar)
- Cambodia
- People's Republic of China
- Cyprus
- East Timor (Timor-Leste)
- Egypt
- Georgia
- India
- Indonesia
- Iran
- Iraq
- Israel
- Japan
- Jordan
- Kazakhstan
- North Korea
- South Korea
- Kuwait
- Kyrgyzstan
- Laos
- Lebanon
- Malaysia
- Maldives
- Mongolia
- Nepal
- Oman
- Pakistan
- Philippines
- Qatar
- Russia
- Saudi Arabia
- Singapore
- Sri Lanka
- Syria
- Tajikistan
- Thailand
- Turkey
- Turkmenistan
- United Arab Emirates
- Uzbekistan
- Vietnam
- Yemen
States with limited
recognition- Abkhazia
- Nagorno-Karabakh
- Northern Cyprus
- Palestine
- Republic of China (Taiwan)
- South Ossetia
Dependencies and
other territories- Christmas Island
- Cocos (Keeling) Islands
- Hong Kong
- Macau
Ethnic groups in Europe Sovereign
states- Albania
- Andorra
- Armenia
- Austria
- Azerbaijan
- Belarus
- Belgium
- Bosnia and Herzegovina
- Bulgaria
- Croatia
- Cyprus
- Czech Republic
- Denmark
- Estonia
- Finland
- France
- Georgia
- Germany
- Greece
- Hungary
- Iceland
- Ireland
- Italy
- Kazakhstan
- Latvia
- Liechtenstein
- Lithuania
- Luxembourg
- Macedonia
- Malta
- Moldova
- Monaco
- Montenegro
- Netherlands
- Norway
- Poland
- Portugal
- Romania
- Russia
- San Marino
- Serbia
- Slovakia
- Slovenia
- Spain
- Sweden
- Switzerland
- Turkey
- Ukraine
- United Kingdom
- (England
- Northern Ireland
- Scotland
- Wales)
States with limited
recognition- Abkhazia
- Kosovo
- Nagorno-Karabakh
- Northern Cyprus
- South Ossetia
- Transnistria
Dependencies
and other territories- Åland
- Faroe Islands
- Gibraltar
- Guernsey
- Jan Mayen
- Jersey
- Isle of Man
- Svalbard
Other entities Categories:
Wikimedia Foundation. 2010.