- Demographics of Europe
-
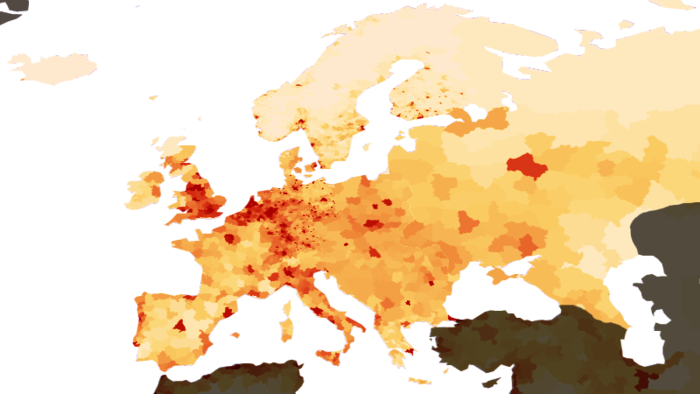
 Distribution of population in the EU and EFTA countries, including candidate countries (2007)
 < 50 inhabitants per km250 to 100 inhab. per km2100 to 150 inhab. per km2150 to 300 inhab. per km2300 to 1000 inhab. per km2> 1000 inhab. per km2no data available
 Population growth and decline in Europe
Figures for the population of Europe vary according to which definition of European boundaries is used. The population within the standard physical geographical boundaries was 731 million in 2005 according to the United Nations[1]. In 2010 the population is 857 million, using a definition which includes the whole of the transcontinental countries of Russia and Turkey. Population growth is comparatively slow, and median age comparatively high in relation to the world's other continents[citation needed].
Since the Renaissance, Europe has had a dominating influence in culture, economics and social movements in the world. European demography is important not only historically, but also in understanding current international relations and population issues.
Some current and past issues in European demography have included religious emigration, race relations, economic immigration, a declining birth rate and an ageing population. In some countries, such as Poland, access to abortion is currently limited and entirely illegal in the Mediterranean nation of Malta. In the past, such restrictions and also restrictions on artificial birth control were commonplace throughout Europe. Furthermore, some European countries (currently Belgium, the Netherlands, Luxembourg and Switzerland) have allowed a limited form of voluntary euthanasia. It remains to be seen how much demographic impact this may have.
Contents
Total population
In 2009 the population of Europe was estimated to be 852.4 million according to the United Nations,[1] which was slightly more than 13% of world population. The precise figure depends on the exact definition of the geographic extent of Europe. The population of the EU was 499 million as of 2008. Non-EU countries situated in Europe in their entirety[2] account for another 94 million. Five transcontinental countries[3] have a total of 240 million people, of which about half reside in Europe proper.
A century ago, Europe was home to 25% of the world's population. While the population of the continent has grown, it hasn't come close to the pace of Asia or Africa. As it stands now, around 12% of the world's people live on this continent, but if demographic trends keep their pace, Europe's share may fall to around 7% in 2050. Declining birth rates (primarily in Eastern and Central Europe) and a high life expectancy in most European states means that the aging and declining population will be a problem for many European economies, political and social institutions. Northern and Western Europe have generally stronger growth than their Southern and Eastern counterparts. Albania and Ireland have strong growth, all hitting 1%.
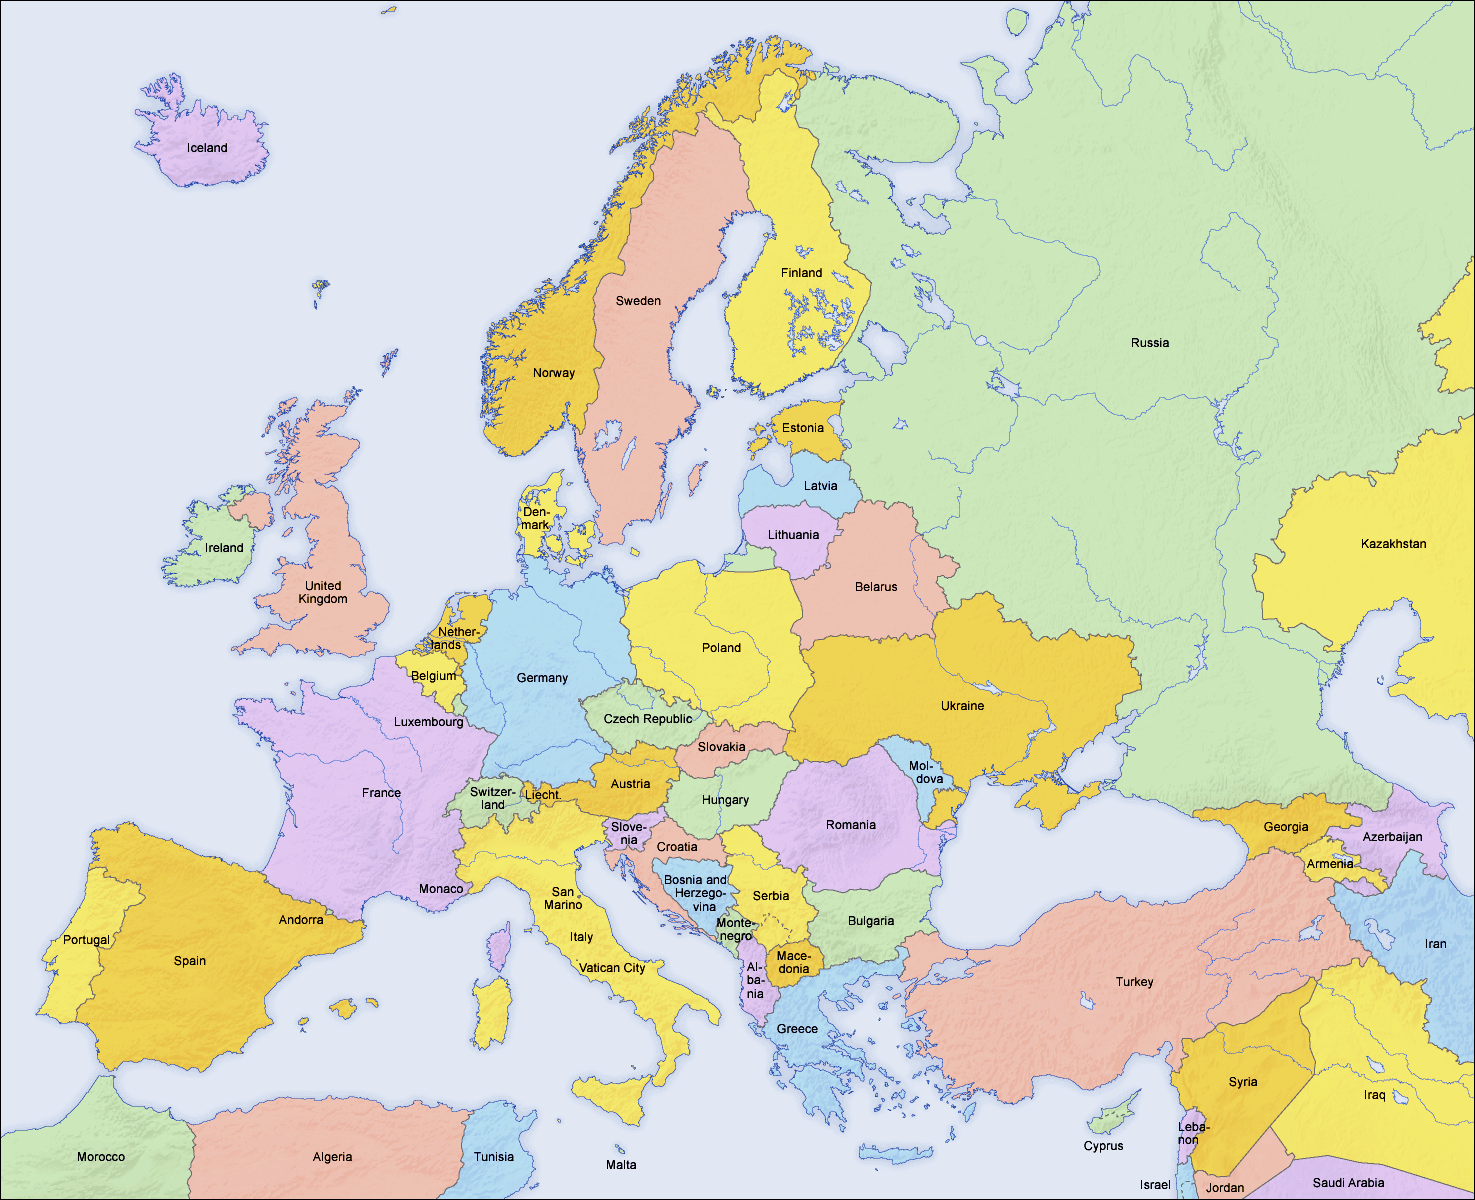
Population by country
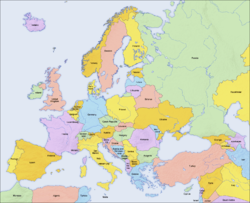 Modern political map (2006).
 "European countries" according to the EU.[4]
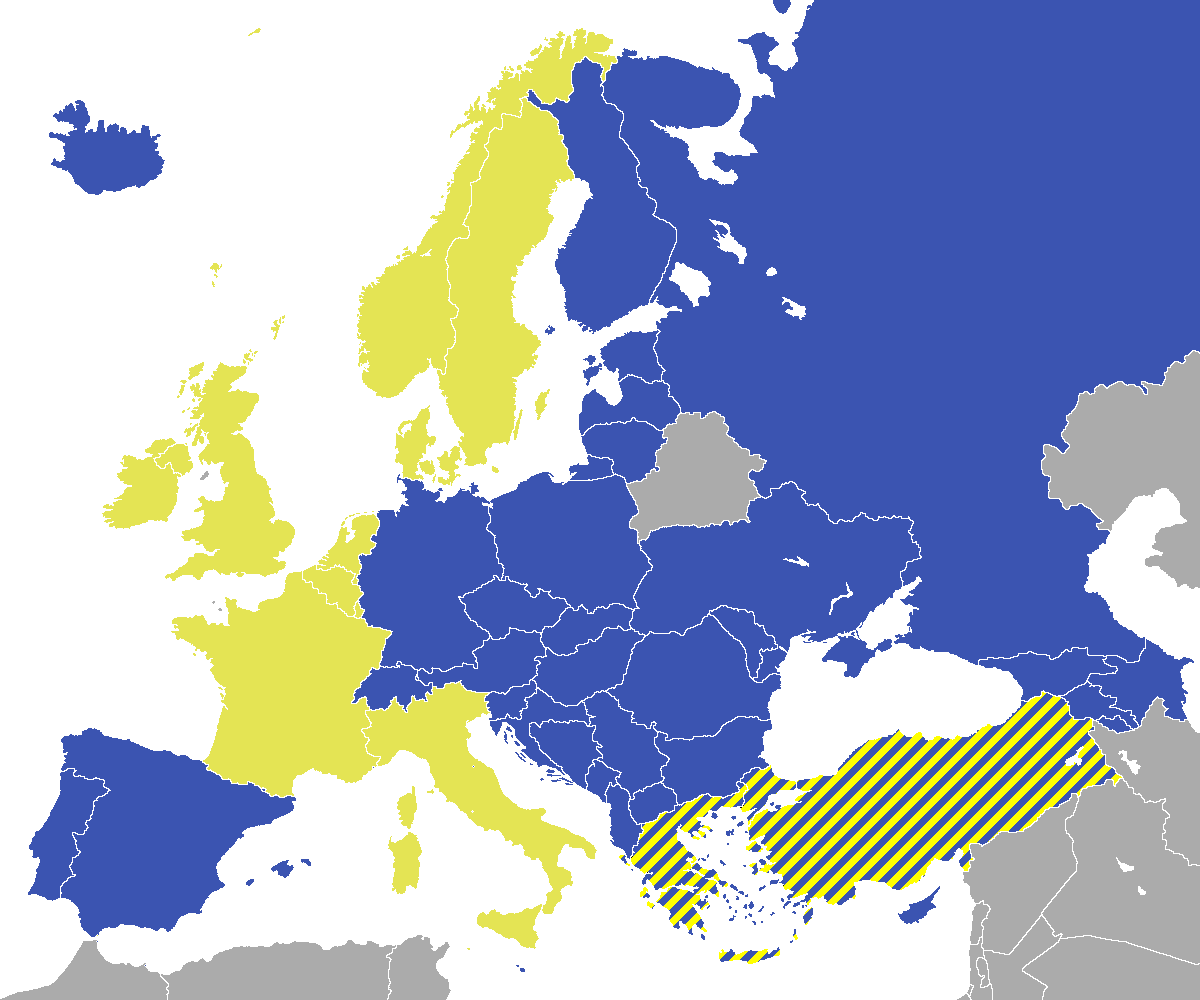
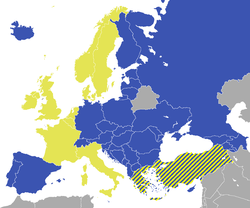 Council of Europe nations, with founding nations in yellow.
 Regional grouping according to the UN.
Northern EuropeWestern EuropeEastern Europe
Southern Europe
Asian portions of European countriesNon-European countriesAccording to different definitions, such as consideration of the concept of Central Europe, the following territories and regions may be subject to various other categorisations.
Name of regiona[›] and
territory, with flagArea
(km²)Population
(1 July 2010 est.)Population density
(per km²)Capital  Åland (within Finland)
1,551 26,008 16.8 Mariehamn  Albania
28,748 3,600,523 125.2 Tirana  Andorra
468 82,403 146.2 Andorra la Vella  Armenia
29,800 3,263,600 108.4 Yerevan  Austria
83,858 8,414,638 97.4 Vienna  Belarus
207,600 9,503,807 49.8 Minsk  Belgium
30,510 11,007,020 336.8 Brussels  Bosnia and Herzegovina
51,129 4,048,500 77.5 Sarajevo  Bulgaria
110,910 7,621,337 68.7 Sofia  Croatia
56,542 4,637,460 77.7 Zagreb  Cypruse[›]
9,251 863,457 85 Nicosia  Czech Republic
78,866 10,535,811 130.1 Prague  Denmark
43,094 5,568,854 124.6 Copenhagen  Estonia
45,226 1,315,681 31.3 Tallinn  Faroe Islands (Denmark)
1,399 46,011 32.9 Tórshavn  Finland
336,593 5,357,537 15.3 Helsinki  Franceh[›]
547,030 65,447,374 109.3 Paris  Georgiam[›]
69,700 4,461,473 64 Tbilisi  Germany
357,021 81,757,600 233.2 Berlin  Gibraltar (UK)
5.9 27,714 4,697.3 Gibraltar  Greece
131,940 11,645,343 80.7 Athens  Greenland (Denmark)
2,166,086 56,452 0.027 Nuuk  Guernseyd[›]
78 66,587 828.0 St. Peter Port  Hungary
93,030 9,979,000 108.3 Budapest  Iceland
103,000 304,261 2.7 Reykjavík  Ireland
70,280 4,434,925 60.3 Dublin  Isle of Mand[›]
572 80,873 129.1 Douglas  Italy
Italy301,230 60,418,711 191.6 Rome  Jerseyd[›]
116 89,775 773.9 Saint Helier  Kosovo[a]
10,908 1,733,872 159 Pristina  Latvia
64,589 2,366,515 36.6 Riga  Liechtenstein
160 35,322 205.3 Vaduz  Lithuania
65,200 3,401,138 55.2 Vilnius  Luxembourg
2,586 472,569 173.5 Luxembourg  Republic of Macedonia
25,333 2,054,800 81.1 Skopje  Malta
Malta316 408,009 1,257.9 Valletta  Moldovab[›]
33,843 3,834,547 131.0 Chişinău  Monaco
1.95 32,087 16,403.6 Monaco  Montenegro
13,812 672,180 44.6 Podgorica  Netherlandsi[›]
41,526 16,696,700 393.0 Amsterdam  Norway
324,220 4,930,116 14.0 Oslo  Poland
312,685 38,192,000 123.5 Warsaw  Portugalf[›]
91,568 10,607,995 110.1 Lisbon  Romania
238,391 21,959,278 91.0 Bucharest  Russiac[›]
17,075,400 142,905,208 8.3 Moscow  San Marino
61 31,730 454.6 San Marino  Serbiag[›]
77,474 7,345,000[5] 103.6 Belgrade  Slovakia
48,845 5,422,366 111.0 Bratislava  Slovenia
20,273 2,012,917 95.3 Ljubljana  Spain
Spain504,851 47,150,800 89.3 Madrid Svalbard and Jan
Mayen Islands (Norway)62,049 2,868 0.046 Longyearbyen  Sweden
449,964 9,360,113 19.7 Stockholm  Switzerland
41,290 7,785,000 176.8 Bern  Turkey
744,820 72,041,708 69.2 Ankara  Ukraine
603,628 45,939,820 76.0 Kiev  United Kingdom
244,820 62,041,708 244.2 London  Vatican City
0.44 900 2,045.5 Vatican City Total 10,180,000o[›] 832,211,436o[›] 81.8 Population map

References
- ^ a b "World Population Prospects: The 2006 Revision Population Database". UN — epartment of Economic and Social Affairs. http://www.un.org/esa/population/publications/wpp2006/wpp2006.htm. Retrieved 2011-10-17.
- ^ Albania 3.6, Belarus 10.3, Bosnia and Herzegovina 4.4, Croatia 4.4, Iceland 0.3, Republic of Macedonia 2.0, Moldova 4.4, Norway 4.5, Serbia+Kosovo 9.7, Switzerland 7.5, Ukraine 45.4
- ^ Russia 142, Georgia 4.7, 8.6
- ^ "European countries according to the EU". European Commission. http://europa.eu/abc/european_countries. Retrieved 2008-06-13.
- ^ https://www.cia.gov/library/publications/the-world-factbook/rankorder/2119rank.html?countryName=Serbia&countryCode=ri®ionCode=eu&rank=97#ri
Age
Main article: Aging of EuropePerhaps mirroring its declining population growth, European countries tend to have older populations overall. European countries had nine of the top ten highest median ages in national populations in 2005. Only Japan had an older population.[1]
Religion
Main article: Religion in EuropeFurther information: Christianity in Europe and Islam in EuropeOver the last several decades, religious practice has been on the decline in a process of "Secularization." European countries have experienced a decline in church attendance, as well as a decline in the number of people professing a belief in a god. The Eurobarometer Poll 2005 found that, on average, 52% of the citizens of EU member states state that they believe in a god, 27% believe there is some sort of spirit or life Force while 18% do not believe there is any sort of spirit, god or Life Force, and 3% declined to answer. According to a recent study,[2] 47% of Frenchmen declared themselves as agnostic in 2003. This situation is often called "Post-Christian Europe".
A decrease in religiousness and church attendance in western Europe (especially Belgium, Czech Republic, Finland, France, Germany, United Kingdom, Norway, the Netherlands and Sweden) has been noted. The Eurobarometer poll must be taken with caution, however, as there are discrepancies between it and national census results. For example in the United Kingdom, the 2001 census revealed over 70% of the population regarded themselves as "Christian" with only 15% professing to have "no religion", though the wording of the question has been criticized as "leading" by the British Humanist Association.[3]
Ethnic groups
Main article: Ethnic groups in EuropeFurther information: Immigration to EuropeThe largest ethnic groups of Europe are the Russians with 105 million (in European Russia, Ukraine, Belarus, the Baltic States, and Western Europe), followed by the Germans (80 million), Turkish (68 million),French (65 million), British (61 million), Italians (60 million), Ukrainians (45 million) , Spanish (44 million) and the Poles (40 million). The smallest ethnic group in Europe are the Maltese: Malta has a population of 419,285 and 95.3%[4] is ethnically Maltese.
Non-European immigrant groups (Middle Eastern, African, Asian etc.) account for about 3% to 4% of the European population or 22 to 30 million people.
Size and geographic distribution of the 87 peoples of Europe according to Pan & Pfeil (2004).[5]Font size reflects population size (groups smaller than 2 million not to scale) Groups not shown due to lack of geographic concentration: Romani (3.8 million), Jews (1.3 million), Karaim (4,600). Small Caucasian groups (<0.2 million) not shown in map: Cherkes, Karachays, Lak, Tabasarans, Balkars, Nogais, Rutuls, Tats, Tsakhurs.
 SwedesKabardsLezginsVepsiansRomansh
Language
Main article: Languages of EuropeEurope has 30-40 major languages depending on definition. The European Union (EU), which currently excludes Norway, Switzerland and many eastern European countries, recognises 23 official languages as of 2007.[6] According to the same source, the eight most natively spoken languages in the EU are (percentage of total European population[7]):
- 19% German
- 13% French
- 12% English
- 11% Italian
- 9% Spanish
- 9% Polish
- 7% Romanian[citation needed]
- 5% Dutch
These figures change when foreign language skills are taken into account. The list below shows the top eight European languages ordered by total number of speakers in the EU:[8]
- 49% English
- 35% German
- 26% French
- 16% Italian
- 15% Spanish
- 10% Polish
- 7% Russian
- 6% Dutch
This makes German the most frequently spoken native language and English the most frequently spoken non-native language overall in the European Union, with German the second-most common language overall.
Foreign language skills
Luxembourg, Romania, the Netherlands, Denmark, Iceland, Malta, Sweden, Slovenia, Belgium, Lithuania and Finland are the European countries with the most foreign language skills. This refers to all foreign languages. English is spoken most frequently in the UK, Ireland, Malta, Sweden, Iceland, Denmark, and the Netherlands. The largest countries in Europe have the following percentages of English language skills: 44% Germany, 32% France, 28% Italy, 22% Poland, 18% Spain. The countries with the least foreign language skills are the UK, Ireland (although it should be noted Irish is the main second language taught in schools, although this is not a foreign language), Italy and Spain.[9] [10]
Extinct and endangered languages
Many languages have become extinct in Europe and the process is continuing. Languages that are already rated as extinct by the UNESCO Red Book include Old Prussian and Cornish. Nearly extinct and seriously endangered languages include several Sami, Frisian, Tsakonian and Breton.[11]
Genetic origins
Main article: Genetic history of EuropeFurther information: White people and CaucasoidHomo sapiens appeared in Europe roughly 40,000 years ago, with the settlement of the Cro-magnons. Over the prehistoric period there was continual immigration to Europe, notably by the immediate descendents of the Proto-Indo-Europeans who migrated west after the advent of the neolithic revolution.[12]
The vast majority of Europe’s inhabitants are of the European (or Caucasoid) geographic race, characterized by pale or lightly pigmented skin, variability in eye and hair colour, and a number of biochemical similarities.[13]
MtDna and Y-Dna
Studies of mitochondrial DNA (mtDNA) have suggested substantial genetic homogeneity of European populations,[14] with only a few geographic or linguistic isolates appearing to be genetic isolates as well.[15] On the other hand, analyses of the Y chromosome [16] [17] and of autosomal diversity [18] have shown a general gradient of genetic similarity running from the southeast to the northwest of the continent.
But, well-known areas with Mt-Dna and Y-Dna differences, discovered by grouping and tracking prehistorical genotype migrations, are in Iberia, in relation to the Basques of northern Spain and southwest France; and the Balkans of southeast Europe. Both were areas of refuge where early modern humans settled over 50,000 years ago, during the last ice age.[citation needed]
Population structure
A very recent study in May 2009 [19] that studied 19 populations from Europe using 270,000 SNPs highlighted the genetic diversity of European populations corresponding to the northwest to southeast gradient and distinguished "four several distinct regions" within Europe:
- Finland, in relation to the Saami.
- the Baltic states (Estonia, Latvia and Lithuania), western Russia and Poland.
- Central and Western Europe.
- Italy, South-Eastern Europe, Southern Russia.
In this study, Fst (Fixation index) was found to correlate considerably with geographic distances ranging from ≤0.0010 for neighbouring populations to 0.0230 for Southern Italy and Finland. For comparisons, pair-wise Fst of non-European samples were as follows: Europeans – Africans (Yoruba) 0.1530; Europeans – Chinese 0.1100; Africans (Yoruba) – Chinese 0.1900.[20]
See also
- Demographics of the European Union
- Area and population of European countries
- European Union Statistics
- Largest European metropolitan areas
- Largest urban areas of the European Union
- Largest cities of the European Union by population within city limits
- List of European countries by population growth rate
- Genetic history of Europe
- Classical demography
- Medieval demography
- Ethnic groups in Europe
- European diasporas
Notes
^ a: Continental regions as per UN categorisations/map. Depending on definitions, various territories cited below may be in one or both of Europe and Asia, or Africa.
^ b: Includes Transnistria, a region that has declared, and de facto achieved, independence; however, it is not recognised de jure by sovereign states.
^ c: Russia is considered a transcontinental country in Eastern Europe and Northern Asia. However the population and area figures include the entire state.
^ d: Guernsey, the Isle of Man and Jersey are Crown dependencies of the United Kingdom. Other Channel Islands legislated by the Bailiwick of Guernsey include Alderney and Sark.
^ e: Cyprus is sometimes considered transcontinental country. Physiographically entirely in Western Asia it has strong historical and sociopolitical connections with Europe. The population and area figures refer to the entire state, including the de facto independent part Northern Cyprus.
^ f: Figures for Portugal include the Azores and Madeira archipelagos, both in Northern Atlantic.
^ g: Figures for Serbia include Kosovo, a province that unilaterally declared its independence from Serbia on 17 February 2008, and whose sovereign status is unclear.
^ h: Figures for France include metropolitan France and overseas departments and territories.
^ i: Netherlands population for July 2004. Population and area details include European portion only: Netherlands and two entities outside Europe (Aruba and the Netherlands Antilles, in the Caribbean) constitute the Kingdom of the Netherlands. Amsterdam is the official capital, while The Hague is the administrative seat.
^ j: Kazakhstan is physiographically considered a transcontinental country in Central Asia (UN region) and Eastern Europe, with European territory west of the Ural Mountains and both the Ural and Emba rivers. However, area and population figures refer to the entire country.
^ k: Armenia is physiographically entirely in Western Asia, but it has strong historical and sociopolitical connections with Europe. The population and area figures include the entire state respectively.
^ m: Georgia is often considered a transcontinental country in Western Asia and Eastern Europe. However, the population and area figures include the entire state. This also includes Georgian estimates for Abkhazia and South Ossetia, two regions that have declared and de facto achieved independence. The International recognition, however, is limited.
^ o: The total figures for area and population includes the whole of the transcontinental countries. The precision of these figure is compromised by the ambiguous geographical extend of Europe and the lack of references for European portions of transcontinental countries.
^ p: Kosovo unilaterally declared its independence from Serbia on 17 February 2008. Its sovereign status is unclear. Its population is a 2007 estimate.
^ r: Abkhazia and South Ossetia unilaterally declared their independence from Georgia on 25 August 1990 and 28 November 1991 respectively. Their sovereign status is unclear. Population figures stated as of 2003 census and 2000 estimates respectively.References
- ^ United Nations Population Division, World Population Prospects: The 2004 Revision Highlights. 2005
- ^ Dogan, Mattei, Religious Beliefs in Europe: Factors of Accelerated Decline, 2003
- ^ Census 2011
- ^ "MALTA : general data". Populstat.info. http://www.populstat.info/Europe/maltag.htm. Retrieved 2010-04-28.
- ^ Pan and Pfeil, National Minotiries in Europe (2004), ISBN 978-3-7003-1443-1. The Peoples of Europe by Demographic Size, Table 1, pp. 11f. (a breakdown by country of these 87 groups is given in Table 5, pp. 17-31.)
- ^ EUROPA - Education and Training - Languages in Europe
- ^ see http://ec.europa.eu/education/policies/lang/languages/index_en.html#languages%20of%20EU%2015 for full list
- ^ see http://ec.europa.eu/education/policies/lang/languages/index_en.html#Foreign%20language%20skills for full list
- ^ Eurobarometer 54 Special - Europeans and languages
- ^ EUROPA - Education and Training - Languages in Europe
- ^ Endangered languages in Europe: indexes
- ^ Encyclopædia Britannica, s.v. "Europe : The people".
- ^ Europe, Encyclopædia Britannica Online
- ^ Torroni A, Achilli A, Macaulay V, Richards M, Bandelt HJ (2006) Harvesting the fruit of the human mtDNA tree. Trends Genet 22: 339–345
- ^ Simoni L, Calafell F, Pettener D, Bertranpetit J, Barbujani G (2000) Geographic patterns of mtDNA diversity in Europe. Am J Hum Genet 66: 262–278
- ^ Chikhi L, Nichols RA, Barbujani G, Beaumont MA (2002) Y genetic data support the Neolithic demic diffusion model. Proc Natl Acad Sci U S A 99: 11008–11013
- ^ Roewer L, Croucher PJ, Willuweit S, Lu TT, Kayser M, et al. (2005) Signature of recent historical events in the European Y-chromosomal STR haplotype distribution. Hum Genet 116: 279–291
- ^ Barbujani G, Goldstein DB (2004) Africans and Asians abroad: genetic diversity in Europe. Annu Rev Genomics Hum Genet 5: 119–150
- ^ Genetic Structure of Europeans: A View from the North–East, Nelis et al. 2009
- ^ Pair-wise Fst between European samples
External links
- 10 Million Europeans - Will Europe's population collapse?
- Eurostat - Population and population change statistics
- Eurostat - Population projections
Demographics of Europe Sovereign
states- Albania
- Andorra
- Armenia
- Austria
- Azerbaijan
- Belarus
- Belgium
- Bosnia and Herzegovina
- Bulgaria
- Croatia
- Cyprus
- Czech Republic
- Denmark
- Estonia
- Finland
- France
- Georgia
- Germany
- Greece
- Hungary
- Iceland
- Ireland
- Italy
- Kazakhstan
- Latvia
- Liechtenstein
- Lithuania
- Luxembourg
- Macedonia
- Malta
- Moldova
- Monaco
- Montenegro
- Netherlands
- Norway
- Poland
- Portugal
- Romania
- Russia
- San Marino
- Serbia
- Slovakia
- Slovenia
- Spain
- Sweden
- Switzerland
- Turkey
- Ukraine
- United Kingdom
- (England
- Northern Ireland
- Scotland
- Wales)
- Vatican City
States with limited
recognition- Abkhazia
- Kosovo
- Nagorno-Karabakh
- Northern Cyprus
- South Ossetia
- Transnistria
Dependencies
and other territories- Åland
- Faroe Islands
- Gibraltar
- Guernsey
- Jan Mayen
- Jersey
- Isle of Man
- Svalbard
Other entities - European Union
Categories:- Demographics by region
- Europe
- European people
- Demographics of Europe


Wikimedia Foundation. 2010.