- Demographics of the European Union
-
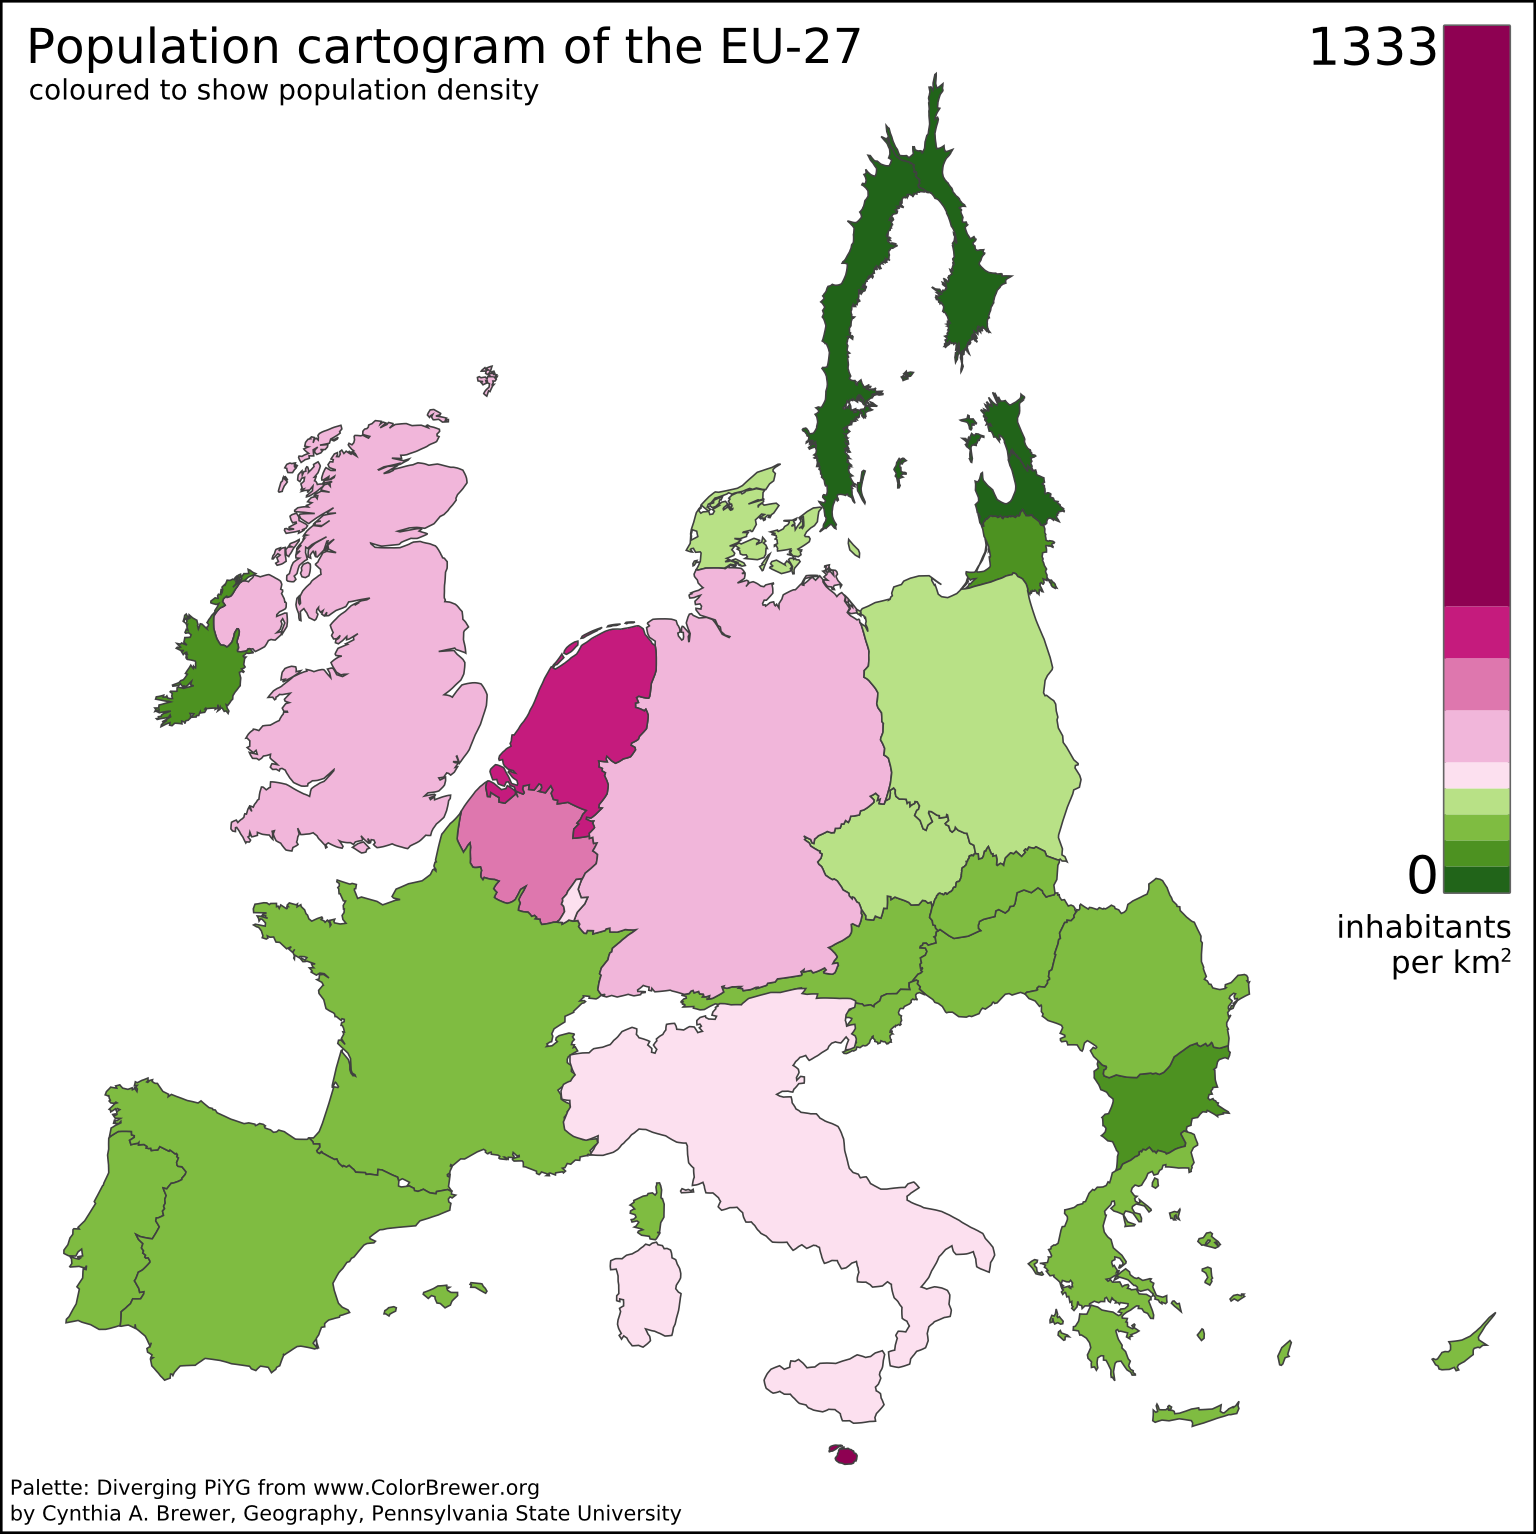
 The population density of the EU is 114 people per km².
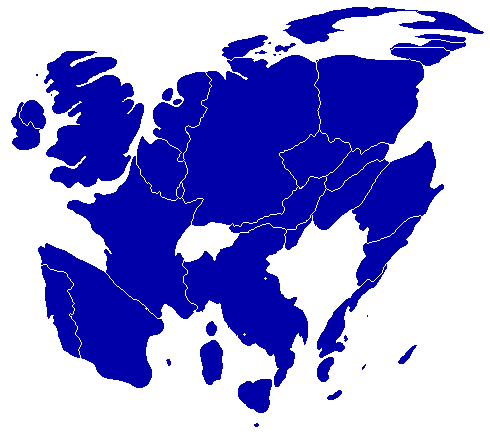
 A cartogram of population density.
The demographics of the European Union show a highly populated, culturally diverse union of 27 member states. As of 1 January 2011, the population of the EU is about 502.52 million people.[1] Many countries are expected to experience a decline in population over the coming decades,[2] though this could be offset with new countries planning to join the EU within the next 20 years.
The most populous member state is Germany, with an estimated 82.1 million people, and the least populous member state is Malta with 0.4 million. Birth rates in the EU are low with the average woman having 1.6 children. The highest birth-rates are found in the Republic of Ireland with 16.876 births per thousand people per year and France with 13.013 births per thousand people per year. Germany has the lowest birth rate in Europe with 8.221 births per thousand people per year.
Population and Land Areas of the 27 member-states of the European Union (1 Januaryst 2011 estimate) Member State Population
in thousandsPopulation
% of EUArea
km2Area
% of EUPop. density
People/km2 European Union
502,519.9 100 4,324,782 100 116.0  Austria
8,404.2 1.67 83,858 1.9 99.7  Belgium
10,951.7 2.15 30,510 0.7 352.0  Bulgaria
7,504.9 1.49 110,912 2.5 68.5  Cyprus
804.4 0.16 9,250 0.2 86.6  Czech Republic
10,532.8 2.1 78,866 1.8 132.8  Denmark
5,560.6 1.1 43,094 1.0 128.1  Estonia
1,340.2 0.27 45,226 1.0 29.6  Finland
5,375.3 1.07 337,030 7.6 15.8  France[3]
65,075.3 12.95 643,548 14.6 99.6  Germany
81,751.6 16.27 357,021 8.1 229.9  Greece
11,325.9 2.25 131,940 3.0 85.4  Hungary
9,985.7 1.99 93,030 2.1 107.8  Ireland
4,480.8 0.89 70,280 1.6 64.3  Italy
Italy60,626.4 12.06 301,320 6.8 200.4  Latvia
2,229.6 0.44 64,589 1.5 35.0  Lithuania
3,244.6 0.65 65,200 1.5 51.4  Luxembourg
511.8 0.1 2,586 0.1 190.1  Malta
Malta417.6 0.08 316 0.0 1,305.7  Netherlands
16,655.8 3.3 41,526 0.9 396.9  Poland
38,200.0 7.6 312,685 7.1 121.9  Portugal
10,636.9 2.12 92,931 2.1 114.4  Romania
21,413.8 4.26 238,391 5.4 90.2  Spain
Spain46,152.9 9.18 504,782 11.4 93.4  Slovakia
5,435.3 1.08 48,845 1.1 110.8  Slovenia
2,050.1 0.41 20,253 0.5 101.4  Sweden
9,415.6 1.87 449,964 10.2 20.6  United Kingdom
62,435.7 12.42 244,820 5.5 251.7 Contents
Most populous areas
The European union has a significant number of global cities. It contains 13 of the 60 cities which compose the 2008 Global Cities Index,[4] as well as 16 of the 41 "alpha" global cities classified by GaWC (including London, Paris, Milan, Amsterdam and Brussels among others).[5] The following is a list of the ten most populous cities, urban areas and urban zones in the European Union, with their population according to 2005 estimates.[citation needed]
City proper
(2005)
mill.Urban area
(2005)
mill.LUZ
(2001)
mill.


London 7.5 Paris 10.2 London 12.0 Berlin 3.4 London 8.6 Paris 11.6 Madrid 3.1 Ruhr Area 7.3 Madrid 5.6 Rome 2.7 Madrid 5.4 Ruhr Area 5.4 London Berlin Madrid Paris 2.2 Milan 4.3 Berlin 5.0 


Bucharest 1.9 Barcelona 4.2 Barcelona 4.2 Hamburg 1.8 Athens 3.8 Athens 4.0 Warsaw 1.7 Berlin 3.7 Rome 3.5 Budapest 1.7 Naples 3.0 Hamburg 3.1 Vienna 1.7 Rome 2.7 Milan 3.1 Rome Paris Bucharest Population shifts
Migration
There is substantial movement of people within the Union i.e. internal migration; this occurs in strong patterns:
- from former industrialised areas in the Benelux, Britain and Germany to the Sun belts in Spain, Portugal, Southern France and Italy.
- from poorer eastern countries of the EU to the richer countries of the western EU (UK, Ireland, Germany, Netherlands, France, Italy, Portugal, Spain)
The British emigration towards Southern Europe is of especial relevance. Citizens from the European Union make up a growing proportion of immigrants in Spain. They mainly come from countries like the UK and Germany, but the British case is of particular interest due to its magnitude. The British authorities estimate that the real population of UK citizens living in Spain is much bigger than Spanish official figures suggest, establishing them at about 1,000,000 and about 800,000 being permanent residents.[6][7][8][9][10][11][12]
In fact, according to the Financial Times, in 2007 Spain was the most favoured destination for West Europeans considering to move from their own country and seek jobs elsewhere in the EU.[13]
Immigration and emigration
There are currently more people immigrating into the European Union than there are emigrating from it. Immigration is a controversial issue in many member states such as Belgium, Sweden, Germany, Italy, the Netherlands, Spain, and the UK.[citation needed] In 2010, 47.3 million people lived in the EU, who were born outside their resident country. This corresponds to 9.4% of the total EU population. Of these, 31.4 million (6.3%) were born outside the EU and 16.0 million (3.2%) were born in another EU member state. The largest absolute numbers of people born outside the EU were in Germany (6.4 million), France (5.1 million), the United Kingdom (4.7 million), Spain (4.1 million), Italy (3.2 million), and the Netherlands (1.4 million).[14]
Spain in particular receives most of the immigrants coming illegally to Europe from Africa, probably due to its large coastal area and its proximity and land borders to Morocco at Ceuta and Melilla; African immigrants try to enter the country by boat from Morocco or Senegal or by jumping the border fences. During the first weekend of September 2006, more than 1,300 illegal immigrants arrived on beaches in the Canary Islands[15] and estimations are that between 50,000 and 70,000 people enter the European Union illegally through Spanish borders or beaches. Border fences have been built at both the Ceuta and Melilla borders in an attempt to stop illegal entrance to the country. Illegal immigration is an issue in Spanish politics, and also a big human rights problem, since many people die during the journey. Spain has been Europe's largest absorber of migrants for the past six years, with its immigrant population increasing fourfold as 2.8 million people have arrived, mostly from Latin America. Spectacular growth in Spain's immigrant population came as the country's economy created more than half of all the new jobs in the European Union between 2001 and 2006.[16]
In other countries, such as Ireland or Portugal, immigration is not seen as such a big issue, probably due to those countries' history of emigration. Spain also has past history of emigration too, especially in the 1960s during Franco's dictatorship, but the fact that it receives the most immigrants in all of the EU has made the problem grow more important in political debate.
The net migration rate for the EU in 2008 was 3,1 per 1000 inhabitants.[17] This figure is for migration into and out of the European Union, and therefore excludes any internal movements between member states. Net migration has remained at an annual level of between 1.5 and 2 million since 2003.[17]
Country Total population 2010 (1000) Total Foreign-born (1000) % Born in other EU state (1000) % Born in a non EU state (1000) % EU 27 501'098 47'348 9.4 15'980 3.2 31'368 6.3 Germany 81'802 9'812 12.0 3'396 4.2 6'415 7.8 France 64'716 7'196 11.1 2'118 3.3 5'078 7.8 United Kingdom 62'008 7'012 11.3 2'245 3.6 4'767 7.7 Spain 45'989 6'422 14.0 2'328 5.1 4'094 8.9 Italy 60'340 4'798 8.0 1'592 2.6 3'205 5.3 Netherlands 16'575 1'832 11.1 428 2.6 1'404 8.5 Greece 11'305 1'256 11.1 315 2.8 940 8.3 Sweden 9'340 1'337 14.3 477 5.1 859 9.2 Austria 8'367 1'276 15.2 512 6.1 764 9.1 Belgium (2007) 10'666 1'380 12.9 695 6.5 685 6.4 Portugal 10'637 793 7.5 191 1.8 602 5.7 Denmark 5'534 500 9.0 152 2.8 348 6.3 Religion
The EU has significant religious diversity, mirroring its diverse history and culture. The largest religious group professes Christianity, predominantly Roman Catholicism, Protestantism and Eastern Orthodoxy. Several EU nations do not have Christian majorities for example (in the Czech Republic, Estonia, and The Netherlands, the majority has no religious affiliation).
Today, theism is losing prevalence in Europe in favour of atheism, and religion is losing prevalence in favour of secularism. European countries have experienced a decline in church attendance, as well as a decline in the number of people professing a belief in a god. The Eurobarometer Poll 2005 found that, on average, 52% of the citizens of EU member states state that they believe in a god, 27% believe there is some sort of spirit or Life Force while 18% do not believe there is any sort of spirit, god or Life Force, and 3% declined to answer.
A decrease in church membership and/ or church attendance in Europe (especially Belgium, Czech Republic, Finland, France, Germany, United Kingdom, Norway, the Netherlands and Sweden) has been noted, church attendance (percentagewise of the total population by country) in Northern and Western Europe is typically in the single digits.
The recent influx of immigrants to the affluent EU nations has brought in various religions of their native homelands, including Islam, Hinduism, Buddhism, Sikhism and Bahá'í Faith. Judaism has had a long history in Europe and has coexisted with the native populations for centuries, despite centuries of discrimination against Jewish people and several attendant periods of persecution or genocide by European rulers. Islam too has had a long history in Europe with Spain and Portugal at one time having a muslim majority.[18] As the Christian churches have historically wielded much power in Europe, reaction to this has allowed secularism to plant deep roots on European soil which has contributed to the rise in atheism and agnosticism.
Language
The first official languages of each of the 27 member countries has the status of an official language of the European Union. In total there are 23, with Irish, Bulgarian and Romanian gaining official language status on 1 January 2007, when the last two countries joined the union.
English is the most spoken language in the EU, being spoken by around 51% of its population. This high proportion is because 38% of EU citizens speak it as a language other than their mother tongue (i.e. second or foreign language). German is the most spoken first language, spoken by more than 18% of the population.
Demographic future
The EU faces challenges in its demographic future. Most concerns center around several related issues: an aging population, growing life expectancy and immigrant flow.
After hitting a historical low of 1.47 children born per female, the total fertility rate of the EU started to increase again, to reach a level of 1.60 in 2008.[19] The positive trend was observed in all member states with the exception of Luxembourg, Malta and Portugal. The largest increases over this period were observed in Bulgaria (from 1.23 children per woman in 2003 to 1.57 in 2009), Slovenia (from 1.20 to 1.53), the Czech Republic (from 1.18 to 1.49) and Lithuania (from 1.26 to 1.55).[19] In 2009, the Member States with the highest fertility rates were Ireland (2.07), France (2.00), the United Kingdom (1.96 in 2008) and Sweden (1.94), all approaching the replacement level of 2.1 children born per female.[19] The lowest rates were observed in Latvia (1.31), Hungary and Portugal (both 1.32) and Germany (1.36). The increasing fertility rate has also been accompanied by an upward trend in the natural increase of the population which is due to the moderate increase of the crude birth rate that reached 10.9 births per 1000 inhabitants in 2008, an increase of 0.3 compared with 2007. The increase was observed in all member countries except Germany. The EU crude death rate remained stable at 9.7 per 1000 inhabitants.[17] The relatively low fertility rate means retirement age workers are not entirely replaced by younger workers joining the workforce. The EU faces a potential future dominated by an ever-increasing population of retired citizens, without enough younger workers to fund (via taxes) retirement programs or other state welfare agendas.[20]
A low fertility rate, without supplement from immigration, also suggests a declining overall EU population,[21] which further suggests economic contraction or even a possible economic crisis.[22] Some media have noted the 'baby crisis' in the EU,[23] some governments have noted the problem,[24] and the UN and other multinational authorities continue to warn of a possible crisis.[25] At this point however such a decrease in the population of the EU is not observed as the overall natural growth remains positive and the EU continues to attract large numbers of immigrants. In 2010, a breakdown of the population by citizenship showed that there were 20.1 million foreign citizens living in the EU representing 4% of the population.[19]
Over the last 50 years, life expectancy at birth in the EU27 has increased by around 10 years for both women and men, to reach 82.4 years for women and 76.4 years for men in 2008. The life expectancy at birth rose in all Member States, with the largest increases for both women and men recorded in Estonia and Slovenia.[19]
Rank Country Population as of
2002[26]Population as of
2011[26]Percent change 1 Germany82,440,309 81,751,602 -0.8% 2 France61,424,036 65,075,310 5.9% 3 United Kingdom59,216,138 62,435,709 5.4% 4 Italy56,993,742 60,626,442 6.4% 5 Spain40,964,244 46,152,926 12.7% 6 Poland38,242,197 38,200,037 -0.1% 7 Romania21,833,483 21,413,815 -1.9% 8 Netherlands16,105,285 16,654,979 3.4% 9 Greece10,968,708 11,329,618 3.3% 10 Belgium10,309,725 10,918,405 5.9% 11 Portugal10,329,340 10,636,979 3.0% 12 Czech Republic10,206,436 10,532,770 3.2% 13 Hungary10,174,853 9,986,000 -1.9% 14 Sweden8,909,128 9,415,570 5.7% 15 Austria8,063,640 8,404,252 4.2% 16 Bulgaria7,891,095 7,504,868 -4.9% 17 Denmark5,368,354 5,560,628 3.6% 18 Slovakia5,378,951 5,435,273 1.0% 19 Finland5,194,901 5,375,276 3.5% 20 Ireland3,899,702 4,480,176 14.9% 21 Lithuania3,475,586 3,244,601 -6.6% 22 Latvia2,345,768 2,229,641 -5.0% 23 Slovenia1,994,026 2,050,189 2.8% 24 Estonia1,361,242 1,340,194 -1.5% 25 Cyprus705,539 804,435 14.0% 26 Luxembourg444,050 511,840 15.3% 27 Malta394,641 417,608 5.8% — European Union484,635,119 502,489,143 3.7% Ethnic composition
There is no precise or universally accepted definition of the terms "ethnic group" or "nationality". In the context of European ethnography in particular, the terms ethnic group, people (without nation state), nationality, national minority, ethnic minority, linguistic community, linguistic group and linguistic minority are used as mostly synonymous, although preference may vary in usage with respect to the situation specific to the individual countries of Europe.[27]
The 15 largest ethnic groups in the European Union are[citation needed]:
- the Germans (ca. 77 million)
- the French (ca. 65 million)
- the British (ca. 61 million) (Includes English ~50 million, Scots ~5million, Welsh ~3 million and Northern Irish ~1.7million)
- the Italians (ca. 60 million)
- the Poles (ca. 42 million)
- the Spanish (ca. 41 million) (Includes Basques ~2.3 million, Catalans ~4.6 million, Galicians ~1.1 million, Castilians ~11 million, Andalusians ~6.9 million and Valencians ~4.8 million)
- the Romanians (ca. 25 million) (Not counting Moldovans and Aromanians)
- the Dutch (ca. 16 million)
- the Hungarians (ca. 12 million)
- the Greeks (ca. 12 million)
- the Portuguese (ca 12 million)
- the Czechs (ca. 10 million)
- the Swedes (ca. 8 million)
- the Austrians (ca. 8 million)
- the Bulgarians (ca. 8 million)
These groups account for some 450 million or about 90% of European Union population. The remaining 10% is shared by various smaller ethnic groups including Flemings, Slovaks, Danes, Finns, Irish, Walloons, Lithuanians, Slovenes, Latvians, Estonians, Maltese, Frisians and Basques in France.
Miscellaneous statistics
Age structure: (2006 est.)
- 0–14 years: 16.03% (male 37,608,010/female 35,632,351)
- 15–64 years: 67.17% (male 154,439,536/female 152,479,619)
- 65 years and over: 16.81% (male 31,515,921/female 45,277,821)
Birth rate: 10.9 births/1,000 population 2008
Death rate: 9.7 deaths/1,000 population 2008
Net migration rate: 3.1 migrant(s)/1,000 population 2008
Marriage rate: 4.9 marriages/1,000 population 2007
Divorce rate: 2.0 divorces/1,000 population 2005
Sex ratio: (2006 est.)
- at birth: 1.06 male(s)/female
- under 15 years: 1.06 male(s)/female
- 15–64 years: 1.01 male(s)/female
- 65 years and older: 0.69 male(s)/female
- total population: 0.96 male(s)/female
Infant mortality rate: 2005
- total: 4.5 deaths/1,000 live births
- male: -
- female: -
- total population: 78.9 years
- male: 75.8 years
- female: 81.9 years
Total fertility rate: 1.60 children born/woman 2008
Live Births outside marriage: 33.0% of total live births 2005 increased to 37 % 3 years later 2008 page 42
See also
The demographics of the member states of the European Union:
References
- ^ "Population at 1 January". http://epp.eurostat.ec.europa.eu/tgm/table.do?tab=table&language=en&pcode=tps00001&tableSelection=1&footnotes=yes&labeling=labels&plugin=1. Retrieved 6 November 2011.
- ^ "The EU's baby blues", BBC News, 27 March 2006. Retrieved 10 July 2006.
- ^ Figures for France include the four overseas departments (French Guiana, Guadeloupe, Martinique, Réunion) which are integral parts of the European Union, but do not include the overseas collectivities and territories, which (but Saint Barthélemy and Saint Martin) are not part of the European Union. Figures for Metropolitan France proper are: population 63.136 million, area 551,695 km², and population density 114/km².
- ^ "The 2008 Global Cities Index". http://www.atkearney.com/index.php/Publications/global-cities-index.html. Retrieved 27 April 2010.
- ^ "GaWC - Inventory of World Cities 2008". http://www.lboro.ac.uk/gawc/world2008t.html. Retrieved 27 April 2010.
- ^ "Special Reports | Brits Abroad". BBC News. http://news.bbc.co.uk/2/shared/spl/hi/in_depth/brits_abroad/html/europe.stm. Retrieved 25 January 2011.
- ^ "UK | Brits Abroad: Country-by-country". BBC News. 11 December 2006. http://news.bbc.co.uk/2/hi/uk_news/6161705.stm. Retrieved 25 January 2011.
- ^ Giles Tremlett in Madrid. "Spain attracts record levels of immigrants seeking jobs and sun | World news". The Guardian. UK. http://www.guardian.co.uk/spain/article/0,,1830838,00.html. Retrieved 25 January 2011.
- ^ "British Immigrants Swamping Spanish Villages?". Byebyeblighty.com. 16 January 2007. http://www.byebyeblighty.com/1/british-immigrants-swamping-spanish-villages/. Retrieved 25 January 2011.
- ^ Jason Burke. "An Englishman's home is his casa as thousands go south | World news | The Observer". Guardian. UK. http://www.guardian.co.uk/spain/article/0,,1588156,00.html. Retrieved 25 January 2011.
- ^ Casciani, Dominic (11 December 2006). "UK | 5.5m Britons 'opt to live abroad'". BBC News. http://news.bbc.co.uk/2/hi/uk_news/6210358.stm. Retrieved 25 January 2011.
- ^ "UK | More Britons consider move abroad". BBC News. 2 August 2006. http://news.bbc.co.uk/2/hi/uk_news/5237236.stm. Retrieved 25 January 2011.
- ^ Author: Todor Roussanov. "News.bg - Europeans Favour Spain for Expat Jobs". International.ibox.bg. http://international.ibox.bg/news/id_1406161495. Retrieved 25 January 2011.
- ^ 6.5% of the EU population are foreigners and 9.4% are born abroad, Eurostat, Katya VASILEVA, 34/2011.
- ^ Canaries migrant surge tops 1,300 BBC News, 4 September 2006. Retrieved 4 September 2006.
- ^ Spain attracts record levels of immigrants seeking jobs and sun, The Guardian. Retrieved 26 July 2006.
- ^ a b c "5.4 million children born in EU27 in 2008". Eurostat. http://epp.eurostat.ec.europa.eu/cache/ITY_PUBLIC/3-03082009-AP/EN/3-03082009-AP-EN.PDF.
- ^ Hourani, Albert, History of the Arab Peoples, Faber & Faber, 2002, ISBN 0-571-21591-2
- ^ a b c d e Demography Report 2010. Latest figures on the demographic challenges in the EU
- ^ Economic and Financial Affairs -The Economic Policy Committee- Ageing[dead link]
- ^ "Regional Policy Inforegio". Ec.europa.eu. http://ec.europa.eu/regional_policy/sources/docoffic/official/reports/p142_en.htm. Retrieved 25 January 2011.
- ^ Ellison, Michael (22 March 2000). "Immigrants needed to save west from crisis". The Guardian (London). http://www.guardian.co.uk/population/Story/0,,184292,00.html. Retrieved 1 May 2010.
- ^ "The EU's baby blues". BBC News. 27 March 2006. http://news.bbc.co.uk/2/hi/europe/4768644.stm. Retrieved 1 May 2010.
- ^ Mettler, Ann (30 January 2007). "The EU's Window of Opportunity". BusinessWeek. http://www.businessweek.com/globalbiz/content/jan2007/gb20070130_790576.htm. Retrieved 25 January 2011.
- ^ "UN" (PDF). http://www.un.org/esa/population/publications/migration/eu.pdf. Retrieved 25 January 2011.
- ^ a b Eurostat - Total Population
- ^ Pan and Pfeil (2004), "Problems with Terminology", pp. xvii-xx.
See also
- Demography of Europe
- List of European Union member states by population
External links
Categories:- European Union-related lists
- Demographics by region
- Demographics of Europe
- European society


Wikimedia Foundation. 2010.