- Demographics of Italy
-
This article is about the demographic features of the population of Italy, including population density, ethnicity, education level, health of the populace, economic status, religious affiliations and other aspects of the population.
Historical populations Year Pop. ±% 1861 22,182,377 — 1871 27,303,509 +23.1% 1881 28,953,480 +6.0% 1901 32,965,504 +13.9% 1911 35,845,048 +8.7% 1921 39,943,528 +11.4% 1931 41,651,000 +4.3% 1936 42,943,602 +3.1% 1951 47,515,537 +10.6% 1961 50,623,569 +6.5% 1971 54,136,547 +6.9% 1981 56,556,911 +4.5% 1991 56,778,031 +0.4% 2001 56,995,744 +0.4% 2010 60,418,711 +6.0% Source: ISTAT 2001 Contents
Population
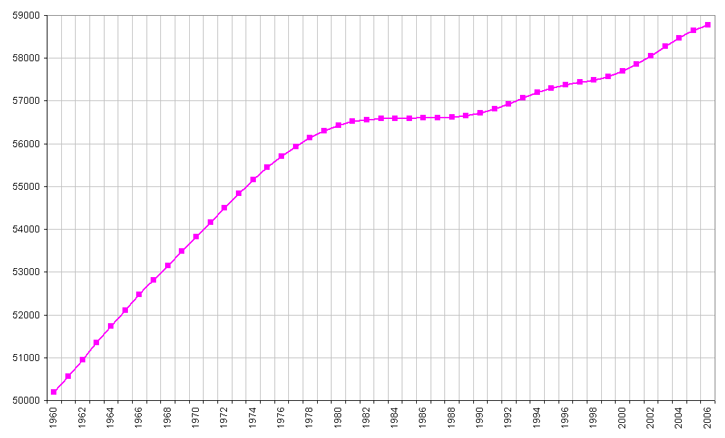
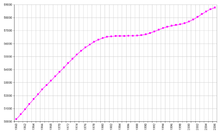 Population 1960–2006. Number of inhabitants in thousands.
With a population estimated in 60.6 million, Italy has the fourth-largest population in the European Union and the 23rd-largest population worldwide. The population density, at over 200 persons per square kilometer (over 500/sq mi), is the fifth highest in the European Union. The highest density is in Northern Italy, as that one-third of the country contains almost half of the total population.
After World War II, Italy enjoyed a prolonged economic boom which caused a major rural exodus to the cities,[citation needed] and at the same time transformed the nation from a massive emigration country till the 1970, to a net immigrant-receiving country from the mid 1980s.[1] High fertility persisted until the 1970s, when it plunged below the replacement rates, so that as of 2008, one in five Italians was over 65 years old.[2] Despite this, thanks mainly to the massive immigration of the last two decades, in the first decade of the 21st century, Italy experienced a growth in the crude birth rate (especially in the northern regions) for the first time in many years.[3] The total fertility rate has also significantly grown in the past few years, thanks to rising births among both in foreign-born and Italian women, as it climbed from an all-time minimum of 1.18 children per woman in 1995 to 1.41 in 2008.[4]
Cities and conurbations
Largest cities of Italy
ISTAT estimates for 31 December 2010Rank City Name Region Pop. Rank City Name Region Pop. 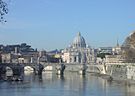
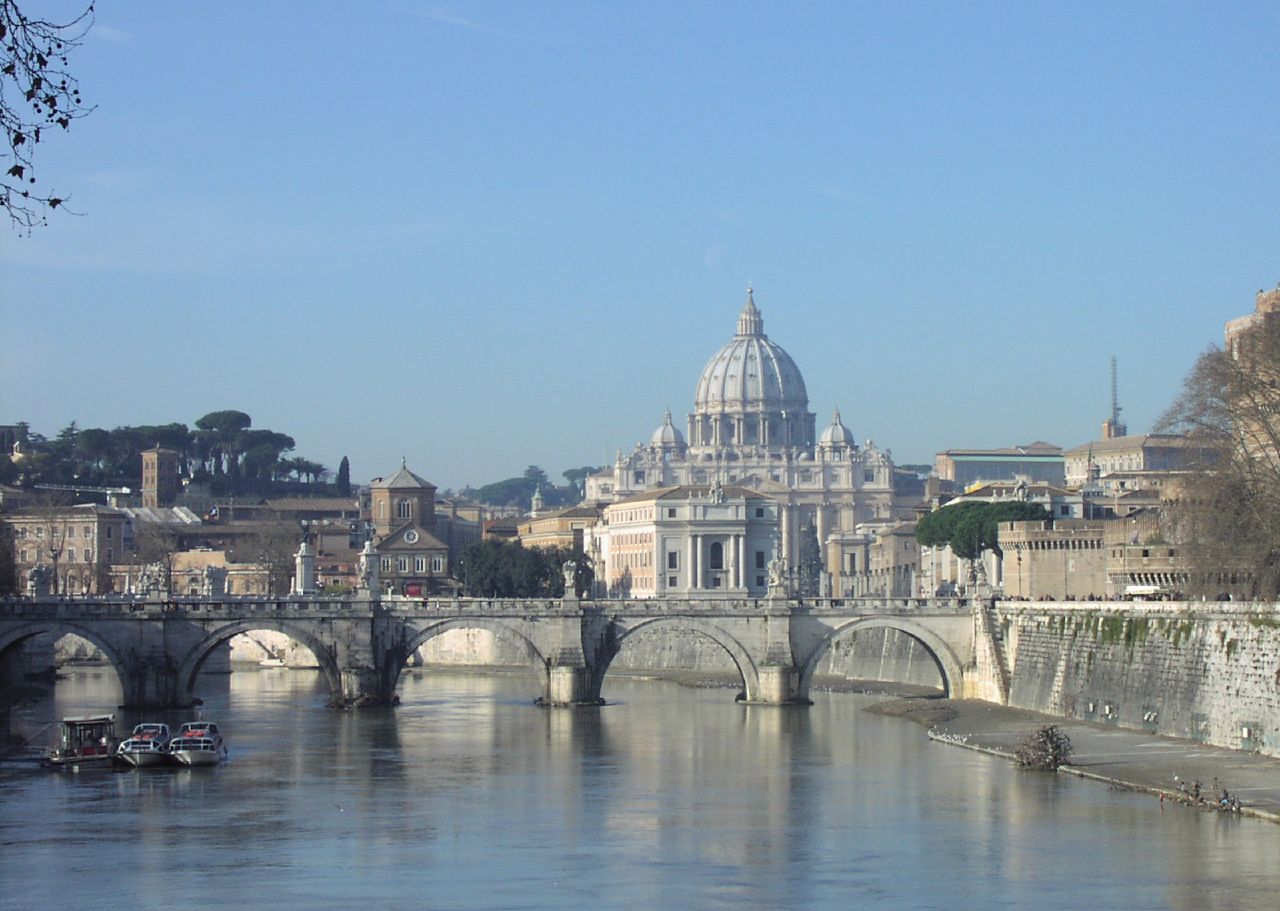
Rome
1 Rome Lazio 2,761,477 11 Venice Veneto 270,884 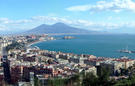
Naples
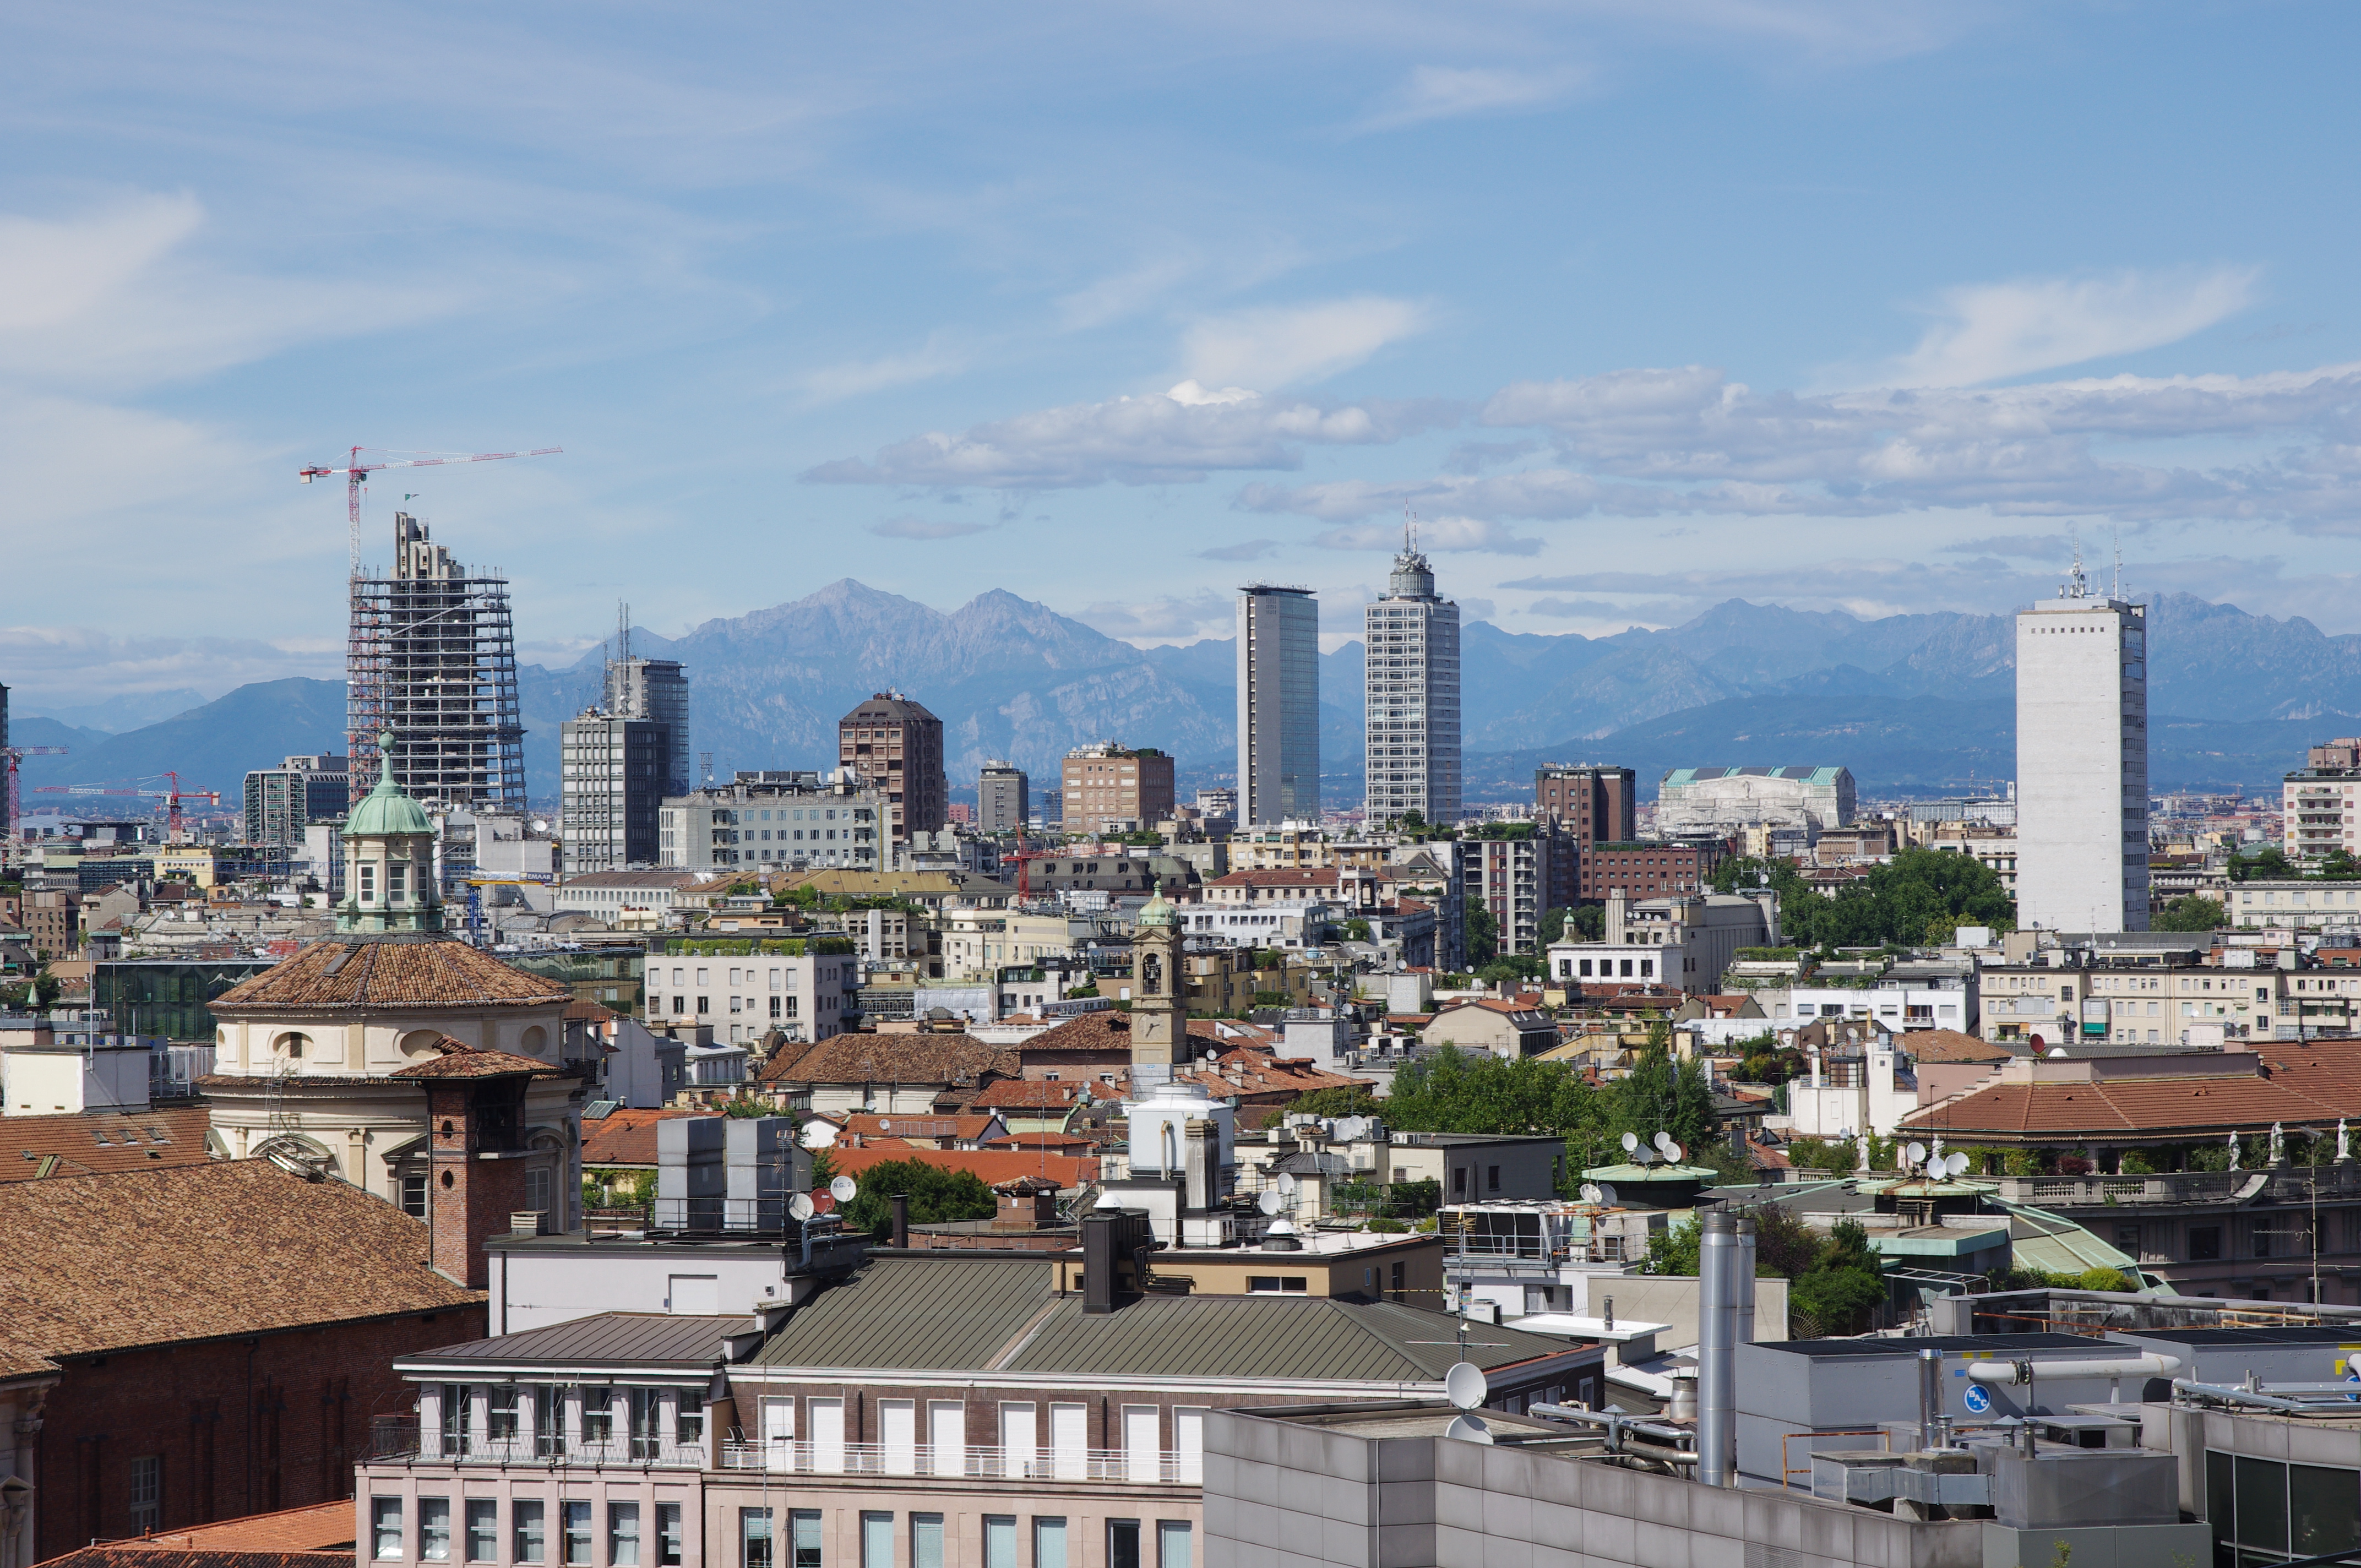
2 Milan Lombardy 1,324,110 12 Verona Veneto 263,964 3 Naples Campania 963,357 13 Messina Sicily 242,503 4 Turin Piedmont 907,563 14 Padua Veneto 214,198 5 Palermo Sicily 655,875 15 Trieste Friuli-Venezia Giulia 205,535 6 Genoa Liguria 607,906 16 Brescia Lombardy 193,879 7 Bologna Emilia-Romagna 380,181 17 Taranto Apulia 191,810 8 Florence Tuscany 371,282 18 Prato Tuscany 188,011 9 Bari Apulia 320,475 19 Parma Emilia-Romagna 186,690 10 Catania Sicily 293,458 20 Reggio Calabria Calabria 186,547 According to OECD,[5] The largest conurbations are:
Summary of vital statistics since 1900
The following statistics are drawn from B.R. Mitchell, United nations, and ISTAT.[6][7][8]
Average population (x 1000) Live births Deaths Natural change Crude birth rate (per 1000) Crude death rate (per 1000) Natural change (per 1000) 1900 32 377 1 067 376 768 917 298 459 33.0 23.7 9.2 1901 32 550 1 057 763 715 036 342 727 32.5 22.0 10.5 1902 32 787 1 093 074 727 181 365 893 33.3 22.2 11.2 1903 33 004 1 042 090 736 311 305 779 31.6 22.3 9.3 1904 33 237 1 085 431 698 604 386 827 32.7 21.0 11.6 1905 33 489 1 084 518 730 340 354 178 32.4 21.8 10.6 1906 33 718 1 070 978 696 875 374 103 31.8 20.7 11.1 1907 33 952 1 062 333 700 333 362 000 31.3 20.6 10.7 1908 34 198 1 138 813 770 054 368 759 33.3 22.5 10.8 1909 34 455 1 115 831 738 460 377 371 32.4 21.4 11.0 1910 34 751 1 144 410 682 459 461 951 32.9 19.6 13.3 1911 35 033 1 093 545 742 811 350 734 31.2 21.2 10.0 1912 35 246 1 133 985 635 788 498 197 32.2 18.0 14.1 1913 35 351 1 122 482 663 966 458 516 31.8 18.8 13.0 1914 35 701 1 114 091 643 355 470 736 31.2 18.0 13.2 1915 36 271 1 109 183 809 703 299 480 30.6 22.3 8.3 1916 36 481 881 626 854 703 26 923 24.2 23.4 0.7 1917 36 343 713 732 948 710 -234 978 19.6 26.1 -6.5 1918 35 922 655 353 1 268 290 -612 937 18.2 35.3 -17.1 1919 35 717 770 620 676 329 94 291 21.6 18.9 2.6 1920 35 960 1 158 041 681 749 476 292 32.2 19.0 13.2 1921 37 869 1 163 344 670 234 493 110 30.7 17.7 13.0 1922 38 196 1 175 834 690 054 485 780 30.8 18.1 12.7 1923 38 571 1 155 157 654 827 500 330 29.9 17.0 13.0 1924 38 927 1 124 650 663 077 461 573 28.9 17.0 11.9 1925 39 265 1 108 565 669 695 438 870 28.2 17.1 11.2 1926 39 590 1 094 666 680 274 414 392 27.7 17.2 10.5 1927 39 926 1 093 772 639 843 453 929 27.4 16.0 11.4 1928 40 281 1 072 316 645 654 426 662 26.6 16.0 10.6 1929 40 607 1 037 700 667 223 370 477 25.6 16.4 9.1 1930 40 956 1 092 678 576 751 515 927 26.7 14.1 12.6 1931 41 339 1 026 197 609 405 416 792 24.8 14.7 10.1 1932 41 584 990 995 610 646 380 349 23.8 14.7 9.1 1933 41 928 995 979 574 113 421 866 23.8 13.7 10.1 1934 42 277 992 966 563 339 429 627 23.5 13.3 10.2 1935 42 631 996 708 594 722 401 986 23.4 14.0 9.4 1936 42 965 962 686 593 380 369 306 22.4 13.8 8.6 1937 43 269 991 867 618 290 373 577 22.9 14.3 8.6 1938 43 596 1 037 180 614 988 422 192 23.8 14.1 9.7 1939 44 018 1 040 213 591 483 448 730 23.6 13.4 10.2 1940 44 467 1 046 479 606 907 439 572 23.5 13.6 9.9 1941 44 830 937 546 621 735 315 811 20.9 13.9 7.0 1942 45 098 926 063 643 607 282 456 20.5 14.3 6.3 1943 44 641 885 300 679 708 205 592 19.8 15.2 4.6 1944 44 794 817 704 685 171 132 533 18.3 15.3 3.0 1945 44 946 817 812 615 092 202 720 18.2 13.7 4.5 1946 45 253 1 039 432 547 952 491 480 23.0 12.1 10.9 1947 45 641 1 014 712 524 019 490 693 22.2 11.5 10.8 1948 46 381 1 009 299 490 450 518 849 21.8 10.6 11.2 1949 46 733 940 293 485 277 455 016 20.1 10.4 9.7 1950 47 104 911 805 455 169 456 636 19.4 9.7 9.7 1951 47 417 863 849 485 208 378 641 18.2 10.2 8.0 1952 47 666 847 354 477 894 369 460 17.8 10.0 7.8 1953 47 957 842 274 476 015 366 259 17.6 9.9 7.6 1954 48 299 870 689 441 897 428 792 18.0 9.1 8.9 1955 48 633 869 333 446 689 422 644 17.9 9.2 8.7 1956 48 920 873 608 497 550 376 058 17.9 10.2 7.7 1957 49 181 878 906 484 190 394 716 17.9 9.8 8.0 1958 49 475 870 468 457 690 412 778 17.6 9.3 8.3 1959 49 831 901 017 454 740 446 277 18.1 9.1 9.0 1960 50 198 910 192 480 932 429 260 18.1 9.6 8.6 1961 50 523 929 657 468 455 461 202 18.4 9.3 9.1 1962 50 843 937 257 509 174 428 083 18.4 10.0 8.4 1963 51 198 960 336 516 377 443 959 18.8 10.1 8.7 1964 51 600 1 016 120 490 050 526 070 19.7 9.5 10.2 1965 51 987 990 458 518 008 472 450 19.1 10.0 9.1 1966 52 332 979 940 496 281 483 659 18.7 9.5 9.2 1967 52 667 948 772 510 122 438 650 18.0 9.7 8.3 1968 52 987 930 172 532 571 397 601 17.6 10.1 7.5 1969 53 317 932 466 539 129 393 337 17.5 10.1 7.4 1970 53 661 901 472 521 096 380 376 16.8 9.7 7.1 1971 54 074 906 182 522 654 383 528 16.8 9.7 7.1 1972 54 381 888 203 523 828 364 375 16.3 9.6 6.7 1973 54 751 874 546 547 487 327 059 16.0 10.0 6.0 1974 55 111 868 882 532 052 336 830 15.8 9.7 6.1 1975 55 441 827 852 554 346 273 506 14.9 10.0 4.9 1976 55 718 781 638 550 565 231 073 14.0 9.9 4.1 1977 55 955 741 103 546 694 194 409 13.2 9.8 3.5 1978 56 155 709 043 540 671 168 372 12.6 9.6 3.0 1979 56 318 670 221 538 352 131 869 11.9 9.6 2.3 1980 56 434 640 401 554 510 85 891 11.3 9.8 1.5 1981 56 502 623 103 545 291 77 812 11.0 9.7 1.4 1982 56 544 617 507 522 332 95 175 10.9 9.2 1.7 1983 56 564 600 218 553 568 46 650 10.6 9.8 0.8 1984 56 577 587 871 534 676 53 195 10.4 9.5 0.9 1985 56 593 577 345 547 436 29 909 10.2 9.7 0.5 1986 56 596 554 845 537 453 17 392 9.8 9.5 0.3 1987 56 602 552 329 524 999 27 330 9.8 9.3 0.5 1988 56 629 569 698 539 426 30 272 10.1 9.5 0.5 1989 56 672 560 688 525 960 34 728 9.8 9.3 0.5 1990 56 719 563 019 543 708 19 311 9.9 9.5 0.5 1991 56 751 562 787 553 833 8 954 9.9 9.8 0.2 1992 56 797 575 216 545 038 30 178 10.1 9.6 0.5 1993 56 832 552 587 555 043 -2 456 9.7 9.8 -0.0 1994 56 843 536 665 557 513 -20 848 9.4 9.8 -0.4 1995 56 844 526 064 555 203 -29 139 9.3 9.8 -0.5 1996 56 860 536 740 557 756 -21 016 9.4 9.8 -0.4 1997 56 890 540 048 564 679 -24 631 9.5 9.9 -0.4 1998 56 907 532 843 576 911 -44 068 9.4 10.1 -0.8 1999 56 917 537 242 571 356 -34 114 9.4 10.0 -0.6 2000 56 942 543 039 560 241 -17 202 9.5 9.8 -0.3 2001 56 977 535 264 548 227 -12 963 9.4 9.6 -0.2 2002 57 158 538 198 557 393 -19 195 9.4 9.8 -0.3 2003 57 605 544 063 588 897 -44 834 9.4 10.2 -0.8 2004 58 175 562 599 545 050 17 549 9.7 9.4 0.3 2005 58 607 554 022 568 328 -14 306 9.5 9.7 -0.2 2006 58 942 560 010 560 875 - 865 9.5 9.5 -0.0 2007 59 375 563 933 573 026 -9 093 9.5 9.7 -0.2 2008 59 832 576 659 585 126 -8 467 9.6 9.8 -0.1 2009 60 193 568 857 591 663 -22 806 9.5 9.8 -0.4 2010 60 626 561 944 587 488 -25 544 - - - Migration
See also: Immigration to ItalyItaly became a country of mass emigration soon after national reunification in the late 19th century. Between 1898 and 1914, the peak years of Italian diaspora, approximately 750,000 Italians emigrated each year.[9] Italian communities once thrived in the former African colonies of Eritrea (nearly 100,000 at the beginning of World War II),[10] Somalia and Libya (150,000 Italians settled in Libya, constituting about 18% of the total population).[11] All of Libya's Italians were expelled from the North African country in 1970.[12]
In the decade after World War II, up to 350,000 ethnic Italians left Yugoslavia (see Istrian exodus).[13] Large numbers of people with full or significant Italian ancestry are found in Brazil (25 million),[14] Argentina (20 million),[15] United States (17.8 million),[16] France (5 million),[17] Uruguay (1.5 million),[18] Canada (1.4 million),[19] Venezuela (900,000)[20] and Australia (800,000).[21]
 Estimated foreign-born population by country of birth, 2006 figures.
At the start of 2010 there were 4,279,000 foreign nationals resident in Italy and registered with the authorities.[22] This amounted to 7.1% of the country’s population and represented a year-on-year increase of 388,000.[23] These figures include more than half a million children born in Italy to foreign nationals—second generation immigrants are becoming an important element in the demographic picture—but exclude foreign nationals who have subsequently acquired Italian nationality; this applied to 53,696 people in 2008.[24] They also exclude illegal immigrants, the so-called clandestini whose numbers are difficult to determine. In May 2008 The Boston Globe quoted an estimate of 670,000 for this group.[25]
Since the expansion of the European Union, the most recent wave of migration has been from surrounding European nations, particularly Eastern Europe, and increasingly Asia,[26] replacing North Africa as the major immigration area. Some 997,000 Romanians,[27] around 10 percent of them being Romanis,[28] are officially registered as living in Italy, replacing Albanians and Moroccans as the largest ethnic minority group.
As of 2009, the foreign born population origin of Italy was subdivided as follows: Europe (53.5%), Africa (22.3%), Asia (15.8%), the Americas (8.1%) and Oceania (0.06%). The distribution of foreign born population is largely uneven in Italy: 87.3% of immigrants live in the northern and central parts of the country (the most economically developed areas), while only 12.8% live in the southern half of the peninsula.
According to Eurostat, in 2010 there were 4.8 million foreign-born residents in Italy, corresponding to 8.0% of the total population. Of these, 3.2 million (5.3%) were born outside the EU and 1.6 million (2.6%) were born in another EU Member State.[29]
Population of Italy by nationality as of 1 January 2011 Nationality Population Percent Italian 56,358,000 92.90% Romanian 997,000 1.98% North African 800,000 1.32% Albanian 500,000 0.83% Sub-Saharan Africa 307,000 0.36% Ukrainian 180,000 0.30% Asian (non-Chinese, Including Indians and Pakistanis) 500,000 0.82% Chinesen 209,000 0.35% Latin Americann 200,000 0.33% Other (Mainly from other European nations and the Middle East) 710,000 1.17% Languages
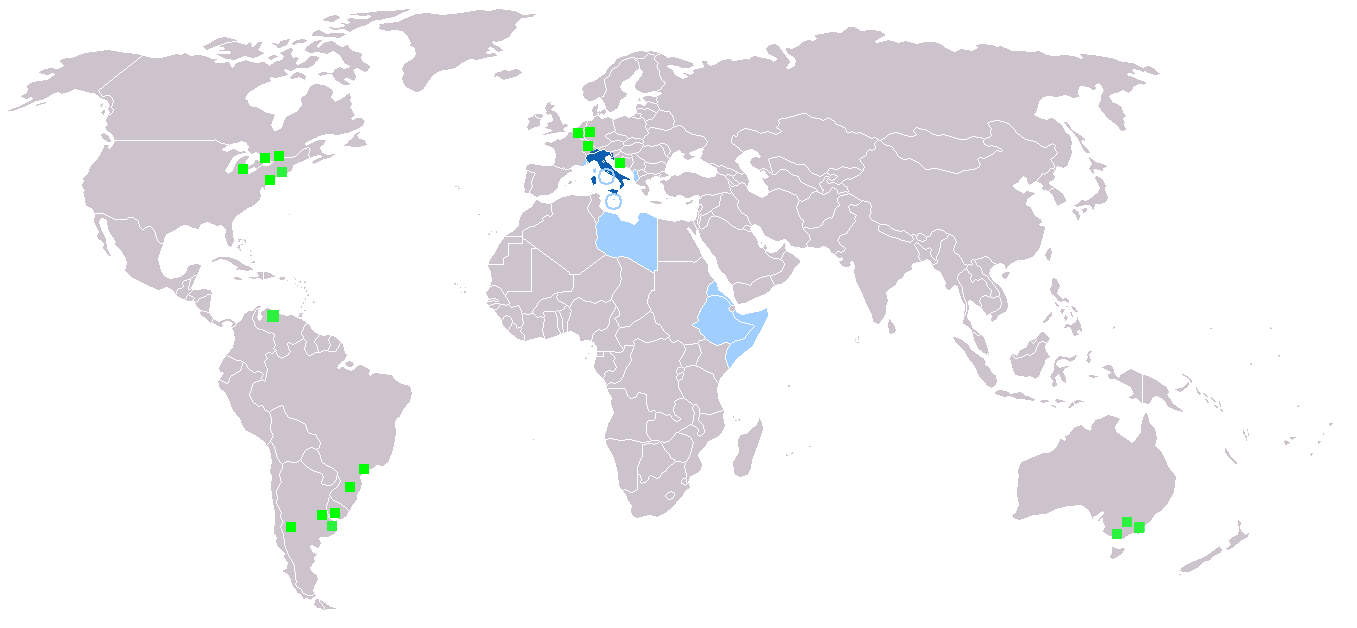
 "Italophone" world. Dark blue:official language; green: secondary, widely spoken or understood; light blue: understood by some due to former colonisation.
Italy's official language is Italian. Ethnologue has estimated that there are about 55 million speakers of the language in Italy and a further 6.7 million outside of the country.[30] However, between 120 and 150 million people use Italian as a second or cultural language, worldwide.[31]
Italian, adopted by the state after the unification of Italy, is based on the Florentine variety of Tuscan and is somewhat intermediate between the Italo-Dalmatian languages and the Gallo-Romance languages. Its development was also influenced by the Germanic languages of the post-Roman invaders.
Italy has numerous dialects spoken all over the country. However, the establishment of a national education system has led to decrease in variation in the languages spoken across the country. Standardisation was further expanded in the 1950s and 1960s thanks to economic growth and the rise of mass media and television (the state broadcaster RAI helped set a standard Italian).
Several ethnic groups are legally recognized,[32] and a number of minority languages have co-official status alongside Italian in various parts of the country. French is co-official in the Valle d’Aosta—although in fact Franco-Provencal is more commonly spoken there. German has the same status in the province of South Tyrol as, in some parts of that province and in parts of the neighbouring Trentino, does Ladin. Slovene is officially recognised in the provinces of Trieste, Gorizia and Udine in Venezia Giulia.
In these regions official documents are bilingual (trilingual in Ladin communities), or available upon request in either Italian or the co-official language. Traffic signs are also multilingual, except in the Valle d’Aosta where—with the exception of Aosta itself which has retained its Latin form in Italian as in English—French toponyms are generally used, attempts to Italianise them during the Fascist period having been abandoned. Education is possible in minority languages where such schools are operating.
Religion
Roman Catholicism is by far the largest religion in the country, although the Catholic Church is no longer officially the state religion. Fully 87.8% of Italy's population identified themselves as Roman Catholic,[33] although only about one-third of these described themselves as active members (36.8%).
Most Italians believe in God, or a form of a spiritual life force. According to the most recent Eurobarometer Poll 2005:[34] 74% of Italian citizens responded that 'they believe there is a God', 16% answered that 'they believe there is some sort of spirit or life force' and 6% answered that 'they do not believe there is any sort of spirit, God, or life force'.
Christianity
The Italian Catholic Church is part of the global Roman Catholic Church, under the leadership of the Pope, curia in Rome, and the Conference of Italian Bishops. In addition to Italy, two other sovereign nations are included in Italian-based dioceses, San Marino and Vatican City. There are 225 dioceses in the Italian Catholic Church, see further in this article and in the article List of the Roman Catholic dioceses in Italy. Even though by law Vatican City is not part of Italy, it is in Rome, and along with Latin, Italian is the most spoken and second language of the Roman Curia.[37]
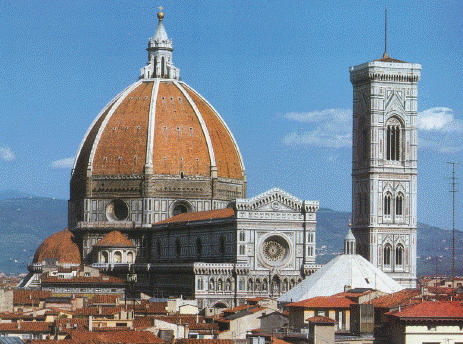
Italy has a rich Catholic culture, especially as numerous Catholic saints, martyrs and popes were Italian themselves. Roman Catholic art in Italy especially flourished during the Middle-Ages, Renaissance and Baroque periods, with numerous Italian artists, such as Michelangelo, Leonardo Da Vinci, Raphael, Caravaggio, Fra Angelico, Gian Lorenzo Bernini, Sandro Botticelli, Tintoretto, Titian, Raphael and Giotto. Roman Catholic architecture in Italy is equally as rich and impressive, with churches, basilicas and cathedrals such as St Peter's Basilica, Florence Cathedral and St Mark's Basilica. Roman Catholicism is the largest religion and denomination in Italy, with around 87.8% of Italians considering themselves Catholic. Italy is also home to the greatest number of cardinals in the world,[38] and is the country with the greatest number of Roman Catholic churches per capita.[39]
Even though the main Christian denomination in Italy is Roman Catholicism, there are some minorities of Protestant, Waldensian, Eastern Orthodox and other Christian churches.
In the 20th century, Jehovah's Witnesses, Pentecostalism, non-denominational Evangelicalism, and Mormonism were the fastest-growing Protestant churches. Immigration from Western, Central, and Eastern Africa at the beginning of the 21st century has increased the size of Baptist, Anglican, Pentecostal and Evangelical communities in Italy, while immigration from Eastern Europe has produced large Eastern Orthodox communities.
In 2006, Protestants made up 2.1% of Italy's population, and members of Eastern Orthodox churches comprised 1.2%. Other Christian groups in Italy include more than 700,000 Eastern Orthodox Christians including 180,000 Greek Orthodox,[40] 550,000 Pentecostals and Evangelists (0.8%), of whom 400,000 are members of the Assemblies of God, 235,685 Jehovah's Witnesses (0.4%),[41] 30,000 Waldensians,[42] 25,000 Seventh-day Adventists, 22,000 Mormons, 15,000 Baptists (plus some 5,000 Free Baptists), 7,000 Lutherans, 4,000 Methodists (affiliated with the Waldensian Church).[43]
Other religions
The longest-established religious faith in Italy is Judaism, Jews having been present in Ancient Rome before the birth of Christ. Italy has seen many influential Italian-Jews, such as Luigi Luzzatti, who took office in 1910, Ernesto Nathan served as mayor of Rome from 1907 to 1913 and Shabbethai Donnolo (died 982). During the Holocaust, Italy took in many Jewish refugees from Nazi Germany. However, with the creation of the Nazi-backed puppet Italian Social Republic, about 15% of Italy's Jews were killed, despite the Fascist government's refusal to deport Jews to Nazi death camps. This, together with the emigration that preceded and followed the Second World War, has left only a small community of around 45,000 Jews in Italy today.
Due to immigration from around the world, there has been an increase in non-Christian faiths. In 2009, there were 1.0 million Muslims in Italy[44] forming 1.6 percent of population although, only 50,000 hold Italian citizenship. Independent estimates put the Islamic population in Italy anywhere from 0.8 million[45] to 1.5 million.[46]
There are more than 200,000 followers of faith originating in the Indian subcontinent woth some 70,000 Sikhs with 22 gurdwaras across the country,[47] 70,000 Hindus, and 50,000 Buddhists.[48] There are an estimated some 4,900 Bahá'ís in Italy in 2005.[49]
Demographic statistics from the CIA World Factbook
The following demographic statistics are from the CIA World Factbook, unless otherwise indicated.
Population estimate
- 60,418,711 (Istat, April 2010 est.)[1]
Age structure
- 0-14 years: 13.5% (male 4,056,156/female 3,814,070)
- 15-64 years: 66.3% (male 19,530,696/female 18,981,084)
- 65 years and over: 20.2% (male 4,903,762/female 6,840,444) (2010 est.)
Sex ratio
- at birth: 1.07 male(s)/female
- under 15 years: 1.06 male(s)/female
- 15-64 years: 1.02 male(s)/female
- 65 years and over: 0.72 male(s)/female
- total population: 0.96 male(s)/female
(2004 est.)
Infant mortality rate
- total: 5.51 deaths/1,000 live births
- male: 6.07 deaths/1,000 live births
- female: 4.91 deaths/1,000 live births
(2009 est.)
Total fertility rate
- 1.41 children born/woman (Istat 2009 est.)[2]
Life expectancy at birth
- total population: 80.2 years woman and men 85 years (2009 est.)
HIV/AIDS
- Adult prevalence rate: 0.4% (2009 est.)
- People living with HIV/AIDS: 150,000 (2007 est.)
- Deaths: 1,900 (2007 est.)
Nationality
- noun: Italian(s)
- adjective: Italian
Ethnic groups
Italian: 92.5%, other European (mostly Albanian, Romanian, Ukrainian and others) 4%, North African (mostly Berber) 1%, others 2.5%[50]
Religions
Roman Catholic: 87% (approximately; one third practicing), other Christians: 2%, Muslim: 1.8%, Atheist or Agnostic: 9%
Literacy
- definition: age 15 and over can read and write
- total population: 98.6%
- male:
(2003 est.)
Genetics
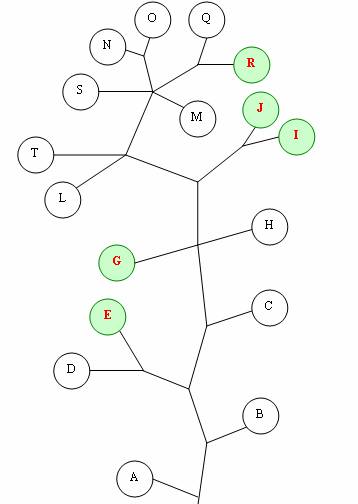
 Genealogical tree of Y chromosome haplogroups with main Italian ones highlighted in green
In a very recent and thorough study (2007) which analysed 699 Italian individuals from 12 different regions in continental Italy,[51] the most common Y-dna haplogroups observed were :
- R1 (42.8% : 40% R1b and 2.8% R1a)
- J (22 % : 20% J2 and 2% J1)
- E1b1b (12.6 %)
- G (10.8 %)
- I (7.5 %)
- K (3.7%)
See also
References
- ^ Ginsborg (2003) pp.62, 176 quote:
(p.62) 10. Immigration and Racism At the beginning of the 1980s modern Italy reached another watershed; it ceased to be a net exporter of labor, and began to welcome, though that is hardly the correct verb, a significant number of non-European and east Europea immigrants, known as 'extracomunitary', a peculiar Italian label which in technical terms described immigrants from countries not belonging to the European Community, but which also had strong ovetones of exclusion, of describing those who lay outside of the national community.
(p.176) The 'terroni', the southerners who had 'invaded' the North in such massive numbers during the 'economic miracle', would do well to go back to were they come from.129 Even less welcome were the extracomunitari (and how perfectly that word fitted the [Lega Nord] League's view of them!), who began to arrive in the North in small but significan numbers in the mid-1980s. - ^ EUROSTAT. "Ageing characterises the demographic perspectives of the European societies - Issue number 72/2008". http://epp.eurostat.ec.europa.eu/cache/ITY_OFFPUB/KS-SF-08-072/EN/KS-SF-08-072-EN.PDF. Retrieved 28 April 2009.
- ^ (Italian) ISTAT. "Crude birth rates, mortality rates and marriage rates 2005-2008". http://demo.istat.it/altridati/indicatori/2008/Tab_1.pdf. Retrieved 10 May 2009.
- ^ (Italian) ISTAT. "Average number of children born per woman 2005-2008". http://demo.istat.it/altridati/indicatori/2008/Tab_4.pdf. Retrieved 3 May 2009.
- ^ OECD. "Competitive Cities in the Global Economy" (PDF). http://213.253.134.43/oecd/pdfs/browseit/0406041E.PDF. Retrieved 2009-04-30.
- ^ B.R. Mitchell. European historical statistics, 1750-1975.
- ^ http://unstats.un.org/unsd/demographic/products/dyb/dybsets/1948%20DYB.pdf United nations. Demographic Yearbook 1948
- ^ ISTAT
- ^ Causes of the Italian mass emigration
- ^ Essay on Italian emigration to Eritrea (in Italian)
- ^ Libya - Italian colonization. Britannica Online Encyclopedia.
- ^ Libya cuts ties to mark Italy era.. BBC News. 27 October 2005.
- ^ Election Opens Old Wounds In Trieste. The New York Times. 6 June 1987.
- ^ Consulta Nazionale Emigrazione. Progetto ITENETs – “Gli italiani in Brasile”; pp. 11, 19 . Retrieved 10 September 2008.
- ^ (Spanish) Lee, Adam (3 April 2006). "Unos 20 millones de personas que viven en la Argentina tienen algún grado de descendencia italiana" (in Spanish). http://www.asteriscos.tv/dossier-3.html. Retrieved 27 June 2008.
- ^ U.S Census Bureau - Selected Population Profile in the United States
- ^ "The Cambridge survey of world migration". Robin Cohen (1995). Cambridge University Press. p.143. ISBN 0-521-44405-5
- ^ "Ethnic origins, 2006 counts, for Uruguay, provinces and territories - 20% sample data". http://www.hotelsclick.com/hoteles/UY/Uruguay-DEMOGRAF%C3%ADA-5.html.
- ^ "Ethnic origins, 2006 counts, for Canada, provinces and territories - 20% sample data". http://www12.statcan.ca/english/census06/data/highlights/ethnic/pages/Page.cfm?Lang=E&Geo=PR&Code=01&Data=Count&Table=2&StartRec=1&Sort=3&Display=All&CSDFilter=5000.
- ^ Santander Laya-Garrido, Alfonso. Los Italianos forjadores de la nacionalidad y del desarrollo economico en Venezuela. Editorial Vadell. Valencia, 1978
- ^ "20680-Ancestry by Country of Birth of Parents - Time Series Statistics (2001, 2006 Census Years) - Australia". Australian Bureau of Statistics. 27 June 2007. http://www.censusdata.abs.gov.au/ABSNavigation/prenav/ViewData?action=404&documentproductno=0&documenttype=Details&order=1&tabname=Details&areacode=0&issue=2006&producttype=Census%20Tables&javascript=true&textversion=false&navmapdisplayed=true&breadcrumb=LPTD&&collection=Census&period=2006&productlabel=Ancestry%20by%20Country%20of%20Birth%20of%20Parents%20-%20Time%20Series%20Statistics%20(2001,%202006%20Census%20Years)&producttype=Census%20Tables&method=Place%20of%20Usual%20Residence&topic=Ancestry&. Retrieved 30 December 2008.
- ^ "Istat: Population of immigrants is 4,3 million". Africa News. 5 March 2010.
- ^ "Italy wakes up to the realities of immigration". The Guardian. 21 February 2010.
- ^ "La popolazione straniera residente in Italia al 1° gennaio 2009 [The Foreign Poulation Resident in Italy on 1 January 2009]" (in Italian) (PDF). Istat. 8 October 2009. pp. 1–3. http://www.istat.it/salastampa/comunicati/non_calendario/20091008_00/testointegrale20091008.pdf. Retrieved 27 October 2009.
- ^ Elisabeth Rosenthal, "Italy cracks down on illegal immigration". The Boston Globe. 16 May 2008.
- ^ "Milan police in Chinatown clash". BBC News. 13 April 2007.
- ^ ISTAT - Istituto Nazionale di Statistica Indicatori demografici (1° gennaio 2011)
- ^ "EUROPE: Home to Roma, And No Place for Them". IPS ipsnews.net.
- ^ 6.5% of the EU population are foreigners and 9.4% are born abroad, Eurostat, Katya VASILEVA, 34/2011.
- ^ Ethnologue report for language code:ita (Italy) - Gordon, Raymond G., Jr. (ed.), 2005. Ethnologue: Languages of the World, Fifteenth edition. Dallas, Tex.: SIL International. Online version
- ^ Italian Language: Geographic Distribution Discovery Media'.' Retrieved 2010-05-16.
- ^ [L.cost. 26 febbraio 1948, n. 4, Statuto speciale per la Valle d'Aosta; L.cost. 26 febbraio 1948, n. 5, Statuto speciale per il Trentino-Alto Adige; L.cost. 31 gennaio 1963, n. 1, Statuto speciale della Regione Friuli Venezia Giulia]
- ^ (Italian) "Italy: 88% of Italy's population declare themselves Catholic". Corriere della Sera. 18 January 2006. http://www.corriere.it/Primo_Piano/Cronache/2006/01_Gennaio/17/cattolici.shtml. Retrieved 10 May 2009.
- ^ ReportDGResearchSocialValuesEN2.PDF
- ^ "The Duomo of Florence | Tripleman". www.tripleman.com. http://www.tripleman.com/index.php?showimage=737. Retrieved 2010-03-25.
- ^ "brunelleschi's dome - Brunelleschi's Dome". Brunelleschisdome.com. http://www.brunelleschisdome.com/. Retrieved 2010-03-25.
- ^ "Country profile: Vatican". BBC News. 26 October 2009. http://news.bbc.co.uk/1/hi/world/europe/country_profiles/1066140.stm. Retrieved 5 May 2010.
- ^ The Cardinals of the Holy Roman Church - Living cardinals arranged by country
- ^ "Italy - Italian Language, Culture, Customs and Business Etiquette". Kwintessential.co.uk. http://www.kwintessential.co.uk/resources/global-etiquette/italy-country-profile.html. Retrieved 2010-08-02.
- ^ The Holy Orthodox Archdiocese of Italy and Malta
- ^ (Italian) Center for Studies on New Religions
- ^ (Italian) Waldensian Evangelical Church
- ^ World Council of Churches
- ^ Italy: Country's muslims raise funds to help quake victims - Adnkronos Religion
- ^ "Muslims in Europe: Country guide". BBC News. 23 December 2005. http://news.bbc.co.uk/2/hi/europe/4385768.stm. Retrieved 5 May 2010.
- ^ Rosenthal, Elisabeth (25 July 2005). "Pressure is growingon Muslims in Italy". The New York Times. http://www.nytimes.com/2005/07/24/world/europe/24iht-rome.html?_r=1. Retrieved 31 March 2010.
- ^ NRI Sikhs in Italy
- ^ Unione Buddhista Italiana - UBI: L'Ente
- ^ "Most Baha'i Nations (2005)". QuickLists > Compare Nations > Religions >. The Association of Religion Data Archives. 2005. http://www.thearda.com/QuickLists/QuickList_40c.asp. Retrieved 2010-01-30.
- ^ Statistiche demografiche ISTAT
- ^ Y chromosome genetic variation in the Italian peninsula is clinal and supports an admixture model for the Mesolithic-Neolithic encounter, Capelli et al. 2007
External links
- Demographic page (English)
- Demographic Profile Italy Allianz Knowledge
Demographics of Europe Sovereign
states- Albania
- Andorra
- Armenia
- Austria
- Azerbaijan
- Belarus
- Belgium
- Bosnia and Herzegovina
- Bulgaria
- Croatia
- Cyprus
- Czech Republic
- Denmark
- Estonia
- Finland
- France
- Georgia
- Germany
- Greece
- Hungary
- Iceland
- Ireland
- Italy
- Kazakhstan
- Latvia
- Liechtenstein
- Lithuania
- Luxembourg
- Macedonia
- Malta
- Moldova
- Monaco
- Montenegro
- Netherlands
- Norway
- Poland
- Portugal
- Romania
- Russia
- San Marino
- Serbia
- Slovakia
- Slovenia
- Spain
- Sweden
- Switzerland
- Turkey
- Ukraine
- United Kingdom
- (England
- Northern Ireland
- Scotland
- Wales)
- Vatican City
States with limited
recognition- Abkhazia
- Kosovo
- Nagorno-Karabakh
- Northern Cyprus
- South Ossetia
- Transnistria
Dependencies
and other territories- Åland
- Faroe Islands
- Gibraltar
- Guernsey
- Jan Mayen
- Jersey
- Isle of Man
- Svalbard
Other entities - European Union
Categories:


Wikimedia Foundation. 2010.