- Total fertility rate
-
Not to be confused with birth rate.
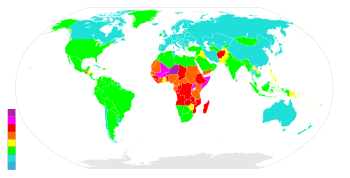 A world map showing countries by fertility rate, 2005-2010.
 7-8 Children6-7 Children5-6 Children4-5 Children3-4 Children2-3 Children1-2 Children0-1 Children
The total fertility rate (TFR, sometimes also called the fertility rate, period total fertility rate (PTFR) or total period fertility rate (TPFR)) of a population is the average number of children that would be born to a woman over her lifetime if (1) she were to experience the exact current age-specific fertility rates (ASFRs) through her lifetime, and (2) she were to survive from birth through the end of her reproductive life.[1] It is obtained by summing the single-year age-specific rates at a given time.
Contents
Parameter characteristics
World historical and predicted total fertility rates (1950–2100)
UN, medium variant, 2010 rev.[2]Years TFR Years TFR Years TFR 1950–1955 4.95 2000–2005 2.62 2050–2055 1.61 1955–1960 4.89 2005–2010 2.52 2055–2060 1.54 1960–1965 4.91 2010–2015 2.34 2060–2065 1.47 1965–1970 4.85 2015–2020 2.19 2065–2070 1.38 1970–1975 4.45 2020–2025 2.10 2070–2075 1.32 1975–1980 3.84 2025–2030 2.02 2075–2080 1.26 1980–1985 3.59 2030–2035 1.95 2080–2085 1.25 1985–1990 3.39 2035–2040 1.82 2085–2090 1.24 1990–1995 3.04 2040–2045 1.74 2090–2095 1.24 1995–2000 2.79 2045–2050 1.67 2095–2100 1.23 The TFR is a synthetic rate, not based on the fertility of any real group of women since this would involve waiting until they had completed childbearing. Nor is it based on counting up the total number of children actually born over their lifetime. Instead, the TFR is based on the age-specific fertility rates of women in their "child-bearing years," which in conventional international statistical usage is ages 15–44 or 15-49.[3]
The TFR is, therefore, a measure of the fertility of an imaginary woman who passes through her reproductive life subject to all the age-specific fertility rates for ages 15–49 that were recorded for a given population in a given year. The TFR represents the average number of children a woman would have were she to fast-forward through all her childbearing years in a single year, under all the age-specific fertility rates for that year. In other words, this rate is the number of children a woman would have if she was subject to prevailing fertility rates at all ages from a single given year, and survives throughout all her childbearing years.
Related parameters
Net reproduction rate
An alternative fertility measure is the net reproduction rate (NRR), which measures the number of daughters a woman would have in her lifetime if she were subject to prevailing age-specific fertility and mortality rates in the given year. When the NRR is exactly one, then each generation of women is exactly reproducing itself. The NRR is less widely used than the TFR, and the United Nations stopped reporting NRR data for member nations after 1998. But the NRR is particularly relevant where the number of male babies born is very high – see gender imbalance and sex selection. This is a significant factor in world population, due to the high level of gender imbalance in the very populous nations of China and India. The gross reproduction rate (GRR), is the same as the NRR, except that - like the TFR - it ignores life expectancy.
Total period fertility rate
The TFR (or TPFR—total period fertility rate) is a better index of fertility than the Crude birth rate (annual number of births per thousand population) because it is independent of the age structure of the population, but it is a poorer estimate of actual completed family size than the total cohort fertility rate, which is obtained by summing the age-specific fertility rates that actually applied to each cohort as they aged through time. In particular, the TFR does not necessarily predict how many children young women now will eventually have, as their fertility rates in years to come may change from those of older women now. However, the TFR is a reasonable summary of current fertility levels.
Tempo effect
Further information: Sub-replacement fertility#Tempo effectThe TPFR (total period fertility rate) is affected by a tempo effect – if age of childbearing increases (and life cycle fertility in unchanged) then while the age of childbearing is increasing, TPFR will be lower (because the births are occurring later), and then the age of childbearing stops increasing, the TPFR will increase (due to the deferred births occurring in the later period) even though the life cycle fertility has been unchanged. In other words, the TPFR is a misleading measure of life cycle fertility when childbearing age is changing, due to this statistical artifact. This is a significant factor in some countries, such as the Czech republic and Spain in the 1990s. Some measures seek to adjust for this timing effect to gain a better measure of life cycle fertility.
Replacement rates
 Graph of Total Fertility Rates vs. GDP per capita of the corresponding country, 2009. Only countries with over 5 million population were plotted to reduce outliers. Sources: CIA World Fact Book
Replacement fertility is the total fertility rate at which newborn girls would have an average of exactly one daughter over their lifetimes. That is, women have just enough female babies to replace themselves (or, equivalently, adults have just enough total babies to replace themselves).
If there were no mortality in the female population until the end of the childbearing years (generally taken as 44 or 49, though some exceptions exist) then the replacement level of TFR would be very close to 2.0 (actually slightly higher because of the excess of boy over girl births in human populations). However, the replacement level is also affected by mortality, especially childhood mortality. The replacement fertility rate is roughly 2.1 births per woman for most industrialized countries (2.075 in the UK for example), but ranges from 2.5 to 3.3 in developing countries because of higher mortality rates.[4] Taken globally, the total fertility rate at replacement is 2.33 children per woman. At this rate, global population growth would trend towards zero.
Population-lag effect
A population that maintained a TFR of 3.8 over an extended period of time without a correspondingly high death or emigration rate would increase rapidly, whereas a population that maintained a TFR of 2.0 over a long time would decline (unless it had a large enough immigration). However, it may take several generations for a change in the total fertility rate to be reflected in birth rate, because the age distribution must reach equilibrium. For example, a population that has recently dropped below replacement-level fertility will continue to grow, because the recent high fertility produced large numbers of young couples who would now be in their child-bearing years. This phenomenon carries forward for several generations and is called population momentum or population-lag effect. This time-lag effect is of great importance to the growth rates of human populations.
By region
Developed or developing countries
Developed countries usually have a much lower fertility rate due to greater wealth, education, and urbanization. Mortality rates are low, birth control is understood and easily accessible, and costs are often deemed very high because of education, clothing, feeding, and social amenities. With wealth, contraception becomes affordable. However, in countries like Iran where contraception was made artificially affordable before the economy accelerated, birth rate also rapidly declined. Further, longer periods of time spent getting higher education often mean women have children later in life. The result is the demographic-economic paradox. Female labor participation rate also has substantial negative impact on fertility. However, this effect is neutralized among Nordic or liberalist countries.[5]
In undeveloped countries on the other hand, families desire children for their labour and as caregivers for their parents in old age. Fertility rates are also higher due to the lack of access to contraceptives, generally lower levels of female education, and lower rates of female employment in industry.
Period U.S. Total
Fertility
Rate[6]1930–34 2.1 1935–39 2.0 1940–44 2.5 1945–49 3.0 1950–54 3.3 1955–59 3.7 1960–64 3.4 1965–69 2.6 1970–74 2.1 1975–79 1.8 United States
The total fertility rate in the United States after World War II peaked at about 3.8 children per woman in the late 1950s and by 1999 was at 2 children. This means that an imaginary woman (defined in the introduction) who fast-forwarded through her life in the late 1950s would have been expected to have about four children, whereas an imaginary woman who fast-forwarded through her life in 1999 would have been expected to have only about two children in her lifetime. The fertility rate of the total U.S. population is at around the replacement level of about 2.1 children per woman. However, the fertility of the population of the United States is below replacement among those native born, and above replacement among immigrant families, most of whom come to the U.S. from countries with higher fertility than that of the U.S.[citation needed] However, the fertility rates of immigrants to the U.S. have been found to decrease sharply in the second generation, correlating with improved education and income.[7]
According to a thesis submitted in 2005 to the Office of Graduate Studies of Texas A&M University, the lowest TFR recorded anywhere in the world in recorded history is for Xiangyang district of Jiamusi city (Heilongjiang, China) which had a TFR of 0.41.[8] Outside China, the lowest TFR ever recorded was 0.80 for Eastern Germany in 1994.
Europe
The average total fertility rate in Europe has been estimated to be 1.6 children per woman as of 2008.
Factors
Further information: Sub-replacement fertilityA systematic review of European fertility rates came to the result that European fertility rates do not seem to decrease significantly by availability of contraception.[9] It pointed out significant factors for low fertility rates to include instability of modern partnerships and value changes.[9] It also stated that government support of assisted reproductive technology is beneficial for families, but its effect on total fertility rate is extremely small,[9] and government policies that transfer cash to families for pregnancy and child support also only have small effects on total fertility rate.[9]
The relationship between fertility and socio-economic development is a subject of debate in social sciences. The main issue of the debate is whether there exists a trade-off relationship between fertility and development. There is a demographic-economic paradox in the inverse correlation found between wealth and fertility within and between nations.
See also
- Crude birth rate
- List of countries and territories by fertility rate
- List of people with the most children
- Demography
- Optimum population
- Fertility-development controversy
Dynamics:
- Fertility and intelligence
- Demographic-economic paradox
- Sub-replacement fertility
- Zero population growth
Case studies:
Notes
- ^ Total fertility rate definition from CIA world factbook
- ^ UNdata: Total fertility rate (children per woman)
- ^ National Association for Public Health Statistics and Information Systems (NAPHSIS), "Statistical Measures and Definitions" [retrieved 16 June 2010].
- ^ Espenshade TJ, Guzman JC, and Westoff CF (2003). "The surprising global variation in replacement fertility". Population Research and Policy Review 22 (5/6): 575. doi:10.1023/B:POPU.0000020882.29684.8e.
- ^ Graph Charts of TFR and FLR using Google Motion Chart using World Bank's World Development Index.
- ^ Ben J. Wattenberg (1985). "Chapter 11. The Birth Dearth". The good news is the bad news is wrong. American Enterprise Institute. ISBN 9780671606411. http://books.google.com/books?id=9jho2dEhwh0C&pg=PA63
- ^ "How Fertility Changes Across Immigrant Generations." Research Brief #58, Public Policy Institute of California, 2002.
- ^ Terrell, Heather Kathleen Mary, FERTILITY IN CHINA IN 2000: A COUNTY LEVEL ANALYSIS (2005), Texas A&M University.
- ^ a b c d Eshre Capri Workshop, G. (2010). "Europe the continent with the lowest fertility". Human Reproduction Update 16 (6): 590–602. doi:10.1093/humupd/dmq023. PMID 20603286.
Fertility
- Bulatao, Rodolfo (1984). Reducing Fertility in Developing Countries. Washington: World Bank. ISBN 0821304445. http://catalog.hathitrust.org/Record/000666403.
External links
- World Factbook table of Total Fertility Rate ordered by country rank
- Population Reference Bureau Glossary of Population Terms
- Java Simulation of Total Fertility.
- Java Simulation of Population Dynamics.
- How Fertility Changes Across Immigrant Generations.
- Fertility Trends, Marriage Patterns and Savant Typologies.
- Human Fertility Database: Collection of age specific fertility rates for some developed countries.
Categories:


Wikimedia Foundation. 2010.