- Demographics of Lithuania
-
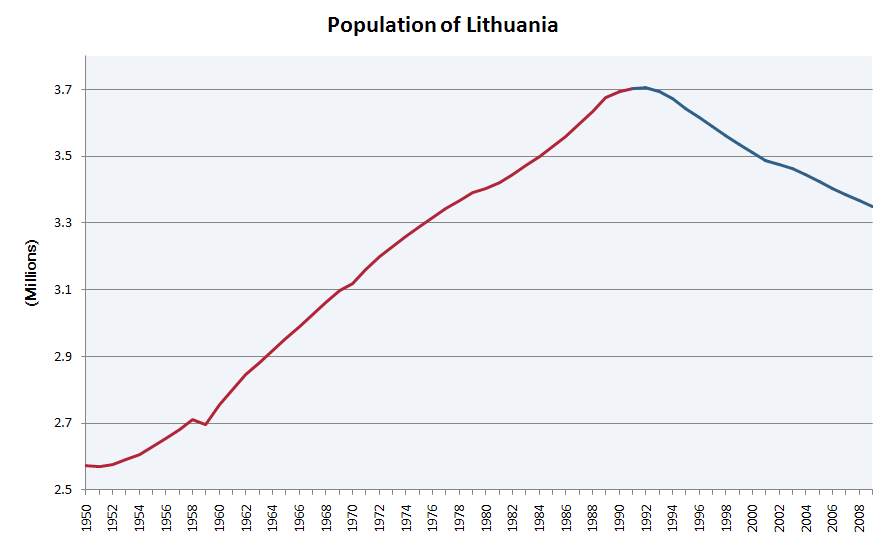
 Population of Lithuania (in millions) from 1950-2010.
This article is about the demographic features of the population of Lithuania, including population density, ethnicity, level of education, health, economic status, and religious affiliations.
Contents
Prehistory
The earliest evidence of inhabitants in present-day Lithuania dates back to 10,000 BC. Between 3000–2000 BC, the cord-ware culture people spread over a vast region of eastern Europe, between the Baltic Sea and the Vistula River in the West and the Moscow-Kursk line in the East. Merging with the indigenous peoples, they gave rise to the Balts, a distinct Indo-European ethnic group whose descendants are the present-day Lithuanian and Latvian nations and the former Old Prussians.
Historical demographics
Grand Duchy of Lithuania
- See also: Demographics and Languages of Grand Duchy of Lithuania, Demographics of the Polish–Lithuanian Commonwealth
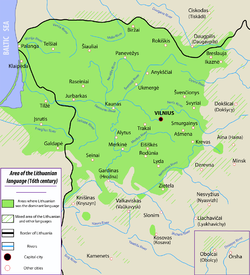 Area of the Lithuanian language in the 16th century
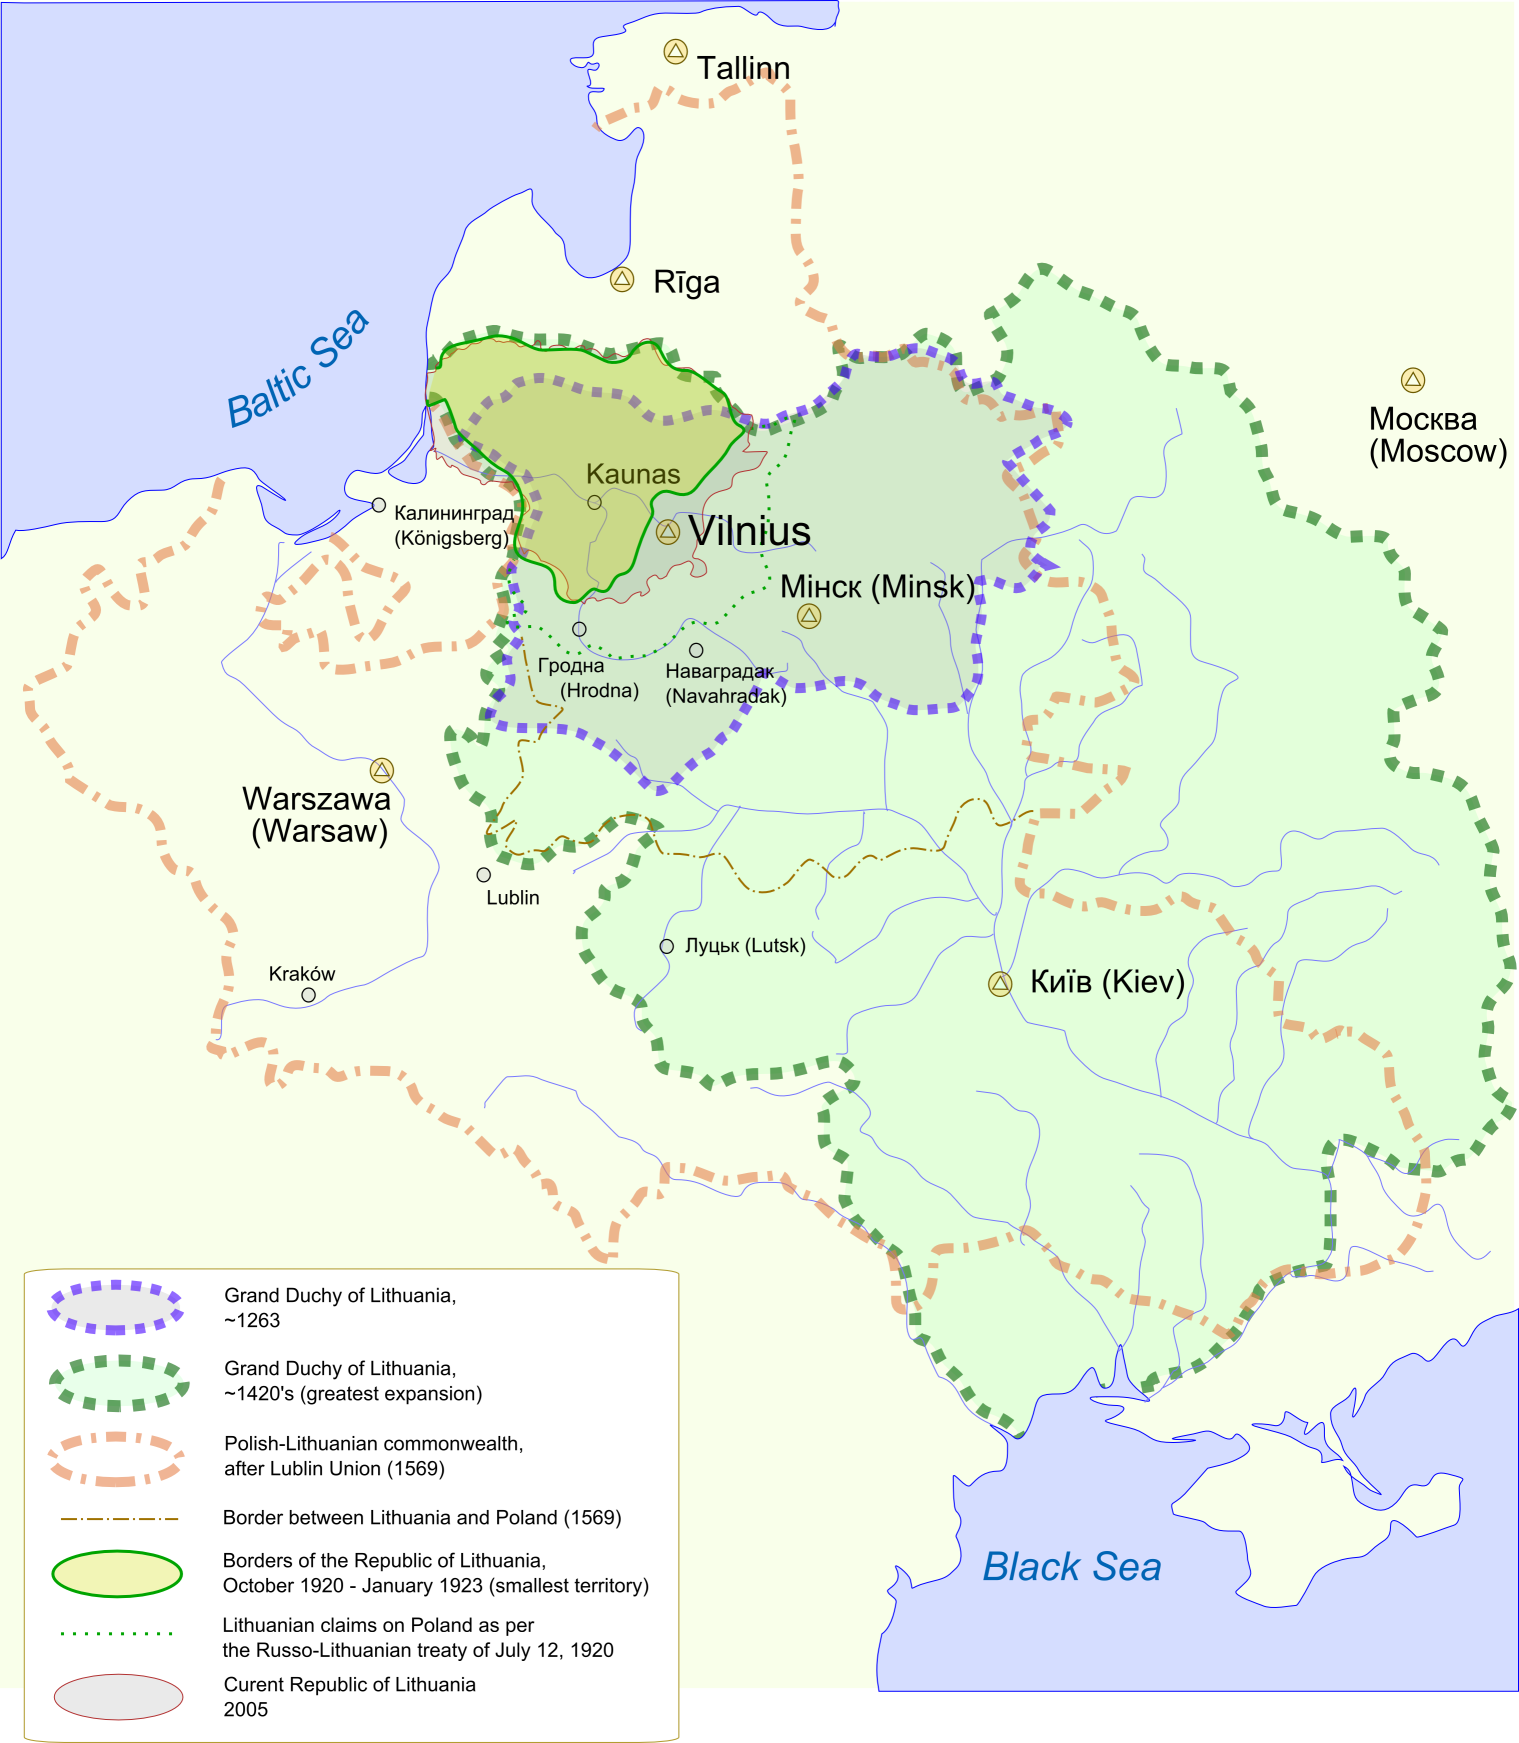
 Map showing changes in the territory of Lithuania from the 13th century to the present day
The name of Lithuania – Lithuanians – was first mentioned in 1009. Among its etymologies there are a derivation from the word Lietava, for a small river, a possible derivation from a word leičiai, but most probable is the name for union of Lithuanian ethnic tribes ('susilieti, lietis' means to unite and the word 'lietuva' means something which has been united).
The primary Lithuanian state, the Duchy of Lithuania, emerged in the territory of Lietuva, the ethnic homeland of Lithuanians. At the birth of the Grand Duchy of Lithuania (GDL), ethnic Lithuanians made up about 70% of the population.[1] With the acquisition of new Ruthenian territories, this proportion decreased to 50% and later to 30%. By the time of the largest expansion towards Kievan Rus' lands, at the end of the 13th and during the 14th century, the territory of the GDL was about 800,000 km2, of which 10% was ethnically Lithuanian.[2] The ethnic Lithuanian population is estimated to have been 420,000 out of 1.4 million in 1375 (the territory was about 700,000 km2), and 550,000 out of 3.8 million in 1490 (territory: 850,000 km2)[3] Ruthenians were only nowadays Ukrainians and the whole Belarus including Smolensk and Mozhaisk Galindians were of Lithuanian ethnicity (belonging to the same family as Prussians or Latvians). In addition to the Ruthenians and Lithuanians, other significant ethnic groups throughout GDL were Jews and Tatars. The combined population of Poland and GDL in 1493 is estimated as 7.5 million, of whom 3.25 million were Poles, 3.75 million Ruthenians and 0.5 million Lithuanians.[4] With the Union of Lublin Lithuanian Grand Duchy lost large part of lands to the Polish Crown (see demographics of the Polish–Lithuanian Commonwealth). An ethnic Lithuanian proportion being about 1/4 in GDL after the Union of Lublin was held till the partitions. There was much devastation and population loss throughout the GDL in the mid and late 17th century,[5] including the ethnic Lithuanian population in Vilnius voivodeship. Besides devastation[clarification needed], the Ruthenian population declined proportionally[clarification needed] after the territorial losses to the Russian Empire. In 1770 there were about 4.84 million inhabitants in GDL, of which the largest ethnic group were Ruthenians, about 1.39 million – Lithuanians[clarification needed].[1] The voivodeships with a majority ethnic Lithuanian population were Vilnius, Trakai and Samogitian voivodeships, and these three voivodeships comprised the political center of the state. In the southern angle of Trakai voivodeship and south-eastern part of Vilnius voivodeship there were also many Belarusians; in some of the south-eastern areas they were the major linguistic group.
The Ruthenian population formed a majority in GDL from the time of the GDL's expansion in the mid 14th century; and the adjective "Lithuanian", besides denoting ethnic Lithuanians, from early times denoted any inhabitant of GDL, including Slavs and Jews.
The Ruthenian language, corresponding to today's Belarusian and Ukrainian, was then called Russian, and was used as one of the chancellery[clarification needed] languages by Lithuanian monarchs. However there are fewer extant documents written in this language than those written in Latin and German from the time of Vytautas. Later, Ruthenian became the main language of documentation and writing. In the years that followed,, it was the main language of government until the introduction of Polish as the chancellery language of the Lithuanian-Polish Commonwealth in 1697; however there are also examples of documents written in Ruthenian from the second half of the 18th century.[6] The Lithuanian language was used orally in Vilnius, Trakai and Samogitian voivodeships, and by small numbers of people elsewhere. At the court of Zygmunt August, the last king of the Duchy, both Polish and Lithuanian were spoken.[7]
Russian empire
After partition of Lithuania in the late 18th century, it become a part of Russian empire. After the abolition of serfdom in 1861, the use of the Polish language noticeably increased in eastern Lithuania and western Belarus.[2] Many Lithuanians, living further east, were unable to receive the Lithuanian printed books smuggled into Lithuania by knygnešiai during the time of the ban on printing books in the Latin alphabet, and they switched to Polish. Although this also used the Latin alphabet, it was much less affected by the ban, because Polish was still used by the politically important class of the nobility, and also used predominantly in the biggest towns of Lithuania, and supported by the church.
National revival
The Lithuanian National Revival had begun to intensify by the end of the 19th century, and the number of Lithuanian speakers and people identifying themselves as ethnic Lithuanians started to increase; but at the same time many Polish speaking Lithuanians, especially former szlachta, cut themselves adrift from the Lithuanian nation. There were population losses due to several border changes, Soviet deportations, a massacre of the Lithuanian Jewish population, and German and Polish repatriations during and after World War II. After World War II, the ethnic Lithuanian population remained stable: 79.3% in 1959 to 83.5% in 2002. Lithuania's citizenship law and the Constitution meet international and OSCE standards, guaranteeing universal human and civil rights.
Ethnic composition
For more details on this topic, see Ethnic minorities in Lithuania.Lithuanians are neither Slavic nor Germanic, although the union with Poland, German and Russian colonization and settlement left cultural and religious influences.
Before WW II
Population of Lithuania according to ethnic group 1923/1925 1 Ethnic
groupcensus 1923 of Lithuania census 1925 of the Klaipėda Region Number % Number % Lithuanians 1,701,863 89.3 37,626 26.6 Memels 34,227 24.2 Jews 153,743 7.6 578 0.4 Germans 29,231 1.4 59,337 41.9 Poles 65,599 3.2 29 0.0 Russians 50,460 2.5 267 0.2 Latvians 14,883 0.7 47 0.0 Belarusians 4,421 0.2 - - Tatars 973 0.0 Romani 284 0.0 Karaites 141 0.0 Estonians 46 0.0 Ukrainians 43 0.0 Others 7,284 0.2 9,424 6.7 Total 2,028,971 141,645 1 Source: [2]. The Klaipėda Region was annexed from Germany in 1923, but was not included in the 1923 census. A separate census in the Klaipėda region was held in 1925. After WW II
Among the Baltic states, Lithuania has the most homogeneous population. According to the census conducted in 2001, 83.4% of the population identified themselves as Lithuanians, 6.7% as Poles, 6.3% as Russians, 1.2% as Belarusians, and 2.3% as members of other ethnic groups.
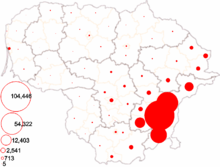 Number of Poles in Lithuania
Poles are concentrated in the Vilnius Region, the area controlled by Poland in the interwar period. There are especially large Polish communities in Vilnius district municipality (61.3% of the population) and Šalčininkai district municipality (79.5%). Such concentrations would allow Election Action of Lithuania's Poles, an ethnic minority-based political party, to exert political influence, but the 5% rule prevents it from entering the parliament of Lithuania. The party is more active in local politics and controls several municipal councils.
Population of Lithuania according to ethnic group 1959-2011 Ethnic
groupcensus 19591 census 19702 census 19793 census 19894 census 20015 2011 estimate5 Number % Number % Number % Number % Number % Number % Lithuanians 2,150,7671 79.3 2,506,751 80.1 2,712,233 80.0 2,924,251 79.6 2,907,293 83.4 2,721,500 83.9 Poles 230,107 8.5 240,203 7.7 247,022 7.3 257,994 7.0 234,989 6.7 212,800 6.6 Russians 231,014 8.5 267,989 8.6 303,493 8.9 344,455 9.4 219,789 6.3 174,900 5.4 Belarusians 30,256 1.1 45,412 1.5 57,584 1.7 63,169 1.7 42,866 1.2 41,100 1.3 Ukrainians 17,692 0.7 25,099 0.8 31,982 0.9 44,789 1.2 22,488 0.6 21,100 0.6 Jews 24,667 0.9 23,538 0.8 14,691 0.4 12,390 0.3 4,007 0.1 3,400 0.1 Germans 11,166 0.4 1,904 0.1 2,616 0.1 2,058 0.1 3,243 0.1 3,000 0.1 Tatars 3,020 0.1 3,454 0.1 3,984 0.1 5,135 0.1 3,235 0.1 3,100 0.1 Latvians 6,318 0.2 5,063 0.2 4,354 0.1 4,229 0.1 2,955 0.1 2,400 0.1 Romani 1,238 0.1 1,880 0.1 2,306 0.1 2,718 0.1 2,571 0.1 2,900 0.1 Estonians 352 0.0 551 0.0 546 0.0 598 0.0 400 0.0 Karaites 423 0.0 388 0.0 352 0.0 289 0.0 Others or unspecified 4,425 0.2 6,004 0.2 10,327 0.3 12,727 0.3 40,136 1.2 58,400 1.7 Total 2,711,445 3,128,236 3,391,490 3,674,802 3,483,972 3,244,600 1 Source: [3]. 2 Source: [4]. 3 Source: [5]. 4 Source: [6]. 5 Source: [7]. Russians, even though they are almost as numerous as Poles, are much more evenly scattered and lack a strong political party. The most prominent community lives in Visaginas (52%). Most of them are scientists who moved with their families from the Russian SFSR to work at the Ignalina Nuclear Power Plant. Lithuania is noted for its success in limiting Russian immigration during the Soviet period (1945–1990), in comparison to Latvia and Estonia. A number of ethnic Russians (mostly military) left Lithuania after the declaration of independence in 1990.
Another major change in the ethnic composition of Lithuania was the extermination of the Jewish population during the Holocaust. Before World War II about 7.5% of the population was Jewish; they were concentrated in cities and towns and had a significant influence on crafts and business. They were called Litvaks and had a strong culture. The population of Vilnius, sometimes nicknamed Northern Jerusalem, was about 30% Jewish. Almost all of these Jews were killed during the Nazi German occupation, or later emigrated to the United States and Israel. Now there are only about 4,000 Jews living in Lithuania.
Citizenship
Lithuania's membership of the European Union has made Lithuanian citizenship all the more appealing. Lithuanian citizenship is theoretically easier (see court ruling notes below) to obtain than that of many other European countries - only one great-grandparent is necessary to become a Lithuanian citizen. Persons who held citizenship in the Republic of Lithuania prior to June 15, 1940, and their children, grandchildren, and great-grandchildren (provided that these persons did not repatriate) are eligible for Lithuanian citizenship [8].
Lithuanian citizens are allowed to travel throughout the European Union without a visa. As far as work is concerned, the United Kingdom, Sweden, Ireland, Spain, Portugal, Finland, and Greece place no restrictions on Lithuanians working in their respective countries. The other older member nations of the European Union still place restrictions on work, but these are merely transitional arrangements.
Dual citizenship ruled unconstitutional
The Lithuanian Constitutional Court ruled in November 2006 that a number of provisions of the Law of the Republic of Lithuania on citizenship are in conflict with the Lithuanian Constitution. In particular, the court ruled that a number of current provisions of the Citizenship Law implicitly or explicitly allowing dual citizenship are in conflict with the Constitution; such provisions amounted to the unconstitutional practice of making dual citizenship a common phenomenon rather than a rare exception. The provisions of the Citizenship Law announced unconstitutional are no longer valid and applicable to the extent stated by the Constitutional Court.
The Lithuanian Parliament amended the Citizenship Law substantially as a result of this court ruling, allowing dual Citizenship for children of at least one Lithuanian parent that are born abroad, but preventing Lithuanians from keeping their Lithuanian citizenship after obtaining citizenship of another country.
There are some special cases still permitting dual citizenship. See http://en.wikipedia.org/wiki/Lithuanian_nationality_law.
Languages
Languages by mother tongue (census 2001):[8]:
- Lithuanian - 82%
- Russian - 8%
- Polish - 5.6%
- Belorussian - 0.46%
- Ukrainian - 0.235%
- Other - 0.28%
- Did not specify - 3.5%
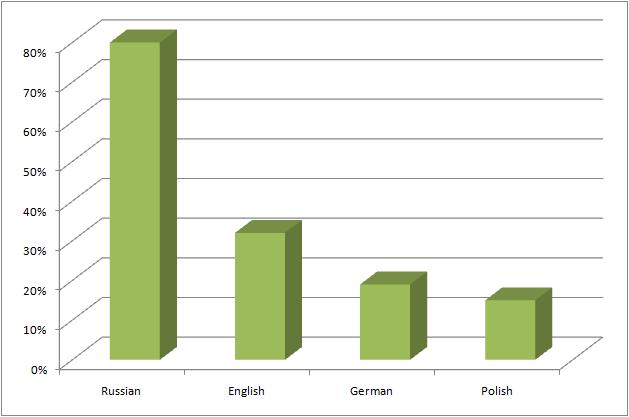
The Lithuanian language, which uses a modified Latin alphabet, is the country's official language. It is the first language of 82% of population and is also spoken by 356,000 out of 577,000 non-Lithuanians.[9] The Soviet era had imposed the official use of Russian, so most adult Lithuanians speak Russian as a second language, while the original Polish population generally speaks Polish and Russians who immigrated after World War II speak Russian as their first language. The younger generation usually speaks English as their second language. According to census of 2001, 17% of population can speak English fluently (21% in urban areas, 9% in rural areas).[9]
About 30,600 pupils started their 2003 school year in schools where the entire curriculum is conducted in Russian (down from 76,000 in 1991), and about 20,500 enrolled in Polish schools (up from 11,400 in 1991). There are also schools in the Belarusian language (these enrolled about 160 students in 2003), as well as in German.
There are perhaps 50 speakers of Karaim, a Turkic language spoken by Karaite Jews, in Lithuania.[10]
Religion
Main article: Religion in LithuaniaPopulation by Religious Confession (2001 census):[11]
- Roman Catholics - 79% (2,752,447 people)
- Orthodox Believers - 4.05% (141,821)
- Old Believers - 0.77% (27,073)
- Evangelical Lutherans - 0.56% (19,637)
- Evangelical Reformists - 0.2% (7,082)
- Jehovah's Witnesses - 0.1% (3,512)
- Sunni Muslims - 0.08% (2,860)
- All Gospel Churches - 0.06% (2,207)
- Pentecostal Church - 0.04% (1,307)
- Judaists - 0.04% (1,272)
- Balts Believers - 0.04% (1,270)
- Baptists (and other independent churches) - 0.04% (1,249)
- Other believers - 0.135% (4,701)
- Not any - 9.5% (331,087)
- Not indicated - 5.35% (186,447)
According to the 2005 Eurobarometer Poll,[12] 12% said that "they do not believe there is any sort of spirit, god, or life force", 36% answered that "they believe there is some sort of spirit or life force" and 49% of Lithuanian citizens responded that "they believe there is a God".
CIA World Factbook demographic statistics
The following demographic statistics are from the CIA World Factbook, unless otherwise indicated.
Age structure:
0–14 years: 14.2% (male 258,423/female 245,115)
15–64 years: 69.6% (male 1,214,743/female 1,261,413)
65 years and over: 16.2% (male 198,714/female 376,771) (2009 est.)Population growth rate: −0.28% (2009 est.)
Net migration rate: -0.72 migrant(s)/1,000 population (2009 est.)
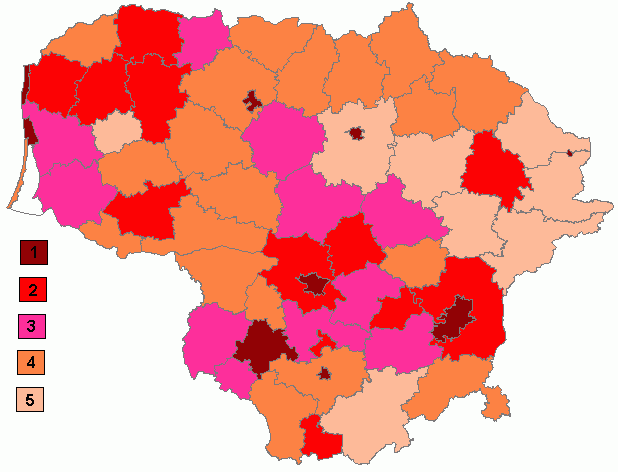
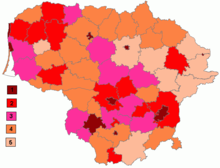 Map of population density in Lithuania
Sex ratio:
at birth: 1.06 male(s)/female
under 15 years: 1.05 male(s)/female
15-64 years: 0.96 male(s)/female
65 years and over: 0.53 male(s)/female
total population: 0.89 male(s)/female (2009 est.)Infant mortality rate: Total: 6.47 deaths/1,000 live births
male: 7.73 deaths/1,000 live births
female: 5.13 deaths/1,000 live births (2009 est.)Life expectancy at birth:
total population: 74.9 years
male: 69.98 years
female: 80.1 years (2009 est.)Total fertility rate: 1.55 children born/woman (2009) [9]
Suicide rate: 31.5 suicides per every 100,000 people (2009)[13]
Divorce rate: With 2.8 divorces per every 1000 people (2009), Lithuania in 2004 had one of the highest divorce rate in the European Union [10].
Table of birth and death rates
Before WW II
Average population (x 1000) Live births Deaths Natural change Crude birth rate (per 1000) Crude death rate (per 1000) Natural change (per 1000) 1915 2 137 38 722 43 596 -4 874 18.1 20.4 -2.3 1916 2 137 35 565 31 512 4 053 16.6 14.7 1.9 1917 2 134 32 266 43 047 -10 781 15.1 20.2 -5.1 1918 2 121 33 176 47 522 -14 346 15.6 22.4 -6.8 1919 2 108 41 095 51 930 -10 835 19.5 24.6 -5.1 1920 2 104 47 642 44 487 3 155 22.6 21.1 1.5 1921 2 116 51 864 31 915 19 949 24.5 15.1 9.4 1922 2 136 58 064 37 598 20 466 27.2 17.6 9.6 1923 2 161 60 869 32 432 28 437 28.2 15.0 13.2 1924 2 189 63 864 35 493 28 371 29.2 16.2 13.0 1925 2 217 63 743 37 179 26 564 28.8 16.8 12.0 1926 2 245 63 655 34 380 29 275 28.4 15.3 13.0 1927 2 273 66 114 38 897 27 217 29.1 17.1 12.0 1928 2 301 65 945 35 698 27 116 28.7 15.5 11.8 1929 2 328 63 083 39 669 23 414 27.1 17.0 10.1 1930 2 354 64 164 37 151 27 013 27.3 15.8 11.5 1931 2 380 63 419 37 478 25 941 26.6 15.7 10.9 1932 2 407 65 371 36 577 28 794 27.2 15.2 12.0 1933 2 436 62 145 32 749 29 396 25.5 13.4 12.1 1934 2 464 60 770 35 789 24 981 24.7 14.5 10.1 1935 2 488 57 970 34 595 23 375 23.3 13.9 9.4 1936 2 513 60 446 33 440 25 939 24.1 13.3 10.3 1937 2 538 56 393 33 260 22 433 22.2 13.1 8.8 1938 2 563 57 951 32 256 24 562 22.6 12.6 9.6 19391 2 432 54 184 32 983 21 201 22.3 13.6 8.7 1 the figures of 1939 exclude the Klaipėda Region
after WW II
- Source: Statistics Lithuania
Average population (x 1000) Live births Deaths Natural change Crude birth rate (per 1000) Crude death rate (per 1000) Natural change (per 1000) 1945 2 520 60 392 35 201 25 191 24.0 14.0 10.0 1946 2 530 58 399 37 688 20 711 23.1 14.9 8.2 1947 2 540 59 680 39 716 19 964 23.5 15.6 7.9 1948 2 550 58 780 35 137 23 643 23.1 13.8 9.3 1949 2 560 63 034 32 049 30 985 24.6 12.5 12.1 1950 2 567 60 719 30 870 29 849 23.7 12.0 11.6 1951 2 569 58 504 29 693 28 811 22.8 11.6 11.2 1952 2 576 56 944 28 166 28 778 22.1 10.9 11.2 1953 2 590 52 610 27 118 25 492 20.3 10.5 9.8 1954 2 607 54 229 25 559 28 670 20.8 9.8 11.0 1955 2 629 55 525 24 138 31 387 21.1 9.2 11.9 1956 2 653 53 741 21 869 31 872 20.3 8.2 12.0 1957 2 681 56 223 23 361 32 862 21.0 8.7 12.3 1958 2 711 61 190 22 103 39 087 22.6 8.2 14.4 1959 2 744 62 241 24 688 37 553 22.7 9.0 13.7 1960 2 782 62 485 21 611 40 874 22.5 7.8 14.7 1961 2 828 62 775 23 365 39 410 22.2 8.3 13.9 1962 2 865 59 728 24 925 34 803 20.8 8.7 12.1 1963 2 893 57 024 23 112 33 912 19.7 8.0 11.7 1964 2 928 55 856 21 830 34 026 19.1 7.5 11.6 1965 2 967 53 818 23 467 30 351 18.1 7.9 10.2 1966 3 006 54 275 23 799 30 476 18.1 7.9 10.1 1967 3 045 53 806 24 571 29 235 17.7 8.1 9.6 1968 3 083 54 258 25 725 28 533 17.6 8.3 9.3 1969 3 115 54 263 27 156 27 107 17.4 8.7 8.7 1970 3 144 55 519 28 048 27 471 17.7 8.9 8.7 1971 3 179 56 044 26 972 29 072 17.6 8.5 9.1 1972 3 214 54 616 29 252 25 364 17.0 9.1 7.9 1973 3 244 51 944 29 160 22 784 16.0 9.0 7.0 1974 3 274 51 941 29 612 22 329 15.9 9.0 6.8 1975 3 302 51 766 31 265 20 501 15.7 9.5 6.2 1976 3 329 52 296 31 972 20 324 15.7 9.6 6.1 1977 3 355 52 166 32 932 19 234 15.5 9.8 5.7 1978 3 379 51 821 34 008 17 813 15.3 10.1 5.3 1979 3 398 51 937 34 897 17 040 15.3 10.3 5.0 1980 3 413 51 765 35 871 15 894 15.2 10.5 4.7 1981 3 433 52 249 35 579 16 670 15.2 10.4 4.9 1982 3 457 53 141 35 040 18 101 15.4 10.1 5.2 1983 3 485 57 589 36 451 21 138 16.5 10.5 6.1 1984 3 514 57 576 38 666 18 910 16.4 11.0 5.4 1985 3 545 58 454 39 169 19 285 16.5 11.0 5.4 1986 3 579 59 705 35 788 23 917 16.7 10.0 6.7 1987 3 616 59 360 36 917 22 443 16.4 10.2 6.2 1988 3 655 56 727 37 649 19 078 15.5 10.3 5.2 1989 3 684 55 782 38 150 17 632 15.1 10.3 4.8 1990 3 698 56 868 39 760 17 108 15.3 10.7 4.6 1991 3 704 56 219 41 013 15 206 15.2 11.1 4.1 1992 3 700 53 617 41 455 12 162 14.5 11.2 3.3 1993 3 683 47 464 46 107 1 357 12.9 12.5 0.4 1994 3 657 42 376 46 486 -4 110 11.6 12.7 -1.1 1995 3 629 41 195 45 306 -4 111 11.4 12.5 -1.1 1996 3 602 39 066 42 896 -3 830 10.8 11.9 -1.1 1997 3 575 37 812 41 143 -3 331 10.6 11.5 -0.9 1998 3 549 37 508 40 793 -3 285 10.6 11.5 -0.9 1999 3 524 36 415 40 003 -3 588 10.3 11.4 -1.0 2000 3 500 34 149 38 919 -4 770 9.8 11.1 -1.4 2001 3 481 31 546 40 399 -8 853 9.1 11.6 -2.5 2002 3 469 30 014 41 072 -11 058 8.7 11.8 -3.2 2003 3 455 30 598 40 990 -10 392 8.9 11.9 -3.0 2004 3 436 30 419 41 340 -10 921 8.9 12.0 -3.2 2005 3 414 30 541 43 799 -13 258 8.9 12.8 -3.9 2006 3 394 31 265 44 813 -13 548 9.2 13.2 -4.0 2007 3 376 32 154 45 589 -13 435 9.5 13.5 -4.0 2008 3 358 35 272 43 820 -8 548 10.5 13.0 -2.5 2009 3 339 36 682 42 032 -5 350 11.0 12.6 -1.6 2010 3 287 35 948 42 114 -6 166 10.9 12.8 -1.9 Literacy
Lithuania is one of the most literate countries in the world. The proportion of people aged 15 and over who can read and write is 99.6% according to the 2001 census. The proportion is the same for males and females. Primary, secondary, and high school education is free to all residents. Ten years of schooling is required. Tertiary education is almost free. Depending on grades, a student might receive a stipend or make a payment of 520 litas per semester. There are also small social stipends available for students with economic difficulties. In 2003 43,900 students were admitted to the 21 universities in Lithuania (11,100 of them to master programs). About 70% of high school graduates continue to study in universities or professional schools.[14]
See also
- Lithuania
- Lithuanians in Brazil
- Ethnic history of the Vilnius region
- Russians in Lithuania
- Aging of Europe
Notes
- ^ a b (Lithuanian) Letukienė, Nijolė; Gineika, Petras (2003). Istorija. Politologija: kurso santrauka istorijos egzaminui. Vilnius: Alma littera. p. 182.. Statistical numbers, probably accepted in historiography (the sources, their treatment, the procedure of counting is not discussed in this book) are given, according which in 1260 there were about 0.27 million Lithuanians of 0.4 million of a whole population; in percentage: 67,5 %.
- ^ a b Bjorn Wiemer, Dialect and language contacts on the territory of the Grand Duchy from the 15th century until 1939, Kurt Braunmüller, Gisella Ferraresi, Aspects of multilingualism in European language history, John Benjamins Publishing Company, 2003, ISBN 90-272-1922-2, Google Print, p.109; 125
- ^ Letukienė, N., Istorija. Politologija: kurso santrauka istorijos egzaminui, 2003, p. 182. There can be found also different numbers, for example: Kevin O'Connor, The history of the Baltic States, Greenwood Publishing Group, 2003, ISBN 0-313-32355-0, Google Print, p.17. Here author estimates that there were 9 millions of inhabitants in GDL, and 1 million of them were ethnic Lithuanians by 1387.
- ^ Based on 1493 population map (p.92) from Iwo Cyprian Pogonowski, Poland a Historical Atlas, Hippocrene Books, 1987, ISBN 0-88029-394-2
- ^ Jarmo Kotilaine, Russia's foreign trade and economic expansion in the seventeenth century: windows on the world, BRILL, 2005, ISBN 90-04-13896-X, Google Print, p.45
- ^ (Lithuanian) Lietuvos Didžiosios kunigaikštystės kanceliarinės slavų kalbos termino nusakymo problema Z. Zinkevičius
- ^ Daniel. Z Stone, A History of East Central Europe, p.4
- ^ Statistics Lithuania census 2001: (Lithuanian) Population by nationality and mothertongue
- ^ a b (Lithuanian)Census 2001: Mokame vis daugiau kalbų
- ^ UNESCO, Audio-visual resources. Retrieved 2011-09-12.
- ^ Census 2001: Population by Religious Confession
- ^ "Eurobarometer on Social Values, Science and technology 2005" (PDF). p. 11. http://ec.europa.eu/public_opinion/archives/ebs/ebs_225_report_en.pdf. Retrieved 2007-05-05.
- ^ "Death Due To Suicide". Eurostat. European Commission. 2009. http://epp.eurostat.ec.europa.eu/tgm/refreshTableAction.do?tab=table&plugin=0&pcode=tps00122&language=en. Retrieved 2010-01-10.
- ^ Statistical Yearbook of Lithuania 2004, p. 233
External links
- statistics about education in Lithuania (PDF)
- Key results of Lithuanian census
- Suicide statistics as of 2005 (Lith.)
Demographics of Europe Sovereign
states- Albania
- Andorra
- Armenia
- Austria
- Azerbaijan
- Belarus
- Belgium
- Bosnia and Herzegovina
- Bulgaria
- Croatia
- Cyprus
- Czech Republic
- Denmark
- Estonia
- Finland
- France
- Georgia
- Germany
- Greece
- Hungary
- Iceland
- Ireland
- Italy
- Kazakhstan
- Latvia
- Liechtenstein
- Lithuania
- Luxembourg
- Macedonia
- Malta
- Moldova
- Monaco
- Montenegro
- Netherlands
- Norway
- Poland
- Portugal
- Romania
- Russia
- San Marino
- Serbia
- Slovakia
- Slovenia
- Spain
- Sweden
- Switzerland
- Turkey
- Ukraine
- United Kingdom
- (England
- Northern Ireland
- Scotland
- Wales)
- Vatican City
States with limited
recognition- Abkhazia
- Kosovo
- Nagorno-Karabakh
- Northern Cyprus
- South Ossetia
- Transnistria
Dependencies
and other territories- Åland
- Faroe Islands
- Gibraltar
- Guernsey
- Jan Mayen
- Jersey
- Isle of Man
- Svalbard
Other entities - European Union
Categories:


Wikimedia Foundation. 2010.