- Demographics of Hungary
-
Demographics of Hungary 
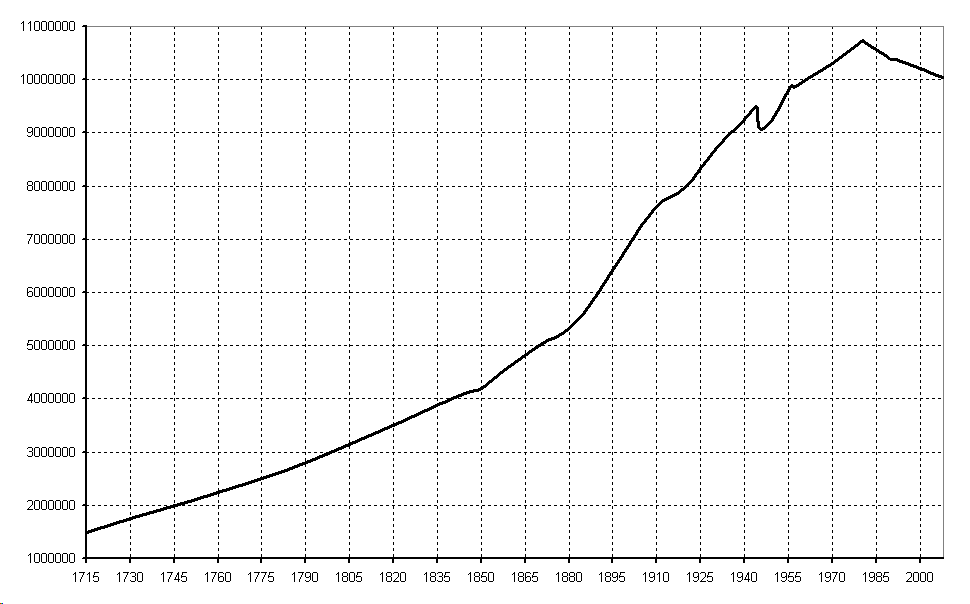
1715-2008 Historic estimates and censuses for the total population in the territory of present-day Hungary.Population: 9,986,000 (2011) Growth rate: -4‰ (2010) Birth rate: 9.0 births/1,000 population (2010) Death rate: 13.0 deaths/1,000 population (2010) Life expectancy: 74.79 years (2011) –male: 71.04 years (2011) –female: 78.76 years (2011) Fertility rate: 1.26 children born/woman (2010) Infant mortality rate: 5.3 / 1000 births (2010) Age structure: 0-14 years: 15% 15-64 years: 69.3% 65-over: 15.8% Sex ratio: At birth: 1.06 male(s)/female (2008 est.) Under 15: 1.06 male(s)/female 15-64 years: 0.97 male(s)/female 65-over: 0.57 male(s)/female Nationality: Nationality: noun: Hungarian(s) adjective: Hungarian Major ethnic: Hungarians Language: Spoken: Hungarian This article is about the demographic features of the population of Hungary, including population density, ethnicity, education level, health of the populace, economic status, religious affiliations and other aspects of the population.
Contents
- 1 Historical
- 2 Vital statistics
- 3 Present
- 4 Religion
- 5 Largest cities
- 6 Language
- 7 Ethnic groups during history of Hungary
- 8 See also
- 9 Notes
- 10 References
- 11 External links
Historical
The population composition at the foundation of Hungary (895) depends on the size of the arriving Hungarian population and the size of the Slavic (and remains of Avar-Slavic) population at the time. One source mentions 200 000 Slavs and 400 000 Hungarians,[1] while other sources often don't give estimates for both, making comparison more difficult. The size of the Hungarian population around 895 is often estimated between 120 000 and 600 000,[2] with a number of estimates in the 400-600 000 range.[1][3][4] Other sources only mention a fighting force of 25 000 Magyar warriors used in the attack,[5][6] while declining to estimate the total population including women and children and warriors not participating in the invasion. In the historical demographics the largest earlier shock was the Mongol Invasion of Hungary, several plagues also took a toll on the country's population. According to the demographers, about 80 percent of the population was made up of Hungarians before the Battle of Mohács, however the Hungarian ethnic group became a minority in its own country after the Rákóczi's War for Independence. Major territorial changes made Hungary ethnically homogeneous after World War I. Nowadays, more than nine-tenths of the population is ethnically Hungarian and speaks Hungarian as the mother tongue.[7]
900–1910
Time Population Percentage rate of Hungarians (without Kingdom of Croatia) Notes c. 900 AD c. 600,000[1] 66%[1][4] 1000 1,000,000-1,500,000[8] 1222 2,000,000[9] 70–80%[7][10] The time of the Golden Bull. The last estimate before the Tatar invasion. 1242 1,200,000[10] Population decreased after the Mongol invasion of Hungary(estimations about population loss are between 20% and 50%).[11] 1300 2,000,000[12] 1348 Before the plague (at the time of the Angevin kings.) 1370 c. 2,000,000 60–70%[10] 1400 1490 Before the Ottoman conquest (about 3.2 million Hungarians). 1600 Populations of Royal Hungary, Transylvania and Ottoman Hungary together. 1699 At the time of Treaty of Karlowitz (not more than 2 million Hungarians). 1711 At the end of Kuruc War, starting date of the organized resettlement. 1720 1790 End of the organized resettlement, approximately 800 new German villages were established between 1711 and 1780.[50] 1828 11,495,536 40-45%[citation needed] 1837 1846 12,033,399 Two years before Hungarian Revolution of 1848. 1880 13,749,603 46% 1900 16,838,255 51.4%[53] 1910 18,264,533 5% Jews (counted according to their mother tongue). Note: The data refer to the territory of the Kingdom of Hungary, not of present-day Hungary.
Ethnic structure of the territory of contemporary Hungary (1495-1910)
Ethnic group 1495 1715 1785 1880 1900 1910 Hungarians 990,000
95,6 %1,176,000
79,1 %2,103,000
79 %4,402,364
82.4 %5,890,999
85.9 %6,730,299
88.4 %Germans 17,000
1.6 %136,600
9.2 %291,900
11 %606,363
11.3 %604,751
8.8 %553,179
7.3 %Slovaks n.d
n.d.37,700
2.5 %130,400
4.9 %199,788
3.7 %192,227
2.8 %165,317
2.2 %Croats 1,200
0.1 %58,900
4 %71,700
2.7 %59,251
1.1 %68,161
1 %62,018
0.8 %Others 23,800
2.4 %70,800
4.8 %66,214
2.4 %75,598
1.5 %98,277
1.5 %101,301
1.3 %Total 1,032,000 1,480,000 2,663,214 5,343,364 6,854,415 7,612,114 Treaty of Trianon
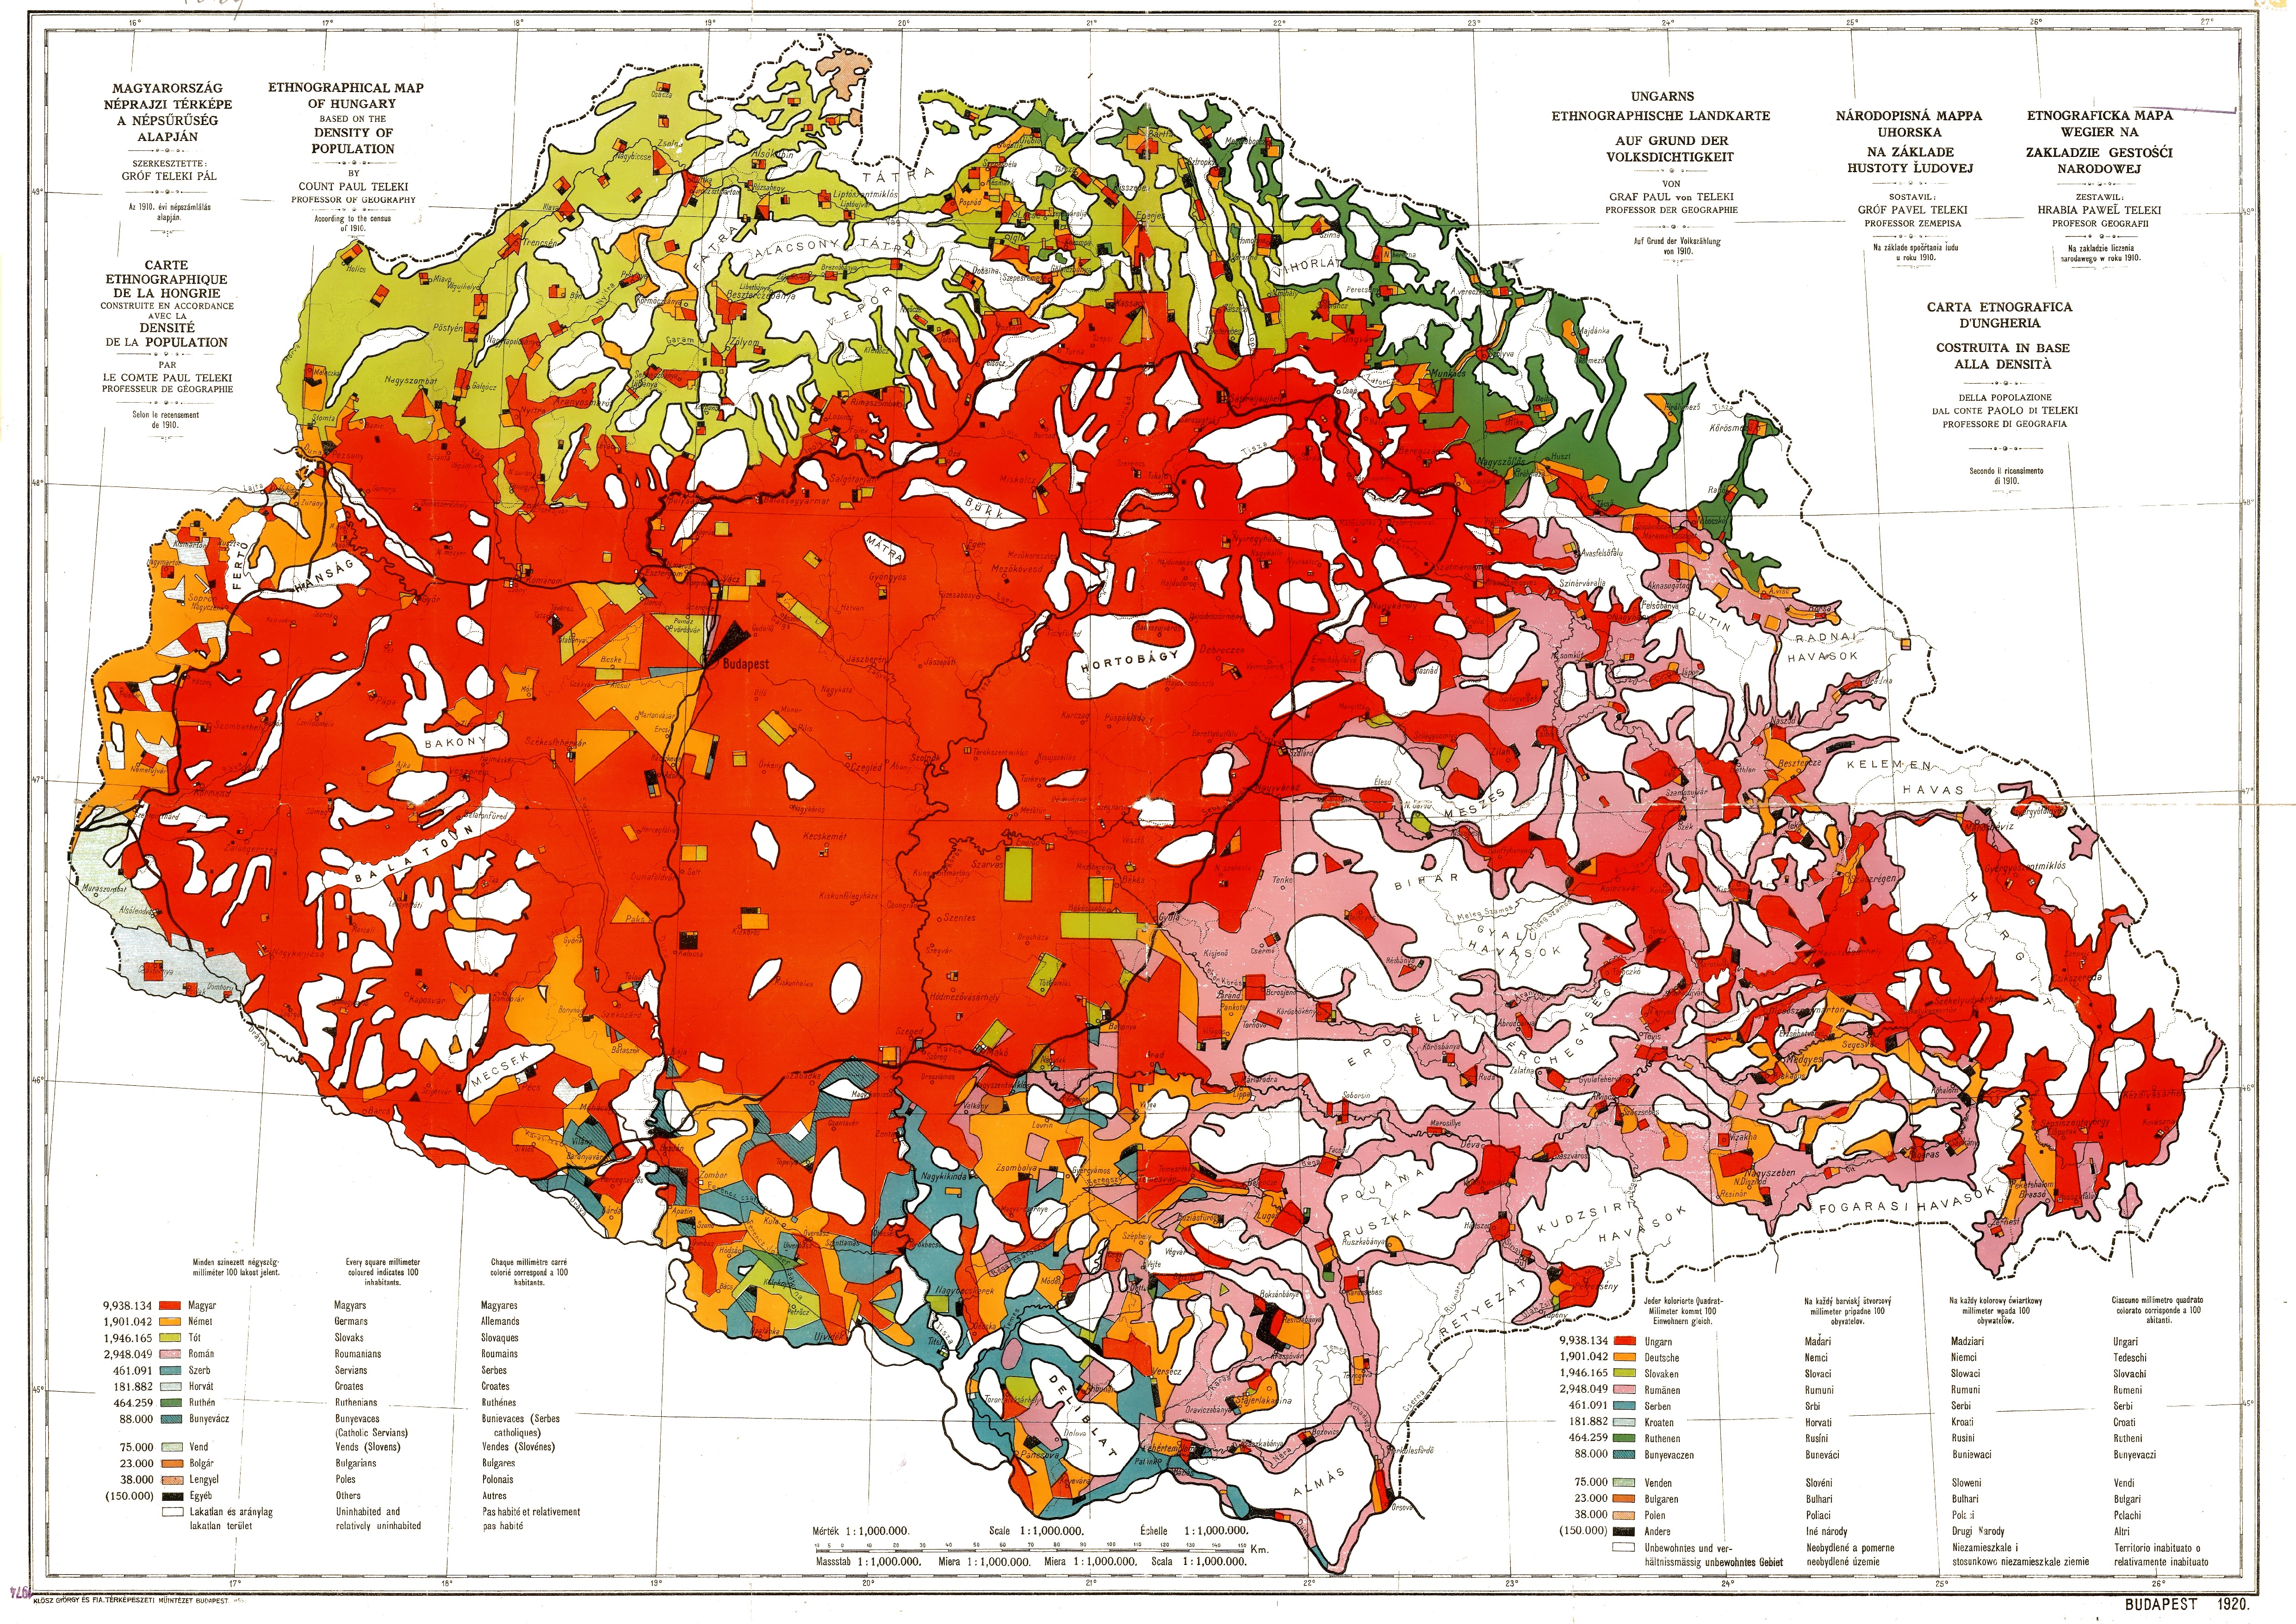
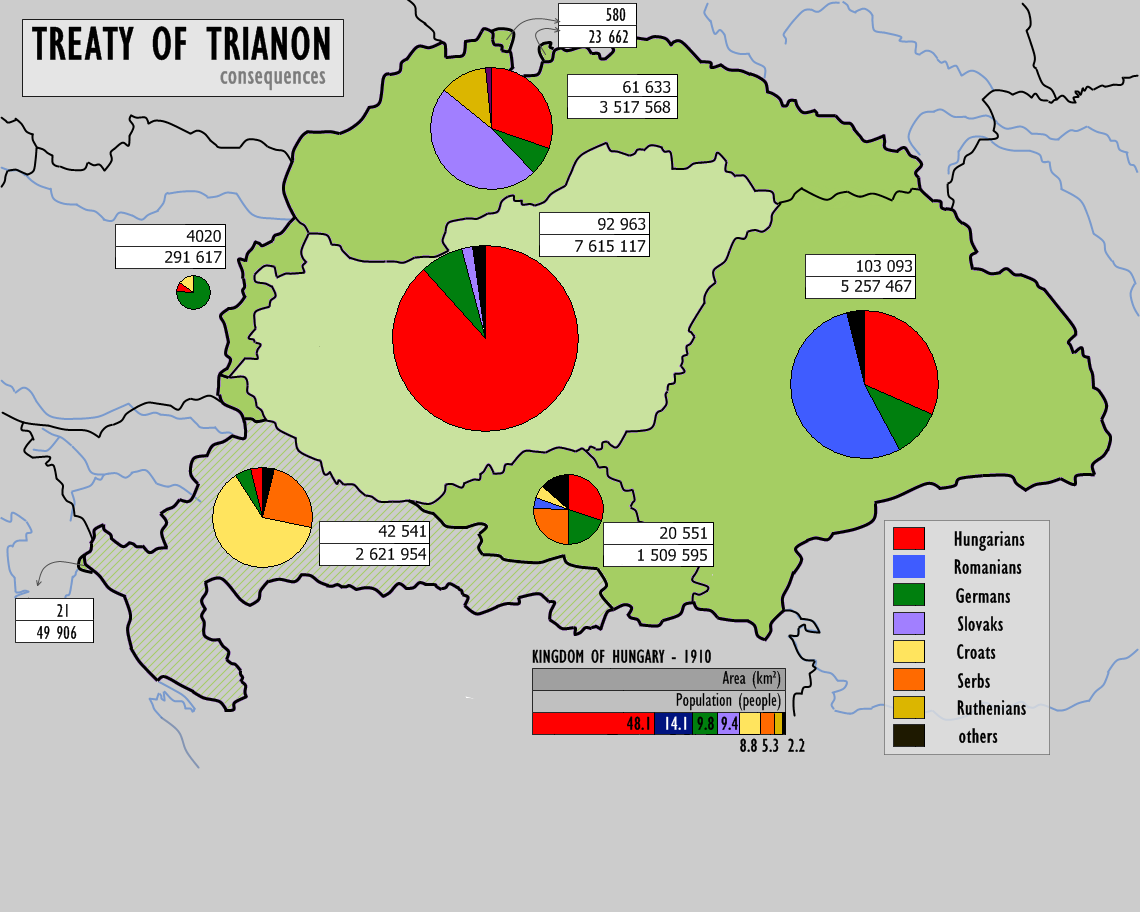
Hungary lost 64% of its total population in consequence of the Treaty of Trianon, which was decreased from 20.9 million to 7.6 million,[56] and 31% (3.3 out of 10.7 million) of its ethnic Hungarians,[53] Hungary lost five of its ten most populous cities.
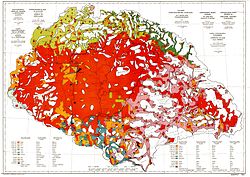 The Red Map.[57][58] Ethnic map of the Hungary proper publicized by the Hungarian delegation. Regions with population density below 20 persons/km2[59] are left blank and the corresponding population is represented in the nearest region with population density above that limit.
 GermansSpaces with a smaller density than 20 persons/sq km
 Difference between the borders of the Kingdom of Hungary within Austria-Hungary and independent Hungary after the Treaty of Trianon. Based on the 1910 census. Administrative Hungary in green, autonomous Croatia-Slavonia grey.
According to the census of 1910, the largest ethnic group in the Kingdom of Hungary were Hungarians, who were 54,5% of the population of Kingdom of Hungary, excluding Croatia-Slavonia. Although the territories of the former Kingdom of Hungary that were assigned by the treaty to neighbouring states in total had a majority of non-Hungarian population, they also included areas of Hungarian majority and significant Hungarian minorities, numbering 3,318,000 in total.
The number of Hungarians in the different areas based on census data of 1910. The present day location of each area is given in parenthesis.
- In Upper Hungary (Slovakia): 885,000 - 30%
- In Transylvania (Romania): 1,662,948 - 31.6%
- In Vojvodina (Serbia): 290,20 - 14.28%
- In Transcarpathia (Ukraine): 183,000 - 30%
- In Croatia: 121,000 - 3.5%
- In Prekmurje (Slovenia): 14,065 - 15%
- In Burgenland (Austria): 26,200 - 9%
Non-Hungarian population in the Kingdom of Hungary, based on 1910 census data
Slovaks, Romanians, Ruthenians, Serbs, Croats and Germans, who represented the majority of the populations of the above-mentioned territories:
- In Upper Hungary (Slovakia, Czechoslovakia): 1,687,977 Slovaks and 1,233,454 others (mostly Hungarians - 886,044, Germans, Ruthenians and Roma) [according to the 1921 census, however, there were 1,941,942 Slovaks and 1,058,928 others]
- In Carpathian Ruthenia (Czechoslovakia): 330,010 Ruthenians and 275,932 others (mostly Hungarians, Germans, Romanians, and Slovaks)
- In Transylvania (Romania): 2,831,222 Romanians (53.8%) and 2,431,273 others (mostly Hungarians - 1,662,948 (31.6%) and Germans - 563,087 (10.7%). The 1919 and 1920 Transylvanian censuses indicate a greater percentage of Romanians (57.1%/57.3%) and a smaller Hungarian minority (26.5%/25.5%)[60]
- In Vojvodina and Croatia-Slavonia (Yugoslavia): 2,756,000 Croats and Serbs and 1,366,000 others (mostly Hungarians and Germans)
- In Prekmurje (Slovenia): 74,199 Slovenes (80%), 14,065 Hungarians (15,2%), 2,540 Germans (2,7%)
- In Burgenland (Austria): 217,072 Germans and 69,858 others (mainly Croatian and Hungarian)
Minorities in post-Trianon Hungary
According to the 1920 census 10.4% of the population spoke one of the minority languages as mother language:
- 551,212 German (6.9%)
- 141,882 Slovak (1.8%)
- 23,760 Romanian (0.3%)
- 36,858 Croatian (0.5%)
- 23,228 Bunjevac and Šokac (0.3%)
- 17,131 Serb (0.2%)
- 7,000 Slovenes (0,08%)
The number of bilingual people was much higher, for example 1,398,729 people spoke German (17%), 399,176 people spoke Slovak (5%), 179,928 people spoke Croatian (2.2%) and 88,828 people spoke Romanian (1.1%). Hungarian was spoken by 96% of the total population and was the mother language of 89%. The percentage and the absolute number of all non-Hungarian nationalities decreased in the next decades, although the total population of the country increased. After Word War II, about 200,000 Germans were deported to Germany according to the decree of the Potsdam Conference. Under the forced exchange of population between Czechoslovakia and Hungary, approximately 73,000 Slovaks left Hungary. After these population movements Hungary became an ethnically almost homogeneous country except the rapidly growing number of Roma people in the second half of the 20th century.
From 1938 to 1945
Hungary expanded its borders into Czechoslovakia, Romania, and Yugoslavia at the outset of the war. These annexations were affirmed under the Munich Agreement (1938), two Vienna Awards (1938 and 1940), and aggression against Yugoslavia and Carpathian Ruthenia (1941). The population of Northern Transylvania, according to the Hungarian census from 1941 counted 53.5% Hungarians and 39.1% Romanians.[61] The territory of Bacska had 789,705 inhabitants, and 45,4% or 47,2% declared themselves to be Hungarian native speakers or ethnic Hungarians.[61] The percentage of Hungarian speakers was 84% in southern Czechoslovakia and 15% in the Sub-Carpathian Rus.
Communist/Socialist era (1949-1990)
According to some authors there was an enforced Magyarization in Communist Hungary.[62]
Numbers about ethnic groups between 1920 and 1980
Ethnic group 1920 1930 1941[Note 1] 1949 1960 1970 1980 Hungarians 7 155 973
89.6 %8 000 335
92.1 %11 881 455
80.9 %9 076 041
98.6 %9 786 038
98.2 %10 166 237
98.5 %10 638 974
99.3 %Germans 550 062
6.9 %477 153
5.5, %533 045
3.6 %22 455
0.2 %50 765
0.5 %35 594
0.4 %11 310
0.1 %Slovaks 141 877
1.8 %104 786
1.2 %175 550
1.2 %25 988
0.3 %30 630
0.3 %21 176
0.2 %9 101
0.1 %Romanians 23 695
0.3 %16 221
0.2 %1 051 026
7.2 %14 713
0.2 %15 787
0.2 %12 624
0.1 %8 874
0.1 %Ruthenians - - 547 770
3.7 %- - - - Croats 58 931
0.7 %47 337
0.5 %12 346
0.1 %20 423
0.2 %33 014
0.3 %17 609
0.2 %13 895
0.1 %Serbs 17 132
0.2 %7 031
0.1 %213 585
1.5 %5 158
0.1 %4 583
0.1 %12 235
0.1 %2 805
0.0%Slovenes 6 087
0.1 %5 464
0.1 %94 000
0.1 %4 473
0.1 %- 4 205
0.0 %1 731
0.0 %Roma 6 989
0.1 %7 841
0.1 %76 209
0.5 %21 387
0.2 %25 633
0.3 %34 957
0.3 %6 404
0.1 %Others 26 123
0.3 %18 946
0.2 %29 210
0.2 %14 161
0.1 %14 534
0.1 %17 462
0.2 %16 369
0.2 %Jewish[Note 2] - - 139 041
0.9 %- - - - Total 7 986 875 8 685 109 14 679 573 9 204 799 9 961 044 10 322 099 10 709 463 Vital statistics
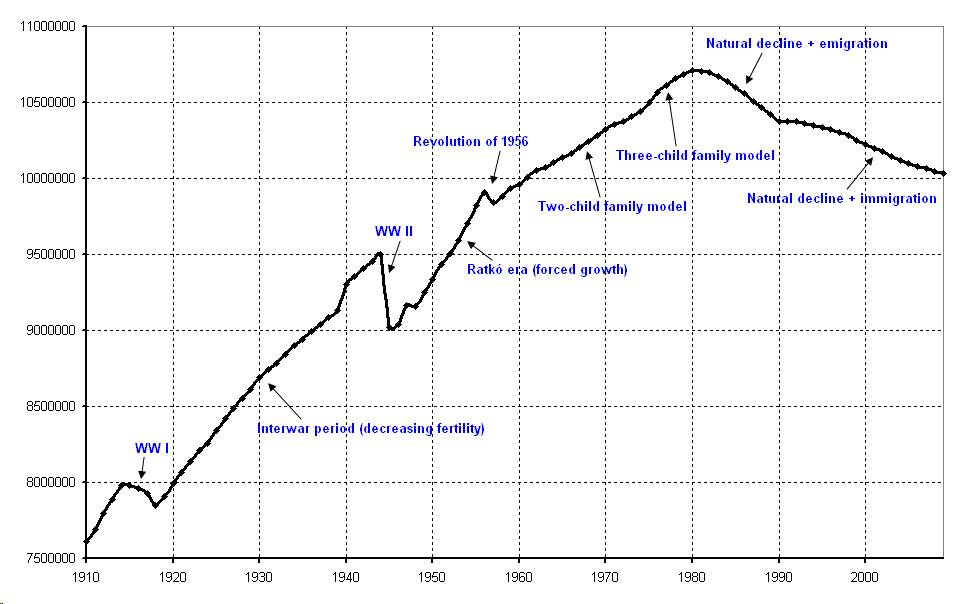
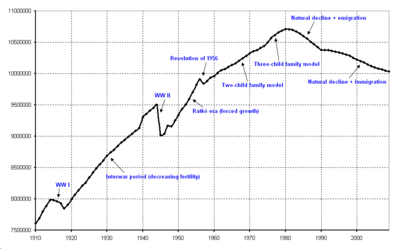 Population of Hungary (1910–2009, with comments)
Unless otherwise indicated, vital statistics are from the Hungarian Statistical Office.[63]
Births and deaths [64][65]
Average population (x 1000) Live births Deaths Natural change Crude birth rate (per 1000) Crude death rate (per 1000) Natural change (per 1000) 1918 128 000 207 000 -79 000 15.3 25.7 -10.4 1919 7 860 217 000 157 000 60 000 27.6 20.0 7.6 1920 7 940 249 000 170 000 79 000 31.4 21.4 10.0 1921 8 020 255 000 170 000 85 000 31.8 21.2 10.6 1922 8 080 249 000 173 000 76 000 30.8 21.4 9.4 1923 8 170 239 000 159 000 80 000 29.2 19.5 9.7 1924 8 220 221 000 168 000 53 000 26.9 20.4 6.5 1925 8 300 235 000 142 000 93 000 28.3 17.1 11.2 1926 8 370 229 000 140 000 89 000 27.4 16.7 10.7 1927 8 490 219 000 151 000 68 000 25.8 17.8 8.0 1928 8 510 225 000 146 000 79 000 26.4 17.2 9.2 1929 8 580 215 000 153 000 62 000 25.1 17.8 7.3 1930 8 660 220 000 134 000 86 000 25.4 15.5 9.9 1931 8 730 207 000 145 000 62 000 23.7 16.6 7.1 1932 8 783 206 000 157 000 49 000 23.4 17.9 5.5 1933 8 845 194 000 130 000 64 000 21.9 14.7 7.2 1934 8 915 194 279 129 049 65 230 21.8 14.5 7.3 1935 8 980 189 479 136 923 52 556 21.1 15.2 5.9 1936 9 040 183 369 128 333 55 036 20.3 14.2 6.1 1937 9 100 182 449 128 049 54 400 20.0 14.1 6.0 1938 9 159 182 206 130 628 51 578 19.9 14.3 5.6 1939 9 217 178 633 124 591 54 042 19.4 13.5 5.9 1940 9 280 185 562 132 735 52 827 20.0 14.3 5.7 1941 9 340 177 047 123 349 53 698 19.0 13.2 5.7 1942 9 392 187 187 136 844 50 343 19.9 14.6 5.4 1943 9 440 173 295 127 158 46 137 18.4 13.5 4.9 1944 9 250 190 000 144 048 45 952 20.5 15.6 5.0 1945 9 055 169 091 211 323 -42 232 18.7 23.3 -4.7 1946 9 042 169 120 135 486 33 634 18.7 15.0 3.7 1947 9 093 187 316 117 537 69 779 20.6 12.9 7.7 1948 9 158 191 907 105 780 86 127 21.0 11.6 9.4 1949 9 249 190 398 105 718 84 680 20.6 11.4 9.2 1950 9 338 195 567 106 902 88 665 20.9 11.4 9.5 1951 9 423 190 645 109 998 80 647 20.2 11.7 8.6 1952 9 504 185 820 107 443 78 377 19.6 11.3 8.2 1953 9 595 206 926 112 039 94 887 21.6 11.7 9.9 1954 9 706 223 347 106 670 116 677 23.0 11.0 12.0 1955 9 825 210 430 97 848 112 582 21.4 10.0 11.5 1956 9 911 192 810 104 236 88 574 19.5 10.5 8.9 1957 9 840 167 202 103 645 63 557 17.0 10.5 6.5 1958 9 882 158 428 97 866 60 562 16.0 9.9 6.1 1959 9 937 151 194 103 880 47 314 15.2 10.5 4.8 1960 9 984 146 461 101 525 44 936 14.7 10.2 4.5 1961 10 029 140 365 96 410 43 955 14.0 9.6 4.4 1962 10 072 130 053 108 273 21 780 12.9 10.7 2.2 1963 10 104 132 335 99 871 32 464 13.1 9.9 3.2 1964 10 135 132 141 100 830 31 311 13.0 9.9 3.1 1965 10 160 133 009 108 119 24 890 13.1 10.6 2.4 1966 10 197 138 489 101 943 36 546 13.6 10.0 3.6 1967 10 223 148 886 109 530 39 356 14.6 10.7 3.8 1968 10 275 154 419 115 354 39 065 15.0 11.2 3.8 1969 10 316 154 318 116 659 37 659 15.0 11.3 3.7 1970 10 338 151 819 120 197 31 622 14.7 11.6 3.1 1971 10 368 150 640 123 009 27 631 14.5 11.9 2.7 1972 10 398 153 625 118 991 34 634 14.8 11.4 3.3 1973 10 432 156 224 123 366 32 858 15.0 11.8 3.1 1974 10 479 186 288 125 816 60 472 17.8 12.0 5.8 1975 10 532 194 240 131 102 63 138 18.4 12.4 6.0 1976 10 589 185 405 132 240 53 165 17.5 12.5 5.0 1977 10 637 177 574 132 031 45 543 16.7 12.4 4.3 1978 10 673 168 160 140 121 28 039 15.8 13.1 2.6 1979 10 698 160 364 136 829 23 535 15.0 12.8 2.2 1980 10 707 148 673 145 355 3 318 13.9 13.6 0.3 1981 10 700 142 890 144 757 -1 867 13.3 13.5 -0.2 1982 10 683 133 559 144 318 -10 759 12.5 13.5 -1.0 1983 10 656 127 258 148 643 -21 385 11.9 13.9 -2.0 1984 10 619 125 359 146 709 -21 350 11.8 13.8 -2.0 1985 10 579 130 200 147 614 -17 414 12.3 14.0 -1.6 1986 10 534 128 204 147 089 -18 885 12.2 14.0 -1.8 1987 10 486 125 840 142 601 -16 761 12.0 13.6 -1.6 1988 10 443 124 296 140 042 -15 746 11.9 13.4 -1.5 1989 10 398 123 304 144 695 -21 391 11.9 13.9 -2.1 1990 10 374 125 679 145 660 -19 981 12.1 14.0 -1.9 1991 10 373 127 207 144 813 -17 606 12.3 14.0 -1.7 1992 10 369 121 724 148 781 -27 057 11.7 14.3 -2.6 1993 10 357 117 033 150 244 -33 211 11.3 14.5 -3.2 1994 10 343 115 598 146 889 -31 291 11.2 14.2 -3.0 1995 10 329 112 054 145 431 -33 377 10.8 14.1 -3.2 1996 10 311 105 272 143 130 -37 858 10.2 13.9 -3.7 1997 10 290 100 350 139 434 -39 084 9.8 13.6 -3.8 1998 10 267 97 301 140 870 -43 569 9.5 13.7 -4.2 1999 10 238 94 645 143 210 -48 565 9.2 14.0 -4.7 2000 10 211 97 597 135 601 -38 004 9.6 13.3 -3.7 2001 10 198 97 047 132 183 -35 136 9.5 13.0 -3.4 2002 10 165 96 804 132 833 -36 029 9.5 13.1 -3.5 2003 10 129 94 647 135 823 -41 176 9.3 13.4 -4.1 2004 10 108 95 137 132 492 -37 355 9.4 13.1 -3.7 2005 10 088 97 496 135 732 -38 236 9.7 13.5 -3.8 2006 10 072 99 871 131 603 -31 732 9.9 13.1 -3.2 2007 10 056 97 613 132 938 -35 325 9.7 13.2 -3.5 2008 10 038 99 149 130 027 -30 878 9.9 13.0 -3.1 2009 10 022 96 450 130 350 -33 900 9.6 13.0 -3.4 2010 10 000 90 350 130 450 -40 100 9.0 13.0 -4.0 Infant mortality rate
The infant mortality rate (IMR) decreased considerably after WW II. In 1949, the IMR was 91.0. The rate decreased to 47.6 in 1960, 35.9 in 1970, 23.2 in 1980, 14.8 in 1990, 9.2 in 2000 and reached an all time low in 2009: 5.1 per 1000 live born children.[34]
Total fertility rates
Year Total Fertility Rate 1900–1901 5.28 1910–1911 4.67 
1920–1921 3.84 1930–1931 2.84 1940–1941 2.48 1948–1949 2.56 
1950–1955 2.73 1955–1960 2.21 1960–1965 1.82 1965–1970 1.98 Year Total Fertility Rate 1970–1975 2.09 1974–1977 2.28 1975–1980 2.12 1980–1985 1.81 1985–1990 1.82 1990–1995 1.73 1995–2000 1.38 2001–2005 1.30 2006–2008 1.34 2009 1.33 Life expectancy at birth
male: 1990: 65.1 years 2001: 68.2 years 2009: 70.1 years
female: 1990: 73.7 years 2001: 76.5 years 2009: 77.9 yearsPresent
The Hungarian census of year 2001
Historical populations Year Pop. ±% 1870 5,011,310 — 1880 5,329,191 +6.3% 1890 6,009,351 +12.8% 1900 6,854,415 +14.1% 1910 7,612,114 +11.1% 1920 7,986,875 +4.9% 1930 8,685,109 +8.7% 1941 9,316,074 +7.3% 1949 9,204,799 −1.2% 1960 9,961,044 +8.2% 1970 10,300,996 +3.4% 1980 10,709,463 +4.0% 1990 10,374,823 −3.1% 2001 10,198,315 −1.7% 2011 9,979,000 −2.2% The census of 2001 recognized Hungarians along with sixteen other ethnic groups. The ethnic composition according to the 2001 census was as follows: (based on self-determination)[69]
- Hungarians: 9,416,045 or 93.2%
- Roma: 190,046 or 1.9%
- Germans: 62,233 or 0.6%
- Slovaks: 17,693 or 0.17%
- Croats: 15,620 or 0.15%
- Romanians: 7,995 or 0.08%
- Other nationalities in Hungary: 20 473 (0,2%)
- Foreign nationality: 16 081 (0,16%)
- No answer, unknown: 570 537 (5,6%)
According to census data, the largest religion in Hungary is Catholicism (54.5% — Roman Catholicism 51.9%; Greek Catholicism 2.6%).[70] There is a significant Calvinist minority (16% of the population) and smaller Lutheran (3%),Baptist (0.2%), ortodox(0.015%) and Jewish (0.1%) minorities. However, these census figures are representative of religious affiliation rather than practice; fewer than 12% of Hungarians attend religious services at least once a week and fewer than 50% at least once a year, while 30% of Hungarians do not believe in God.[71]
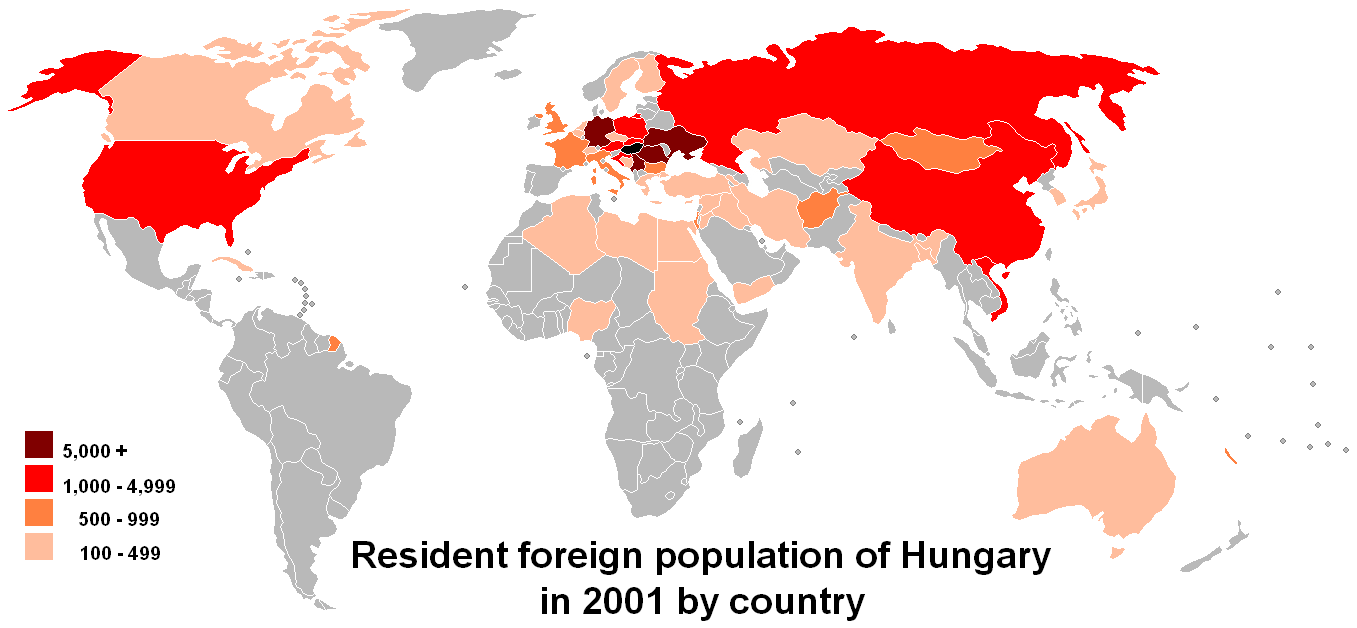
For historical reasons, significant Hungarian minority populations can be found in the surrounding countries, notably in Ukraine (in Transcarpathia), Slovakia, Romania (in Transylvania), and Serbia (in Vojvodina). Austria (in Burgenland), Croatia, and Slovenia (Prekmurje) are also host to a number of ethnic Hungarians.
CIA World Factbook demographic statistics
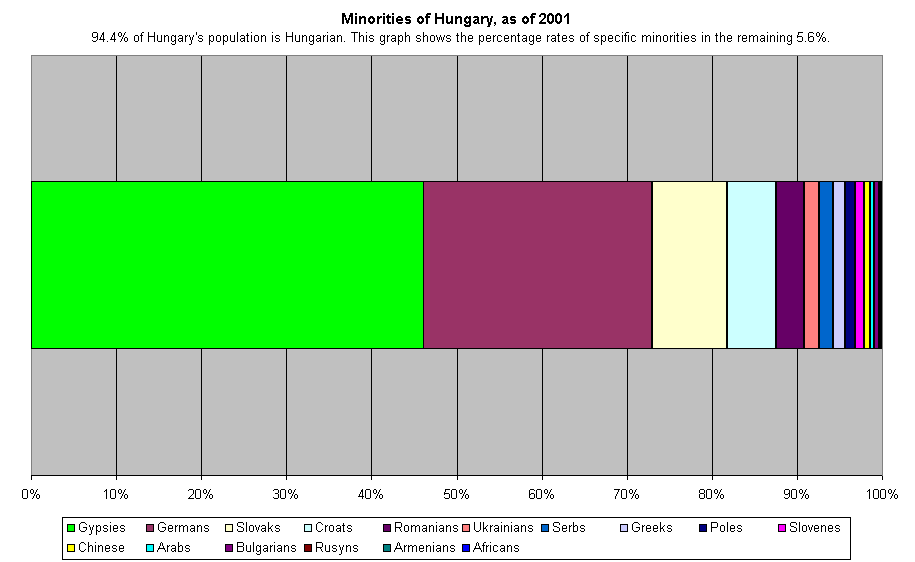
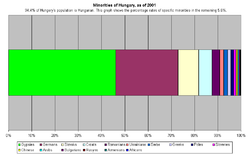 94.4% of the country's inhabitants are Hungarians. The graph shows the share of specific national and ethnic minorities of Hungary in the remainder 5.6%
The following demographic statistics are from the CIA Factbook as of September 2009, unless otherwise indicated.
Population: 9,905,596 (Only Hungarian citizens, 2009 est.)
Age structure:
0–14 years: 15% (male 763,553/female 720,112)
15–64 years: 69.3% (male 3,384,961/female 3,475,135)
65 years and over: 15.8% (male 566,067/female 995,768) (2009 est.)Sex ratio:
at birth: 1.06 male(s)/female
under 15 years: 1.06 male(s)/female
15–64 years: 0.97 male(s)/female
65 years and over: 0.57 male(s)/female
total population: 0.91 male(s)/female (2009 est.)Ethnic groups: Hungarian 93.2%, Roma 1.9%, other or unknown 5,8%.
Religion: According to census data, the largest religion in Hungary is Catholicism (54.5% — Roman Catholicism 51.9%; Greek Catholicism 2.6%). There is a significant Calvinist minority (16% of the population) and smaller Lutheran (3%), and Jewish (0.1%) minorities. However, these census figures are representative of religious affiliation rather than practice; fewer than 12% of Hungarians attend religious services at least once a week and fewer than 50% at least once a year, while 30% of Hungarians do not believe in a God.
Literacy:
definition: age 15 and over can read and write
total population: 99.4%
male: 99.5%
female: 99.3% (2003 est.)- See also : Hungary
Religion
Main article: History of Christianity in HungaryReligious affiliation in Hungary (2001)[72] Denominations Population % of total Catholicism 5,558,901 54.5 Roman Catholics 5,289,521 51.9 Greek Catholics 268,935 2.6 Protestantism 1,985,576 19.5 Calvinists 1,622,796 15.9 Lutherans 304,705 3.0 Baptists 17,705 0.2 Unitarians 6,541 0.1 Other Protestants 33,829 0.3 Orthodox Christianity 15,298 0.1 Other Christians 24,340 0.2 Judaism 12,871 0.1 Other religions 13,567 0.1 Total religions 7,610,553 74.6 No religion 1,483,369 14.5 Did not wish to answer 1,034,767 10.1 Unknown 69,566 0.7 total 10,198,315 100.00 The majority of Hungarians became Christian in the 11th century. Hungary remained predominantly Catholic until the 16th century, when the Reformation took place and, as a result, first Lutheranism, then soon afterwards Calvinism, became the religion of almost the entire population. In the second half of the 16th century, however, Jesuits led a successful campaign of counterreformation among the Hungarians. Orthodox Christianity in Hungary has been the religion mainly of some national minorities in the country, notably, Romanians, Rusyns, Ukrainians, and Serbs.
Faith Church, one of Europe's largest Pentecostal churches, is also located in Hungary. Hungary has historically been home to a significant Jewish community.
Largest cities
Name Population (1949) Top population Population (2010) Agglomeration Status  Budapest
1,590,316 2,059,226 (1980) 1,721,556 2,503,105 (2009) Capital city  Debrecen
115,399 212,235 (1990) 207,270 237,888 (2005) Regional centre, county seat, urban county  Szeged
104,867 169,930 (1990) 169,731 201,307 (2005) Regional centre, county seat, urban county  Miskolc
109,841 208,103 (1980) 169,226 216,470 (2005) Regional centre, county seat, urban county  Pécs
Pécs89,470 170,039 (1990) 157,680 179,215 (2005) Regional centre, county seat, urban county  Győr
Győr69,583 130,478 (2010) 130,478 182,776 (2005) Regional centre, county seat, urban county  Nyíregyháza
56,334 118,795 (2001) 117,832 - County seat, urban county  Kecskemét
61,730 112,233 (2010) 112,233 - County seat, urban county  Székesfehérvár
42,260 108,958(1990) 101,973 - Regional centre, county seat, urban county Language
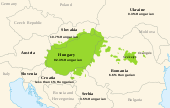 Present-day regions in Europe where the Hungarian language is spoken.
For 93.6% of the population, the mother language is Hungarian. The main minority group are the Roma. Other groups include: Germans, Slovaks, Croats and Bunjevcis (0.2%), Romanians (0.1%), Ukrainians (0.1%), and Serbs (0.1%).[73]
Ethnic groups during history of Hungary
When the Hungarians invaded the Carpathian Basin, it were inhabited by Slavic and Avar peoples. Written sources in the 9th century also suggest that some groups of the Onogurs, and the Bulgars occupied the valley of the river Mureş at the time of the Magyars’ invasion. There is a question whether Romanian population existed in Transylvania during this time. (See Origin of the Romanians)
Kabars
Three Kabar tribes joined to the Hungarians and participated in the Hungarian conquest of Hungary.[46] They settled mostly in Bihar county.
Böszörménys
The Muslim Böszörménys migrated to the Carpathian Basin in the course of the 10th-12th centuries and they were composed of various ethnic groups. Most of them must have arrived from Volga Bulgaria.
Pechenegs
Communities of Pechenegs (Besenyő in Hungarian) lived in the Kingdom of Hungary from the 11-12th centuries. They were most numerous in the county of Tolna.
Oghuz Turks
Smaller groups of Oghuz Turk settlers ('Úzok' or 'Fekete Kunok/Black Cumans' in Hungarian) came to the Carphatian Basin from the middle of the 11th century.[74] They were settled mostly in Barcaság. The city of Ózd got its name after them.
Jassics
The Jassic (Jász in Hungarian) people were a nomadic tribe which settled -with the Cumans- in the Kingdom of Hungary during the 13th century. Their name is almost certainly related to that of the Iazyges. Béla IV, king of Hungary granted them asylum and they became a privileged community with the right of self-government. During the centuries they were fully assimilated to the Hungarian population, their language disappeared, but they preserved their Jassic identity and their regional autonomy until 1876. Over a dozen settlements in Central Hungary (e.g. Jászberény, Jászárokszállás, Jászfényszaru) still bear their name.[75]
Cumans
During the Russian campaign, the Mongols drove some 200,000 Cumans, a nomadic tribe who had opposed them, west of the Carpathian Mountains. There, the Cumans appealed to King Béla IV of Hungary for protection.[76] In the Kingdom of Hungary, Cumans created two regions named Cumania (Kunság in Hungarian): Greater Cumania (Nagykunság) and Little Cumania (Kiskunság), both located the Great Hungarian Plain. Here, the Cumans maintained their autonomy, language and some ethnic customs well into the modern era. According to Pálóczi's estimation originally 70-80,000 Cumans settled in Hungary.[9]
Romanians
The oldest extant documents from Transylvania make reference to Vlachs too. Regardless of the subject of Romanian presence/non-presence in Transylvania prior to the Hungarian conquest, the first written sources about Romanian settlements derive from the 13th century, record was written about Olahteluk village in Bihar county from 1283.[77][78] The 'land of Romanians', Terram Blacorum (1222,1280)[78][79][80][81] showed up in Fogaras and this area was mentioned under different name (Olachi) in 1285.[78] The first appearance of a supposed Romanian name 'Ola' in Hungary derives from a charter (1258).[78] They were significant population in Transylvania, Banat, Maramaros and Partium. Jean W.Sedlar estimates that Vlachs (Romanians) constituted about two-thirds of Transylvania's population in 1241 on the eve of the Mongol invasion,[82] however according to other researches Hungarian ethnic group was in majority in Transylvania before Battle of Mohács.[83]
Slovaks
The Slovak people lived mainly in Upper Hungary, northern parts of the Kingdom of Hungary. Regions of Vojvodina and Banat, Békés county had bigger Slovak groups from the 18th century. After WWII a major population exchange with Czechoslovakia was carried out: about 73,000 Slovaks were transferred to Slovakia, replaced by a comparable number of Hungarians.[84]
Serbs
From the 14th century, escaping from the Ottoman threat, a large number of Serbs migrated to the Hungarian Kingdom. After the Battle of Mohács, most of the territory of Hungary got into Ottoman rule. In that time, especially in the 17th century, many Serb, and other Southern Slavic immigrants settled in Hungary. Most of the Ottoman soldiers in the territory of Hungary were South Slavs (the Janissary). After the Turkish withdrawal, Kingdom of Hungary came under Habsburg rule, a new wave of Serb refugees migrated to the area around 1690, as a consequence of the Habsburg-Ottoman war. In the first half of the 18th century, Serbs and South Slavs were ethnic majority in several cities in Hungary.
Germans
Three waves of German migration can be distinguished in Hungary before the 20th century. The first two waves of settlers arrived to the Hungarian Kingdom in the Middle Ages (11th and 13th centuries) in Upper Hungary and in Southern Transylvania (Transylvanian Saxons).
The third, largest wave of German-speaking immigrants into Hungary occurred after the withdrawal of the Ottoman Empire from Hungarian territory, after the Treaty of Karlowitz. Between 1711 and 1780, German-speaking settlers immigrated to the regions of Southern Hungary, mostly region of Bánát, Bács-Bodrog, Baranya and Tolna counties (as well as into present-day Romania and Yugoslavia), which had been depopulated by the Ottoman wars. At the end of the 18th century, the Kingdom of Hungary contained over one million German-speaking residents (collectively known as Danube Swabians).[85] In 2001, 62,105 people declared to be German in Hungary.[86]
Rusyns
Rusyns had lived mostly in Carpathian Ruthenia, Northeast Hungary, however significant Rusyn population appeared in Vojvodina from the 18th century.
Croats
Croatia was in personal union with Hungary from 1102. Croat communities were spread mostly in the western and southern part of the country and along the Danube, including Budapest.
Poles
The Poles lived at the northern borders of Kingdom of Hungary from the arrival of the Hungarians.
Slovenes
The Slovenes (Vendek in Hungarian) lived in the western part of the Carpathian basin before the Hungarian conquest. In the 11th and 12th century, the current linguistic and ethnic border between the Hungarian and Slovene people was established. Nowadays, they live in Vendvidék (Slovenska krajina in Slovenians) between the Mura and the Rába rivers. In 2001, there were around 5,000 Slovenes in Hungary.
Jews
The first historical document about Jews of Hungary is the letter written about 960 to King Joseph of the Khazars by Hasdai ibn Shaprut, the Jewish statesman of Córdoba, in which he says Jews living in "the country of Hungarin".
Armenians
The first Armenians came to Hungary from the Balkans in the 10 - 11th century.
The Roma minority
Main article: Roma minority of Hungary
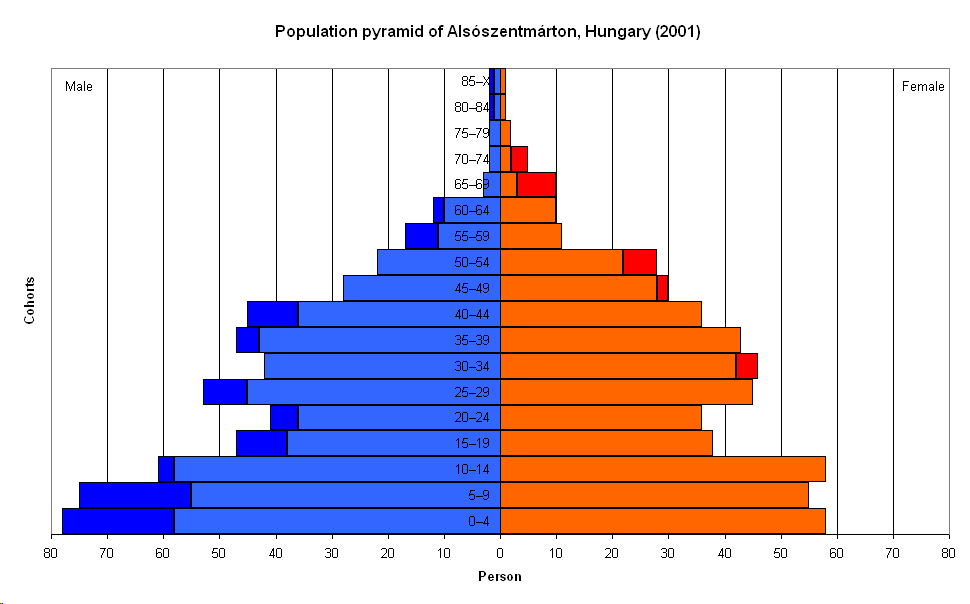
 Population pyramid of Alsószentmárton (100% Romany inhabitants)
The Romani people arrived in Hungary in the fifteenth century from Turkey.[87] Nowadays, the real number of Roma in Hungary is a disputed question. In the 2001 census only 190 046 (2%) called themselves Roma, but experts and Roma organisations estimate that there are between 450,000 and 1,000,000 Roma living in Hungary.[88][89][90][91][92] Since then, the size of the Roma population has increased rapidly. Today every fifth or sixth newborn child belongs to the Roma minority.[93] Based on current demographic trends, a 2006 estimate by Central European Management Intelligence claims that the proportion of the Roma population will double by 2050, putting the percentage of its Roma community at around 14-15% of the country's population.[94]
There are problems related to the Roma minority in Hungary, and the very subject is a heated and disputed topic.
Objective problems:
- Education/bad chances for work: slightly more than 80% of Roma children complete primary education, but only one third continue studies into the intermediate (secondary) level. This is far lower than the more than 90% proportion of children of non-Roma families who continue studies at an intermediate level. Less than 1% of Roma hold higher educational certificates.[95]
- Poverty: most of the Roma people live in significantly worse conditions than others.[96]
- Bad health conditions: life expectancy is about 10 years less compared to non-Romas
- Lack of debate regarding the subject: academic researchers and members of the mainstream press disregard any critics and study the subject in the canonical viewpoint. Critics don't have the funds necessary to perform alternative studies.
Greeks
Greeks migrated to Kingdom of Hungary from the 15th and 16th centuries. Mass migrations did not occur until the 17th century,[97] the largest waves being in 1718 and 1760-1770;[98] they were primarily connected to the economic conditions of the period.[97] It is estimated that 10,000 Greeks emigrated to Hungary in the second half of the 18th century.[98]
Bulgarians
See also: Bulgarians in HungaryThe town of Szentendre and the surrounding villages were inhabited by Bulgarians since the Middle Ages. However, present day Bulgarians are largely descended from gardeners who migrated to Austria-Hungary from the 18th century.
See also
- Hungarian diaspora
- Demographics of the Kingdom of Hungary
- History of Hungary
- Demographic history of Syrmia
- Magyarization
Notes
- ^ The 1941 data refer to the Kingdom of Hungary after the territorial changes regarding North-Transylvania and other territories, all of which had been part of the Kingdom of Hungary until 1920.
- ^ Except in the year 1941, Jewish people were not recognized as a minority, but only as a religion — assuredly, many Jews considered themselves as belonging to one of the recognized minorities.
References
KSH, vital statistics, 1960-2011
- ^ a b c d A Country Study: Hungary. Federal Research Division, Library of Congress. http://lcweb2.loc.gov/cgi-bin/query/r?frd/cstdy:@field(DOCID+hu0013). Retrieved 2009-03-06.
- ^ Eurasian studies yearbook , Volume 78 p. 26 [1]
- ^ Eurasian studies yearbook, Volume 78 p. 21
- ^ a b Edgar C. Polomé, Essays on Germanic religion, Institute for the Study of Man, 1989, p. 150 [2]
- ^ The Kingfisher History Encyclopedia
- ^ The Encyclopedia Americana
- ^ a b c d Hungary. (2009). In Encyclopædia Britannica. Retrieved May 11, 2009, from Encyclopædia Britannica Online: http://www.britannica.com/EBchecked/topic/276730/Hungary
- ^ a b Marcell Sebők, The man of many devices, who wandered full many ways--: festschrift in honour of János M. Bak, Central European University Press, 1999, p. 658
- ^ a b Nóra Berend, At the gate of Christendom: Jews, Muslims, and "pagans" in medieval Hungary, c. 1000-c. 1300, Cambridge University Press, 2001, pp. 63-72
- ^ a b c d e f Historical World Atlas. With the commendation of the Royal Geographical Society. Carthographia, Budapest, Hungary, 2005. ISBN 963-352-002-9CM
- ^ Peter Purton, A History of the Late Medieval Siege, 1200-1500, Boydell & Brewer, 2009, p. 15
- ^ a b Tore Nyberg, Lars Bisgaard, Medieval spirituality in Scandinavia and Europe: a collection of essays in honour of Tore Nyberg, Odense University Press, 2001, p. 170
- ^ a b Josiah Cox Russell, Late ancient and medieval population, American Philosophical Society, 1958, p. 100
- ^ a b György Enyedi, Hungary: an economic geography, Westview Press, 1976, p. 23
- ^ Miklós Molnár, A concise history of Hungary, Cambridge University Press, 2001, p. 42
- ^ a b Elena Mannová, Blanka Brezováková, A concise history of Slovakia, Historický ústav SAV, 2000, p. 88
- ^ Joseph Slabey Rouček, Contemporary Europe: a study of national, international, economic, and cultural trends. A symposium, D. Van Nostrand Co., 1947, p. 424
- ^ a b c M. L. Bush, Servitude in modern times, Wiley-Blackwell, 2000, p. 143
- ^ Éva Molnár, Hungary: essential facts, figures & pictures, MTI Media Data Bank, 1995
- ^ a b c Lauren S. Bahr, Bernard Johnston (M.A.), Collier's encyclopedia: with bibliography and index, Volume 12, P.F. Collier, 1993, p. 381-383
- ^ a b c Raphael Patai, The Jews of Hungary: history, culture, psychology, Wayne State University Press, 1996, p. 201
- ^ a b c Zoltán Halász, Hungary: a guide with a difference, Corvina Press, 1978, pp. 20-22
- ^ Joseph Held, Hunyadi: legend and reality, East European Monographs, 1985, p. 59
- ^ a b George Richard Potter, The New Cambridge modern history: The Renaissance, 1493-1520, CUP Archive, 1971, p. 405 [3]
- ^ a b The New review, Volume 6, World Federation of Ukrainian Former Political Prisoners and Victims of the Soviet Regime, A. Pidhainy., 1966, p. 25 [4]
- ^ Leslie Konnyu, Hungarians in the United States: an immigration study, American Hungarian Review, 1967, p. 4 [5]
- ^ László Kósa, István Soós, A companion to Hungarian studies, Akadémiai Kiadó, 1999, p. 16 [6]
- ^ Teppo Korhonen, Helena Ruotsala, Eeva Uusitalo, Making and breaking of borders: ethnological interpretations, presentations, representations, Finnish Literature Society, 2003, p.39 [7]
- ^ Andrew L. Simon, Made in Hungary: Hungarian contributions to universal culture, Simon Publications LLC, 1998, p. 17 [8]
- ^ Carlile Aylmer Macartney, The Habsburg Empire, 1790-1918, Macmillan, 1969, p. 79 [9]
- ^ The spirit of Hungary: a panorama of Hungarian history and culture, Stephen Sisa, Vista Books, 1990, p. 103 [10]
- ^ Gábor Ágoston, Bruce Alan Masters, Encyclopedia of the Ottoman Empire, Infobase Publishing, 2009, p. 258 [11]
- ^ Domokos G. Kosáry, A history of Hungary, The Benjamin Franklin bibliophile society, 1941, p. 79 [12]
- ^ a b c Michael Hochedlinger, Austria's wars of emergence: war, state and society in the Habsburg monarchy, 1683-1797, Pearson Education, 2003, p. 21
- ^ a b c Stephen Denis Kertesz, Diplomacy in a whirlpool: Hungary between Nazi Germany and Soviet Russia, Greenwood Press, 1974, p. 191
- ^ a b The Ottomans and the Balkans: a discussion of historiography By Fikret Adanır, Suraiya Faroqhi p.333 [13]
- ^ a b István György Tóth, Gábor Ágoston, Millenniumi magyar történet: Magyarország története a honfoglalástól napjainkig, Osiris, 2001, p. 321
- ^ a b Rhoads Murphey, Ottoman warfare, 1500-1700, Rutgers University Press, 1999, p. 174
- ^ a b Klára Papp – János Barta Jr., Minorities research 6., Kisebbségkutatás (Minorities Studies and Reviews)
- ^ Lonnie Johnson, Central Europe: enemies, neighbors, friends, Oxford University Press, 2002, p. 100
- ^ Eric H. Boehm, Historical abstracts: Modern history abstracts, 1450-1914, Volume 49, Issues 1-2, American Bibliographical Center of ABC-Clio, 1998, p. 331
- ^ Imre Wellmann, A magyar mezőgazdaság a XVIII. században, Akadémiai Kiadó, 1979, p. 13
- ^ Rudolf Andorka, Determinants of fertility in advanced societies, Taylor & Francis, 1978, p. 93
- ^ a b David I. Kertzer, Aging in the past: demography, society, and old age, University of California Press, 1995, p. 130
- ^ M. L. Bush, Rich noble, poor noble, Manchester University Press ND, 1988, p. 19 [14]
- ^ a b Peter F. Sugar, Péter Hanák, Tibor Frank, A History of Hungary, Indiana University Press, 1994 pp. 11-143.[15]
- ^ Encyclopedia Americana, Volume 14, Americana Corp., 1966, p. 509
- ^ Jonathan Dewald, Europe 1450 to 1789: encyclopedia of the early modern world, Charles Scribner's Sons, 2004, p. 230 [16]
- ^ Arthur J. Sabin, Red Scare in Court: New York Versus the International Workers Order, University of Pennsylvania Press, 1999, p. 4 [17]
- ^ Thomas Spira, German-Hungarian relations and the Swabian problem: from Károlyi to Gömbös, 1919-1936, East European quarterly, 1977, p. 2
- ^ a b Robert Bideleux, Ian Jeffries, A history of Eastern Europe: crisis and change, Taylor & Francis, 2007, page 259, ISBN 978-0-415-36627-4
- ^ a b Paul Lendvai, The Hungarians: a thousand years of victory in defeat, C. Hurst & Co. Publishers, 2003, p.286 [18]
- ^ a b c Richard C. Frucht, Eastern Europe: an introduction to the people, lands, and culture / edited by Richard Frucht, Volume 1, ABC-CLIO, 2005, p. 356 [19]
- ^ Carl Cavanagh Hodge, Encyclopedia of the Age of Imperialism, 1800-1914: A-K, Greenwood Publishing Group, 2008, p. 306 [20]
- ^ A népesség változó etnikai arculata Magyarország mai területén (map+datas+essay) (Kocsis Károly, Bottlik Zsolt, Hungarian Academy of Sciences - Földrajztudományi Kutatóintézet, Budapest, 2009, ISBN 978-963-9545-19-9)
- ^ "Open-Site:Hungary". http://open-site.org/Regional/Europe/Hungary.
- ^ "Teleki Pál – egy ellentmondásos életút" (in Hungarian). National Geographic Hungary. 2004-02-18. http://www.geographic.hu/index.php?act=napi&id=1707. Retrieved 2008-01-30.
- ^ "A kartográfia története" (in Hungarian). Babits Publishing Company. http://mek.oszk.hu/02100/02185/html/868.html. Retrieved 2008-01-30.
- ^ Spatiul istoric si etnic romanesc, Editura Militara, Bucuresti, 1992
- ^ Árpád Varga. "Hungarians in Transylvania between 1870 and 1995". http://www.kia.hu/konyvtar/erdely/erdang.htm.
- ^ a b Károly Kocsis, Eszter Kocsisné Hodosi, Ethnic Geography of the Hungarian Minorities in the Carpathian Basin, Simon Publications LLC, 1998, p. 116-153 [21]
- ^ Google Books
- ^ Hungarian Central Statistical Office
- ^ B.R. Mitchell. European historical statistics, 1750-1975.
- ^ http://unstats.un.org/unsd/demographic/products/dyb/dybsets/1948%20DYB.pdf United nations. Demographic Yearbook 1948
- ^ Magyarország a XX. században / Születési mozgalom és termékenység. Mek.niif.hu. Retrieved on 2010-10-19.
- ^ Budapesti Közgazdaságtudományi és Államigazgatási Egyetem. (PDF) . Retrieved on 2010-10-19.
- ^ [22]
- ^ Population by nationalities, 2001 census (English)
- ^ Population by religions, 2001 census (English)
- ^ World Walues Survey
- ^ "18. Demographic data – Hungarian Central Statistical Office". Nepszamlalas.hu. http://www.nepszamlalas.hu/eng/volumes/18/tables/load1_26.html. Retrieved 2008-11-21.
- ^ "Population Census 2001 – National and county data – Summary Data". Nepszamlalas.hu. http://www.nepszamlalas.hu/eng/volumes/06/00/tabeng/1/load01_10_0.html. Retrieved 2008-11-21.
- ^ Alfried Wieczorek, Hans-Martin Hinz, Europe's centre around AD 1000, Volume 1, Theiss, 2000, p.135 [23]
- ^ National and historical symbols of Hungary
- ^ Mongol Invasions: Battle of Liegnitz, HistoryNet
- ^ György Fejér, Codex diplomaticus Hungariae ecclesiasticus ac civilis, Volume 7, typis typogr. Regiae Vniversitatis Vngaricae, 1831 [24]
- ^ a b c d Tamás Kis, Magyar nyelvjárások, Volumes 18-21, Nyelvtudományi Intézet, Kossuth Lajos Tudományegyetem (University of Kossuth Lajos). Magyar Nyelvtudományi Tanszék, 1972, p. 83 [25]
- ^ Dennis P. Hupchick, Conflict and chaos in Eastern Europe, Palgrave Macmillan, 1995 p. 58 [26]
- ^ István Vásáry, Cumans and Tatars: Oriental military in the pre-Ottoman Balkans, 1185-1365, Cambridge University Press, 2005, p. 28 [27]
- ^ Heinz Stoob, Die Mittelalterliche Städtebildung im südöstlichen Europa, Böhlau, 1977, p. 204 [28]
- ^ Sedlar, Jean W.: East Central Europe in the Middle Ages, 1000-1500; University of Washington Press, 1994; ISBN 0-295-97290-4, page 8
- ^ Károly Kocsis, Eszter Kocsisné Hodosi, Ethnic Geography of the Hungarian Minorities in the Carpathian Basin, Simon Publications LLC, 1998, p. 102 (Table 19) [29]
- ^ Janusz Bugajski, Ethnic politics in Eastern Europe: a guide to nationality policies, organizations, and parties M.E. Sharpe, 1995, p. 402
- ^ Sue Clarkson. "History of German Settlements in Southern Hungary". Feefhs.org. http://feefhs.org/BANAT/BHISTORY.HTML. Retrieved 20 September 2009.
- ^ "18. Demographic data" – Hungarian Central Statistical Office[dead link]
- ^ Huping Ling, Emerging voices: experiences of underrepresented Asian Americans, Rutgers University Press, 2008, p. 111 [30]
- ^ Stratégiai Audit 2005 - DEMOS Magyarország. Demos.hu (2009-11-06). Retrieved on 2010-10-19.
- ^ Hungary acknowledges the need for progress regarding its population of 500,000 to 1 million Roma, or Gypsies
- ^ Hungary would put the number of Roma in the country at 800,000–1,000,000, or up to 10% of the total population of Hungary. European Rights Roma Center
- ^ The New York City Times: Roma make up an estimated 8 to 10 percent of Hungary’s population
- ^ The christian science monitor: "[...] the Roma, who account for between 8 and 10 percent of Hungary's 10 million people."
- ^ [31] "Ma minden ötödik-hatodik születendő gyermek cigány."
- ^ [32] "A CEMI kalkulációja szerint a romák száma a mai 700 ezerről 2050-re 1,2 millióra nőhet. Ezen idő alatt a nem roma népesség száma 9,5 millióról 7,6 millióra csökken. Így a romák mai mintegy 7 százalékos aránya megduplázódhat és elérheti a 14-15 százalékot."
- ^ [33] "Az érettségit megszerzők aránya azonban 0,5%-ról csupán 1,5%-ra nőtt, felsőfokú végzettséget pedig elenyésző számban szereztek.", "A felsőoktatásban tanulók aránya az 1993-as kutatás adatai szerint mindössze 0,22 ezrelék."
- ^ Index - Romák a szegénység csapdájában
- ^ a b "Oi ellinikes paroikies tis Kentrikis Evropis". Greek Migration to Europe (15th-19th c.). http://www2.fhw.gr/projects/migration/15-19/gr/v2/central_europe.html. Retrieved 2007-02-18.
- ^ a b "Oi ellinikes paroikies stin Ungaria". Greek Migration to Europe (15th-19th c.). http://www2.fhw.gr/projects/migration/15-19/gr/v2/mayar.html. Retrieved 2007-02-18.
External links
 Hungary topics
History Prehistory · Pannonia · Medieval Kingdom of Hungary · Habsburg Kingdom of Hungary · Austria-Hungary · World War I · Between the World Wars · World War II · The People's Republic
Geography Governance Politics Economy Companies · Hungarian forint · Hungarian National Bank · Telecommunications · Tourism · Transport · HealthcareSociety Culture Demographics of Europe Sovereign
states- Albania
- Andorra
- Armenia
- Austria
- Azerbaijan
- Belarus
- Belgium
- Bosnia and Herzegovina
- Bulgaria
- Croatia
- Cyprus
- Czech Republic
- Denmark
- Estonia
- Finland
- France
- Georgia
- Germany
- Greece
- Hungary
- Iceland
- Ireland
- Italy
- Kazakhstan
- Latvia
- Liechtenstein
- Lithuania
- Luxembourg
- Macedonia
- Malta
- Moldova
- Monaco
- Montenegro
- Netherlands
- Norway
- Poland
- Portugal
- Romania
- Russia
- San Marino
- Serbia
- Slovakia
- Slovenia
- Spain
- Sweden
- Switzerland
- Turkey
- Ukraine
- United Kingdom
- (England
- Northern Ireland
- Scotland
- Wales)
- Vatican City
States with limited
recognition- Abkhazia
- Kosovo
- Nagorno-Karabakh
- Northern Cyprus
- South Ossetia
- Transnistria
Dependencies
and other territories- Åland
- Faroe Islands
- Gibraltar
- Guernsey
- Jan Mayen
- Jersey
- Isle of Man
- Svalbard
Other entities - European Union
Categories:- Demographics of Hungary
- Hungarian society


Wikimedia Foundation. 2010.