- Demographics of Croatia
-
Demographics of Croatia 
Population of Croatia (in thousands) from 1857–2011Population:  4 290 612 (31 March 2011)
Growth rate: −6.3 per 1,000 pop. (2001)Birth rate:  10.1 per 1,000 pop. (2009)
Death rate:  11.8 per 1,000 pop. (2009)
Life expectancy: –male: 71.1 years (2001)–female: 78.1 years (2001)Fertility rate: 1.50 children born/woman (2009)Infant mortality rate:  5.3 deaths/1,000 infants (2009)
Net migration rate: -0.3 migrant(s)/1,000 pop. (2009)Age structure: 0-14 years: 15.3% (2009)15-64 years: 67.5% (2009)65-over: 17.3% (2009)Sex ratio: At birth: 1.06 male(s)/female Under 15: 1.06 male(s)/female 15-64 years: 0.99 male(s)/female 65-over: 0.64 male(s)/female Nationality: Nationality: noun: Croatian(s) adjective: Croatian Major ethnic: Croats (89.6%) (2001)Minor ethnic: Serbs (4.5%) (2001) and
others <1% individually (2001)Language: Official: Croatian at national level;
Czech, Hungarian, Italian, Ruthenian, Serbian and Slovakian are in official use in some local government areasSpoken: Croatian, languages of the minorities The demographic features of the population of Croatia include statistical data collected through censuses, normally conducted in ten-year intervals, that have been analysed by various statistical bureaus since the 1850s. Since the 1990s, this has been done by the Croatian Bureau of Statistics. The latest census in Croatia was performed in April 2011. The permanent population of Croatia at the 2011 census had reached 4.29 million. Population density equals 75.8 inhabitants per square kilometre, and the overall life expectancy in Croatia at birth is 75.7 years. The total fertility rate of 1.50 children per mother in the nation is one of the lowest in the world. Since 1991, Croatia's death rate continuously exceeds its birth rate. The population rose steadily from 2.1 million in 1857 until 1991, when it peaked at 4.7 million, with the exception of censuses taken in 1921 and 1948, following the two world wars. The natural growth rate of the population is currently negative, with the demographic transition completed in the 1970s. In terms of age structure, the population is dominated by the 15–64 year old segment. The median age of the population is 41.4, and the gender ratio of the total population is 0.93 males per 1 female.
Croatia is inhabited mostly by Croats (89.6%), while minorities include Serbs (4.5%), and 21 other ethnicities, none of which comprises more than 1% of the total population individually. The demographic history of Croatia is marked by significant migrations, beginning with the arrival of the Croats in the area between the 6th and the 9th centuries. After the personal union of Croatia and Hungary, and the subsequent joining of the Habsburg Empire, the Hungarian and German speaking populations of Croatia gradually grew. This trend continued to the 20th century. Ottoman conquests set off a westward migration of parts of the population and the Habsburg rulers invited the Orthodox populations of Bosnia and Serbia to provide Croatian Military Frontier service. The Serb migration peaked in 1690 and 1737–39. Following the 17th and the 18th century conquests, Venetian rule in Istria and in Dalmatia sparked the growth of Italian speaking population in the regions.
After the collapse of Austria-Hungary, the Hungarian population declined. The period between 1890 and the World War II was marked by significant economic migration to the United States, Canada and South America, during which more than half a million people left the country. During and immediately after World War II, the German speaking population was forced or compelled to leave—reducing their number dramatically. A similar fate was suffered by the Italian population. The 1940s and the 1950s in Yugoslavia were marked by colonisation of settlements where the Germans once lived, by people from mountainous parts of Bosnia and Herzegovina, Serbia and Montenegro, as well as migrations to cities, spurred on by industrialisation. In the 1960s and 1970s, another wave of economic migrants left for Canada, Australia, New Zealand and Western Europe. The most recent significant migrations came as a result of the Croatian War of Independence when hundreds of thousands were displaced, many of whom never returned. The population also sustained major losses in the 20th century, especially in the two world wars.
The Croatian language is the official language of Croatia, but minority languages are officially used in local government units where more than a third of the population consists of national minorities, or where they are decreed by local legislation. Croatian is declared as the native language by 96% of the population. A 2009 survey revealed that 78% of Croatians claim knowledge of at least one foreign language—most often English.
The main religions of Croatia are Roman Catholicism (87.8%), Orthodox Christianity (4.4%) and Islam (1.3%). Literacy in Croatia stands at 98.1%. The proportion of the population aged 15 and over attaining academic degrees grew rapidly since 2001, doubling and reaching 16.7% by 2008. An estimated 4.5% of the GDP is spent for education. Primary and secondary education are available in Croatian and in languages of recognised minorities. Croatia has a universal health care system, whose roots can be traced back to 1891, when legislation provided a form of mandatory insurance of all factory workers and craftsmen. In 2010, Croatia spent 6.9% of its GDP on healthcare.
Contents
Population
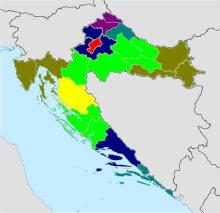 2011 Croatian population density by county in persons per km²:
<30 30-49 50-69 70-89 90-119 120-200 >200 2009 Croatian population pyramid
With a population of 4.29 million in 2011, Croatia ranks 125th in the world by population.[1] Its population density is 75.8 inhabitants per square kilometre. The overall life expectancy in Croatia at birth is 75.7 years. The total fertility rate of 1.50 children per mother is one of the lowest in the world. Since 1991, Croatia's death rate has continuously exceeded its birth rate.[2]. The Croatian Bureau of Statistics forecast that the population may even shrink to 3.1 million by 2051, depending on the actual birth rate and the level of net migration.[3] The population of Croatia rose steadily from 2.1 million in 1857 until 1991, when it peaked at 4.7 million, with the exception of censuses taken in 1921 and 1948, i.e. following two world wars.[2] The natural growth rate of the population is currently negative, with the demographic transition completed in the 1970s.[4][5]
One explanation for the recent population decrease is the Croatian War of Independence. During the war, large sections of the population were displaced and emigration increased. In 1991, in predominantly Serb areas, more than 400,000 Croats and other non-Serbs were either removed from their homes by the Croatian Serb forces or fled the violence.[6] In 1995, during the final days of the war, more than 120,000 and perhaps as many as 200,000 Serbs fled the country before the arrival of Croatian forces during Operation Storm.[7][8] Within a decade following the end of the war, only 117,000 Serb refugees returned out of the 300,000 displaced during the entire war.[9] Most of Croatia's remaining Serbs never lived in areas occupied in the Croatian War of Independence. Serbs have been only partially re-settled in the regions they previously inhabited, while some of the settlements previously inhabited by Serbs were settled by Croat refugees from Bosnia and Herzegovina, mostly from Republika Srpska.[10][11]
In 2009, there were 44,577 live births in Croatia, comprising 22,877 male and 21,700 female children. Virtually all of those were performed in medical facilities; only 34 births occurred elsewhere. Out of the total number, 38,809 children were born in wedlock or within 300 days after the end of the marriage, and the average age of mothers at the birth of their first child was 27 years and 5 months. General fertility rate, i.e. number of births per 1,000 women aged 15–49 is 42.9, with the age specific rate peaking at 101.0 per million for women aged 25–29. In 2009, 52,414 persons died in Croatia, 48.5% of whom died in medical facilities and 90.0% of whom were receiving medical treatment at the time. Circulatory system diseases and neoplasms were the primary causes of death in the country, with 26,235 and 13,280 deaths respectively. In the same year, there were 2,986 violent deaths, including 2,121 due to accidents. The latter figure includes 616 deaths in traffic accidents. In 2009, the birth rate was 10.1 per mille, exceeded the by mortality rate of 11.8 per mille. The infant mortality rate was 5.3 per mille in 2009.[2] In terms of age structure, the population of Croatia is dominated by the 15–64 year older segment (68.1%), while the size of the population younger than 15 and older than 64 is relatively small (15.1% and 16.9% respectively). The median age of the population is 41.4. The sex ratio of the population is 1.06 males per 1 female at birth and up to 14 years of age, and 0.99 males per 1 female between the ages of 15 and 64. But at ages over 64 the ratio is 0.64 males per 1 female. The ratio for the total population is 0.93 males per 1 female.[5]
In contrast to the shrinking native population, since the late 1990s there has been a positive net migration into Croatia, reaching a level of more than 7,000 net immigrants in 2006.[12] In recent years, the Croatian government has been pressured each year to add 40% to work permit quotas for foreign workers.[13] In accordance with its immigration policy, Croatia is also trying to entice emigrants to return.[14]
There were 8,468 immigrants in Croatia in 2009, more than half of them (57.5%) coming from Bosnia and Herzegovina, a sharp decline from the previous year's 14,541. In the same year, there were 9,940 emigrants from the country, 44.8% of them leaving to Serbia. The number of emigrants represents a substantial increase compared to the figure of 7,488 recorded in 2008. In 2009, the net migration to and from abroad peaked in the Sisak-Moslavina County (-1,093 persons) and the city of Zagreb (+830 persons).
In 2009, a total of 22,382 marriages were performed in Croatia as well as 5,076 divorces. The 2001 census recorded 1.47 million households in the country.[2]
Census data
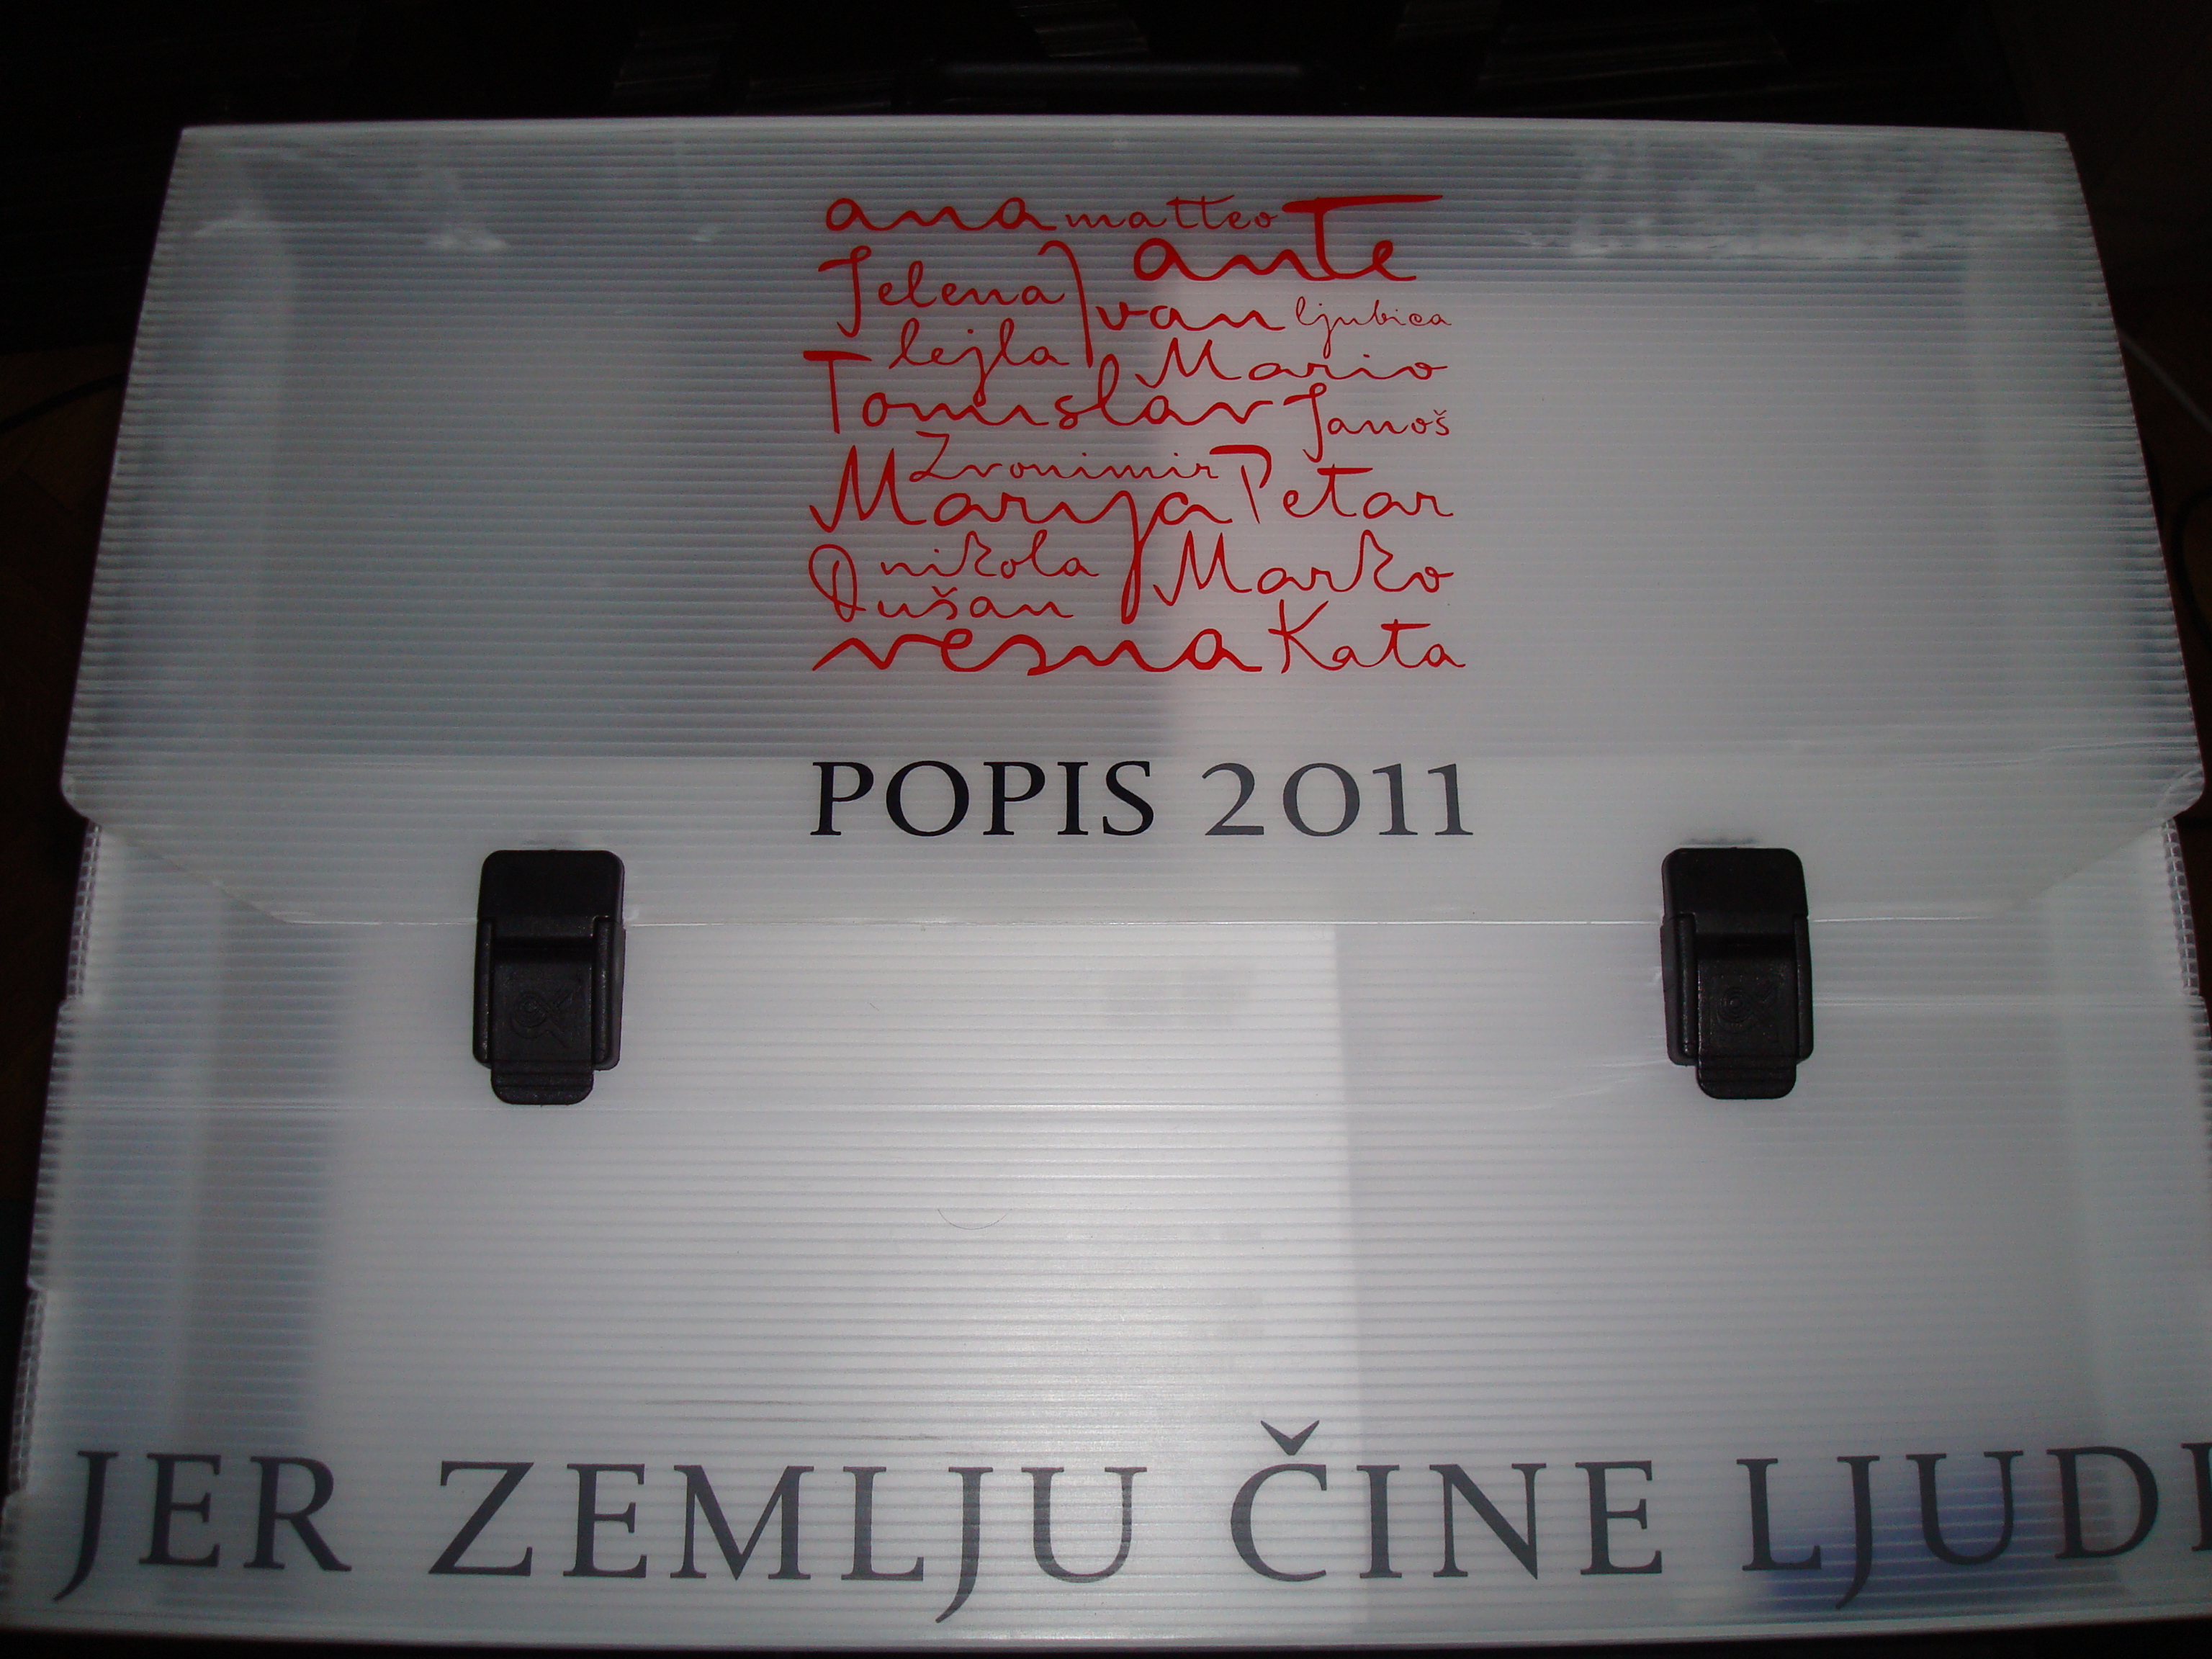
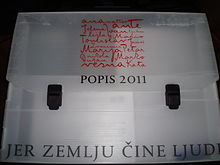 An official briefcase used by the Croatian Bureau of Statistics census takers for the purposes of the 2011 census
The first modern population census in the country was conducted in 1857, and 15 more have been performed since then. Since 1961 the censuses are conducted in regular ten-year intervals, with the latest one in 2011.[2][15] The first institution set up in the country specifically for the purposes of maintaining population statistics was the State Statistical Office, founded in 1875. Since its founding, the office changed its name and structure several times and was alternately subordinated to other institutions and independent, until the most recent changes in 1992, when the institution became the Croatian Bureau of Statistics.[16] The 2011 census was performed on 1–28 April 2011, recording situation as of 31 March 2011.[17] The first census results, containing the number of the population by settlement, was published on 29 June 2011.[18] A comprehensive set of data is expected to be published in 2012.[19] The 2011 census and processing of the data gathered by the census is expected to cost 171.9 million kuna (23.3 million euro).[17] The 2011 census was performed using new methodology: the permanent population was determined as the enumerated population who lived in the census area for at least 12 months prior to the census, or plans to live in the same area for at least 12 months after the census. This method was also retroactively applied to the 2001 census data.[2][15]
Year Enumerated population Permanent population Average annual growth rate Population density per km2 1857 2,181,499 N/A - 38.6 1869 2,398,292 N/A 0.87% 42.4 1880 2,506,228 N/A 0.37% 44.3 1890 2,854,558 N/A 1.31% 50.5 1900 3,161,456 N/A 1.03% 55.9 1910 3,460,584 N/A 0.91% 61.2 1921 3,443,375 N/A -0.05% 60.9 1931 3,785,455 N/A 0.95% 67.0 1948 3,779,958 N/A -0.01% 66.9 1953 3,936,022 N/A 0.81% 69.6 1961 4,159,696 N/A 0.69% 73.6 1971 4,426,221 N/A 0.62% 78.3 1981 4,601,469 N/A 0.39% 81.4 1991 4,784,265 N/A 0.39% 84.6 2001 4,492,049 4,437,460 -0.63% 79.4 2011 4,456,096 4,290,612 N/A 75.8 Source: Croatian Bureau of Statistics[2][15]
Note:2011 population density is calculated using the permanent population figure.Births and deaths before WW I
Average population (x 1000) Live births Deaths Natural change Crude birth rate (per 1000) Crude death rate (per 1000) Natural change (per 1000) 1900 2 375 97 000 65 000 32 000 40.7 27.5 13.2 1901 2 432 95 000 67 000 28 000 39.2 27.4 11.8 1902 2 431 101 000 67 000 34 000 41.5 27.6 13.9 1903 2 462 97 000 66 000 31 000 39.3 26.9 12.4 1904 2 477 99 000 65 000 34 000 40.0 26.2 13.8 1905 2 493 100 000 75 000 25 000 40.1 30.1 10.0 1906 2 515 100 000 66 000 34 000 39.7 26.3 13.4 1907 2 550 100 000 65 000 35 000 39.3 25.4 13.9 1908 2 560 100 000 70 000 30 000 39.2 27.2 12.0 1909 2 588 108 000 69 000 39 000 41.7 26.7 15.0 1910 2 616 99 000 65 000 34 000 37.9 24.8 13.1 1911 2 628 95 000 69 000 26 000 36.0 26.4 9.6 1912 2 654 101 000 67 000 34 000 38.1 25.2 12.9 1913 2 663 95 000 68 000 27 000 35.7 25.5 10.2 1914 2 675 98 000 66 000 32 000 36.6 24.7 11.9 Source: Brian R. Mitchell, European historical statistics, 1750-1975[20] Births and deaths after WW II
Average population (x 1000) Live births Deaths Natural change Crude birth rate (per 1000) Crude death rate (per 1000) Natural change (per 1000) 1947 (e) 3 756 83 700 44 000 39 700 22.3 11.7 10.6 1948 (e) 3 788 89 700 47 100 42 600 23.7 12.4 11.2 1949 (e) 3 821 97 100 47 800 49 300 25.4 12.5 12.9 1947 3 756 83 700 44 000 39 700 22.3 11.7 10.6 1948 3 788 89 700 47 100 42 600 23.7 12.4 11.2 1949 3 821 97 100 47 800 49 300 25.4 12.5 12.9 1950 3 861 95 560 47 292 48 268 24.8 12.2 12.5 1951 3 882 87 564 49 804 37 760 22.6 12.8 9.7 1952 3 913 91 612 43 512 48 100 23.4 11.1 12.3 1953 3 946 90 200 46 662 43 538 22.9 11.8 11.0 1954 3 979 89 309 41 071 48 238 22.4 10.3 12.1 1955 4 011 88 657 42 035 46 622 22.1 10.5 11.6 1956 4 040 86 171 43 772 42 399 21.3 10.8 10.5 1957 4 066 81 414 40 261 41 153 20.0 9.9 10.1 1958 4 090 77 771 37 980 39 791 19.0 9.3 9.7 1959 4 115 78 233 40 688 37 545 19.0 9.9 9.1 1960 4 140 76 156 41 361 34 795 18.4 10.0 8.4 1961 4 169 74 190 37 796 36 394 17.8 9.1 8.7 1962 4 200 72 267 42 134 30 133 17.2 10.0 7.2 1963 4 232 69 875 38 597 31 278 16.5 9.1 7.4 1964 4 246 68 843 43 013 25 830 16.2 10.1 6.1 1965 4 273 71 186 39 936 31 250 16.7 9.3 7.3 1966 4 300 71 245 37 941 33 304 16.6 8.8 7.7 1967 4 326 67 103 41 381 25 722 15.5 9.6 5.9 1968 4 353 65 431 43 720 21 711 15.0 10.0 5.0 1969 4 379 63 635 46 844 16 791 14.5 10.7 3.8 1970 4 406 61 103 44 148 16 955 13.9 10.0 3.8 1971 4 430 64 890 44 878 20 012 14.6 10.1 4.5 1972 4 447 66 035 47 881 18 154 14.8 10.8 4.1 1973 4 465 67 389 45 680 21 709 15.1 10.2 4.9 1974 4 482 67 251 44 950 22 301 15.0 10.0 5.0 1975 4 500 67 016 45 640 21 376 14.9 10.1 4.8 1976 4 517 67 054 45 074 21 980 14.8 10.0 4.9 1977 4 535 68 035 45 156 22 879 15.0 10.0 5.0 1978 4 553 68 704 48 715 19 989 15.1 10.7 4.4 1979 4 570 69 229 48 426 20 803 15.1 10.6 4.6 1980 4 588 68 220 50 100 18 120 14.9 10.9 3.9 1981 4 608 67 455 51 420 16 035 14.6 11.2 3.5 1982 4 635 66 737 50 770 15 967 14.4 11.0 3.4 1983 4 659 65 599 55 147 10 452 14.1 11.8 2.2 1984 4 680 64 909 54 169 10 740 13.9 11.6 2.3 1985 4 702 62 665 52 067 10 598 13.3 11.1 2.3 1986 4 722 60 226 51 740 8 486 12.8 11.0 1.8 1987 4 740 59 209 53 080 6 129 12.6 11.3 1.3 1988 4 757 58 525 52 686 5 839 12.4 11.1 1.2 1989 4 767 55 651 52 569 3 082 11.7 11.0 0.6 1990 4 778 55 409 52 192 3 217 11.6 10.9 0.7 1991 4 513 50 815 54 311 -3 496 11.3 12.0 -0.8 1992 4 470 44 679 51 323 -6 644 10.0 11.5 -1.5 1993 4 641 46 106 50 219 -4 113 9.9 10.8 -0.9 1994 4 649 45 426 48 802 -3 376 9.8 10.5 -0.7 1995 4 669 45 671 49 826 -4 155 9.8 10.7 -0.9 1996 4 494 48 218 49 657 -1 439 10.7 11.0 -0.3 1997 4 572 48 604 50 801 -2 197 10.6 11.1 -0.5 1998 4 501 47 068 52 311 -5 243 10.5 11.6 -1.2 1999 4 554 45 179 51 593 -6 414 9.9 11.3 -1.4 2000 4 381 43 746 50 246 -6 500 10.0 11.5 -1.5 2001 4 437 40 993 49 552 -8 559 9.2 11.2 -1.9 2002 4 443 40 094 50 569 -10 475 9.0 11.4 -2.4 2003 4 442 39 668 52 575 -12 907 8.9 11.8 -2.9 2004 4 439 40 307 49 756 -9 449 9.1 11.2 -2.1 2005 4 442 42 492 51 790 -9 298 9.6 11.7 -2.1 2006 4 440 41 446 50 378 -8 932 9.3 11.3 -2.0 2007 4 438 41 910 52 367 -10 457 9.4 11.8 -2.4 2008 4 434 43 753 52 151 -8 398 9.9 11.8 -1.9 2009 4 431 44 577 52 414 -7 837 10.1 11.8 -1.7 2010 4 291 43 361 52 096 -8 735 10.1 12.1 -2.0 Sources: Institut national d'études démographiques,[21] Croatian Bureau of Statistics[2] Ethnic groups
 This ethnic map shows the absolute majority population per municipality.
Croatia is inhabited mostly by Croats (89.6%), while minority groups include Serbs (4.5%), Bosniaks, Hungarians, Italians, Slovenes, Germans, Czechs, Romani people and others (5.9%).[5] The Constitution of the Republic of Croatia specifies 22 minorities explicitly. Those are Serbs, Czechs, Slovaks, Italians, Hungarians, Jews, Germans, Austrians, Ukrainians, Ruthenians, Bosniaks, Slovenes, Montenegrins, Russians, Bulgarians, Poles, Romani, Rumanians, Turks, Vlachs and Albanians.[22]
Population of Croatia according to ethnic group 1948-20011 Ethnic
groupcensus 1948 census 1953 census 1961 census 1971 census 1981 census 1991 census 2001 Number % Number % Number % Number % Number % Number % Number % Croats 2,975,399 79.2 3,117,513 79.6 3,339,841 80.3 3,513,647 79.4 3,454,661 75.1 3,736,356 78.1 3,977,171 89.6 Serbs 543,795 14.5 588,411 15.0 624,985 15.0 626,789 14.2 531,502 11.6 581,663 12.2 201,631 4.5 Yugoslavs 15,559 0.4 84,118 1.9 379,057 8.2 106,041 2.2 176 0.0 Muslims 1,077 0.0 16,185 0.4 3,113 0.1 18,457 0.4 23,740 0.5 - 19,677 0.4 Bosniaks 20,755 0.5 Italians 76,093 2.0 33,316 0.9 21,103 0.5 17,433 0.4 11,661 0.3 21,303 0.4 19,636 0.4 Hungarians 51,399 1.4 47,711 1.2 42,347 1.0 35,488 0.8 25,439 0.6 22,355 0.5 16,595 0.4 Albanians 635 0.0 1,001 0.0 2,126 0.1 4,175 0.1 6,006 0.1 12,032 0.3 15,082 0.3 Slovenes 38,734 1.0 43,010 1.1 39,101 0.9 32,497 0.7 25,136 0.5 22,376 0.5 13,173 0.3 Czechs 28,991 0.8 25,954 0.7 23,391 0.6 19,001 0.4 15,061 0.3 13,086 0.3 10,510 0.2 Roma 405 0.0 1,261 0.0 313 0.0 1,257 0.0 3,858 0.1 6,695 0.1 9,463 0.2 Montenegrins 2,871 0.1 5,128 0.1 7,465 0.2 9,706 0.2 9,818 0.2 9,724 0.2 4,926 0.1 Macedonians 1,387 0.0 2,385 0.1 4,381 0.1 5,625 0.1 5,362 0.1 6,280 0.1 4,270 0.1 Others/undeclared 36,021 1.0 36,942 0.9 35,971 0.9 58,028 1.3 110,168 2.4 246,354 5.1 124,3952 2.8 Total 3,756,807 3,918,817 4,159,696 4,426,221 4,601,469 4,784,265 4,437,460 1 Source: Croatian Bureau of Statistics[23] 2 including Austrians 247 0.01%, Bulgarians 331 0.01%, Germans 2,902 0.07%, Jews 576 0.01%, Poles 567 0.01%, Romanians 475 0.01%, Russians 906 0.02%, Ruthenians 2,337 0.05, Slovaks 4,712 0.11% Turks 300 0.01%, Ukrainians 1,977 0.04%, Vlachs 12 0.00%
Significant migrations
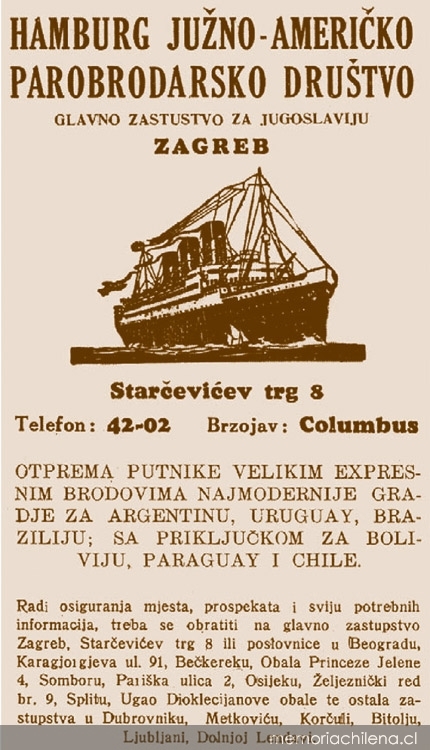
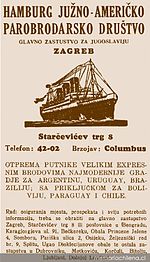 A 1930s ad for shipping lines to the South America
The demographic history of Croatia is characterised by significant migrations, starting with the arrival of the Croats in the area. According to the work De Administrando Imperio written by the 10th-century Byzantine Emperor Constantine VII, the Croats arrived in the area of modern-day Croatia in the early 7th century. However, that claim is disputed, and competing hypotheses date the event between the 6th and the 9th centuries.[24] Following the establishment of a personal union of Croatia and Hungary in 1102,[25] and the joining of the Habsburg Empire in 1527,[26] the Hungarian and German speaking population of Croatia began gradually increasing in number. The processes of Magyarization and Germanization varied in intensity but persisted to the 20th century.[27][28] The Ottoman conquests initiated a westward migration of parts of the Croatian population;[29] the Burgenland Croats are direct descendants of some of those settlers.[30] To replace the fleeing Croats the Habsburgs called on the Orthodox populations of Bosnia and Serbia to provide military service in the Croatian Military Frontier. Serb migration into this region peaked during the Great Serb Migrations of 1690 and 1737–39.[31] Similarly, Venetian Republic rule in Istria and in Dalmatia, following the Fifth and the Seventh Ottoman–Venetian Wars ushered gradual growth of Italian speaking population in those areas.[32] Following the collapse of Austria-Hungary in 1918, the Hungarian population declined, especially in the areas north of the Drava river, where they represented the majority before World War I.[33]
The period between 1890 and World War I was marked by large economic emigration from Croatia to the United States, and particularly to the areas of Pittsburgh, Cleveland and Chicago. Besides the United States, the main destination of the migrants was South America, especially Argentina, Chile, Bolivia and Peru. It is estimated that 500,000 people left Croatia during this period. After World War I, the main focus of emigration shifted to Canada, where about 15,000 people settled before the onset of World War II.[34][35] During World War II and in the period immediately following the war, there were further significant demographic changes as the German speaking population, the Volksdeutsche, were either forced or otherwise compelled to leave—reducing their number from the prewar German population of Yugoslavia of 500,000, living in parts of present-day Croatia and Serbia, to the figure of 62,000 recorded in the 1953 census.[36] A similar fate was suffered by the Italian population in Yugoslavia populating parts of present-day Croatia and Slovenia, as 350,000 left for Italy.[37] The 1940s and the 1950s in Yugoslavia were marked by colonisation of settlements where the displaced Germans used to live, by people from the mountainous parts of Bosnia and Herzegovina, Serbia and Montenegro, and migrations to larger cities spurred on by the development of industry.[38] In the 1960s and 1970s, another wave of economic migrants left Croatia. They largely moved to Canada, Australia, New Zealand and Western Europe. During this period, 65,000 people left for Canada,[35] and by the mid-1970s there were 150,000 Croats who moved to Australia.[39] Particularly large European emigrant communities of Croats exist in Germany, Austria and Switzerland, which largely stem from the 1960s and 1970s migrations.[40]
The most recent significant migrations came as a result of the 1991–1995 Croatian War of Independence. In 1991, more than 400,000 Croats and other non-Serbs were displaced by the Croatian Serb forces or fled the violence in areas with significant Serb populations.[6] During the final days of the war, in 1995, between 120,000[7] and 200,000 Serbs[8] fled the country before the arrival of the Croatian forces during Operation Storm. Ten years after the war, only 117,000 Serb refugees returned out of the 300,000 displaced during the entire war.[9] Most of the Serbs in Croatia who remained never lived in areas occupied during the Croatian War of Independence. Serbs have been only partially re-settled in the regions they previously inhabited, but some of the areas previously inhabited by Serbs were later settled by Croat refugees from Bosnia and Herzegovina, largely from the Republika Srpska.[10][11]
Demographic losses in the 20th century wars and pandemics
In addition to demographic losses through significant migrations, the population of Croatia suffered significant losses due wars and epidemics. In the 20th century alone there were several such events. The first such event was the World War I, when the loss of the population of Croatia amounted to estimated 190,000 persons, or about 5.5% of the total population recorded by 1910 census.[41] The 1918 flu pandemic started to take its toll in Croatia in July 1918, with peaks of the disease occurring in October and November. Data available is scarce but it is estimated that the pandemic caused at least 15,000–20,000 deaths.[42] During the World War II, nearly 195,000 persons died in the territory of the present-day Croatia,[43] Following the end of the World War II and surrender of armed forces of the Independent State of Croatia and civilians accompanying the troops to the British Army, their repatriation and subsequent events that became known as Bleiburg massacre, a substantial number of people were executed, however their exact number is disputed. The claims range from 12,000–15,000 to as many as 80,000 killed in May 1945.[44][45] Finally, approximately 20,000 were killed or went missing during the 1991–1995 Croatian War of Independence. The figure pertains only to those persons which would have been recorded by the 1991 census as living in Croatia.[46][47]
Languages
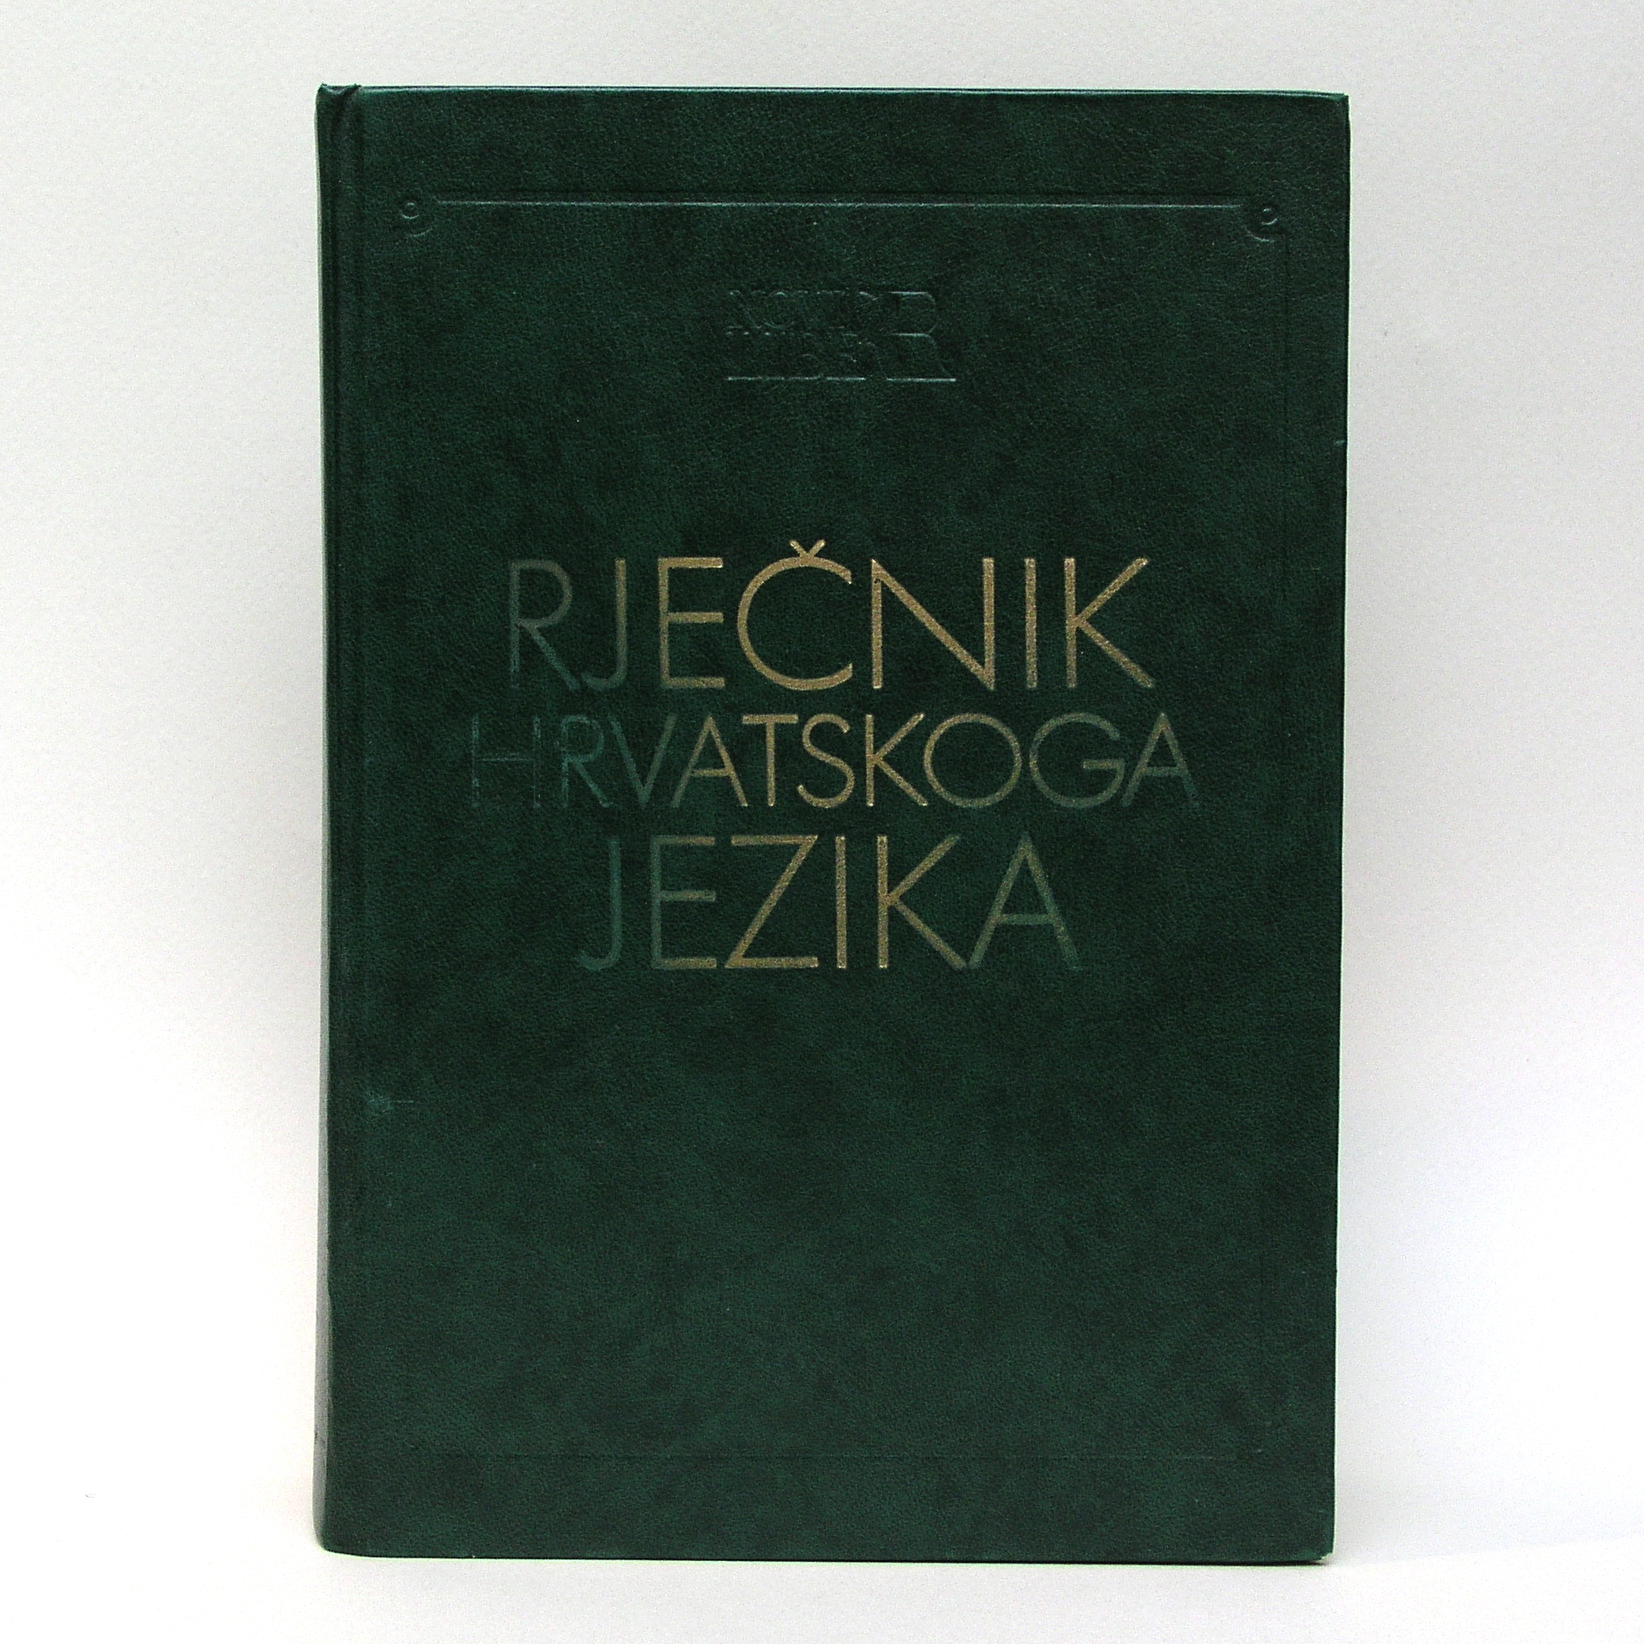
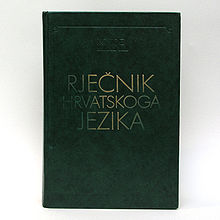 Croatian language dictionary published by Vladimir Anić in 1991
Croatian language is the official language of Croatia, and it is expected to become the 24th official language of the European Union upon its accession in 2013.[22][48] Minority languages are in official use in local government units where more than a third of population consists of national minorities or where local legislation defines so. Those languages are Czech, Hungarian, Italian, Ruthenian, Serbian and Slovakian.[49] According to the 2001 Census, 96% of citizens of Croatia declared Croatian as their native language, 1% declared Serbian as their native language, while no other language is represented in Croatia by more than 0.5% of native speakers among population of Croatia.[50] Croatian is a South Slavic language. Most Croatian vocabulary is derived from the Slavic branch of the Indo-European language family. Croatian is written using the Latin alphabet. Croatian has three major dialects, with Shtokavian dialect used as the standard Croatian and Chakavian and Kajkavian dialects distinguished by their lexicon, phonology, and syntax.[51]
From 1961 to 1991, the official language was Serbo-Croatian. Even during socialist rule, Croats often referred to their language as Croato-Serbian (instead of Serbo-Croatian) or as Croatian.[52] Croatian and Serbian variants of the language were not officially recognised as different at the time, but referred to as the west and east version, and had different alphabets: the Latin alphabet and Serbian Cyrillic.[51] Croatians are protective of the their Croatian language from foreign influences, as the language was under constant change and threats imposed by previous rulers (i.e. Austrian German, Hungarian, Italian and Turkish words were changed and altered to "Slavic" looking/sounding ones). Efforts made to impose policies to alter Croatian into "Serbo-Croatian" or "South Slavic" language, met resistance from Croats in form of Croatian linguistic purism. Croatian replaced Latin as the official language of the Croatian government in the 19th century.[53]
A 2009 survey revealed that 78% of Croatians claim knowledge of at least one foreign language.[54] According to a survey ordered by the European commission in 2005, 49% of Croatians speak English as the second language, 34% speak German, and 14% speak Italian. French and Russian are spoken by 4% each, and 2% of Croatians speak Spanish. A substantial proportion of Slovenes (59%) have a certain level of knowledge of Croatian language.[55]
Religions
Main article: Religion in CroatiaThe main religions of Croatia are Roman Catholicism 87.8%, Orthodox Christianity 4.4%, other Christianity 0.4%, Islam 1.3%, other unspecified 0.9%, and none 5.2%.[56] In the Eurostat Eurobarometer Poll of 2005, 67% of the population of Croatia responded that "they believe there is a God" and 7% said they do not believe "there is any sort of spirit, God, or life force", while 25% expressed a belief in "some sort of spirit or life force".[57] In a 2009 Gallup poll, 70% answered affirmatively when asked "Is religion an important part of your daily life?"[58] Significantly a 2008 Gallup survey of the Balkans indicated church and religious organisations as the most trusted institutions in the country. The survey revealed that 62% of the respondents assigned "a lot" or "some" trust to those institutions, ranking them ahead all types of governmental, international or non-governmental institutions.[59]
Public schools allow religious education in cooperation with religious communities having agreements with the government, but attendance is not mandatory. The classes are organized widely in public elementary and secondary schools. In 2009, 92% of elementary school pupils and 87% of secondary school students attended the religious education classes.[60] The public holidays in Croatia also include the religious festivals of Epiphany, Easter Monday, Corpus Christi Day, Assumption Day, All Saints' Day, Christmas, and St. Stephen's or Boxing Day. The religious festival public holidays are based on the Catholic liturgical year, but citizens of the Republic of Croatia who celebrate different religious holidays have the right not to work on those dates. This includes Christians who celebrate Christmas on January 7 per the Julian calendar, Muslims on the days of Ramadan Bayram and Kurban Bayram, and Jews on the days of Rosh Hashanah and Yom Kippur.[61] Marriages performed by the religious communities having agreements with the state are officially recognized, eliminating the need to register the marriages in a registrar office.[62]
Legal position of religious communities is defined by special legislation, specifically regarding government funding, tax benefits, and religious education in schools. Other matters are left to each religious community to negotiate separately with the government. Registration of the communities is not mandatory, but registered communities become legal persons and enjoy tax and other benefits. The law stipulates that to be eligible for registration, a religious group must have at least 500 believers and be registered as a civil association for 5 years. Religious groups based abroad must submit written permission for registration from their country of origin.[63]
Education
Main article: Education in Croatia Education completed by population of Croatia (over age of 14) according to 2001 census. The segment achieving academic degrees more than doubled by 2008.
Literacy in Croatia stands at 98.1 percent.[5] The 2001 census reported 15.7% of the population over age of 14 with incomplete elementary education and 21.9% with the elementary school education only. 42.8% of the population of 14 completed vocational education and 4.9% completed gymnasium education. An undergraduate degree was attained by 4.2% of the same population, while 7.5% attained an academic degree, and a postgraduate or a doctoral degree was attained by 0.5% of the population group.[64] Croatia recorded a substantial growth of the population attaining the academic degrees and by 2008, the population segment was estimated to encompass 16.7% of population of 15 and over.[65] A worldwide study about the quality of living in different countries published by Newsweek in August 2010 ranked the Croatian education system at 22nd, to share the position with Austria.[66] In 2004, it was estimated that 4.5% of the GDP is spent for education, while schooling expectancy was estimated to 14 years on average.[5] Primary education in Croatia starts at the age of six or seven and consists of eight grades. In 2007 a law was passed to increase free, noncompulsory education until 18 years of age. Compulsory education consists of eight grades of elementary school. Secondary education is provided by gymnasiums and vocational schools. As of 2010, there are 2,131 elementary schools and 713 schools providing various forms of secondary education. Primary and secondary education are also available in languages of recognised minorities in Croatia, where classes are held in Czech, Hungarian, Italian, Serbian and German languages.[2]
There are 84 elementary level and 47 secondary level music and art schools, as well as 92 schools for disabled children and youth and 74 schools for adults.[2] Nationwide leaving exams (Croatian: državna matura) were introduced for secondary education students in the school year 2009–2010. It comprises three compulsory subjects (Croatian language, mathematics, and a foreign language) and optional subjects and is a prerequisite for university education.[67]
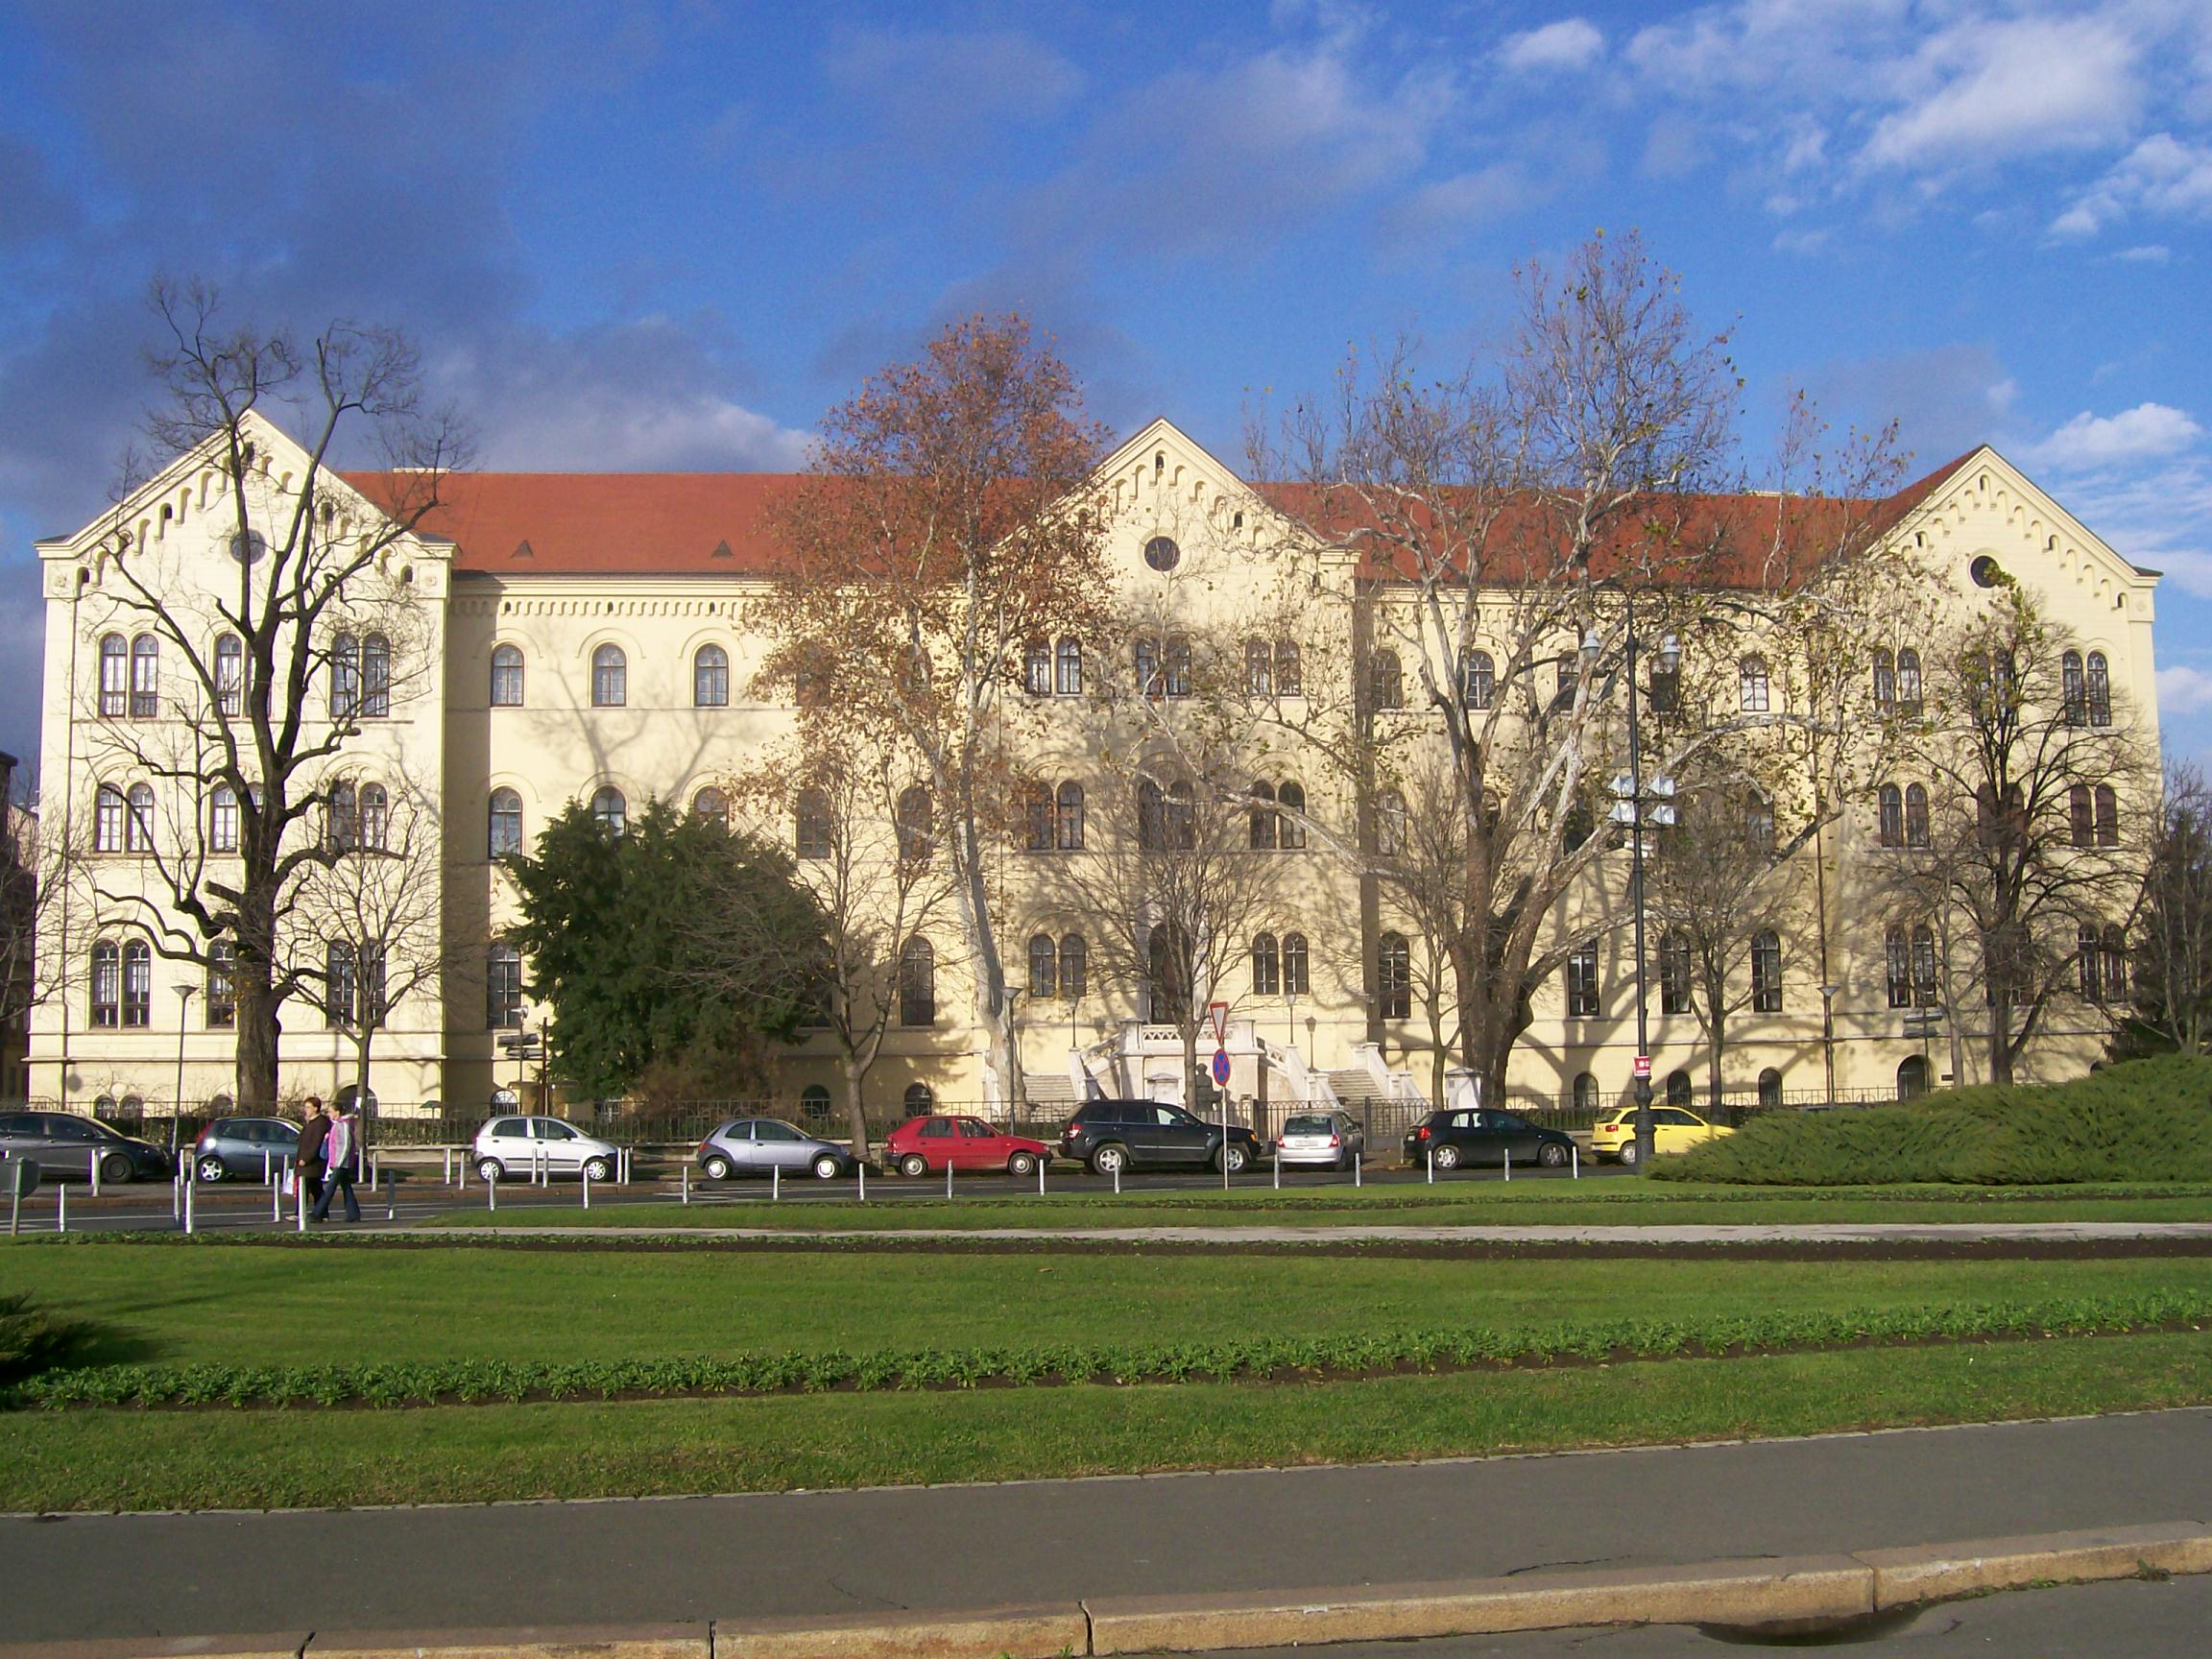
Croatia has eight universities, the University of Zagreb, University of Split, University of Rijeka, University of Osijek, University of Zadar, University of Dubrovnik, University of Pula and Dubrovnik International University. The University of Zadar, the first university in Croatia, was founded in 1396 and remained active until 1807, when other institutions of higher education took over until the foundation of the renewed University of Zadar in 2002.[68] The University of Zagreb, founded in 1669, is the oldest continuously operating university in Southeast Europe.[69] There are also 11 polytechnics and 23 higher education institutions, of which 19 are private. In total, there are 132 institutions of higher education in Croatia, attended by more than 145 thousand students.[2]
There are 205 companies, government or education system institutions and non-profit organizations in Croatia pursuing scientific research and development of technology. Combined, they spent more than 3 billion kuna (400 million euro) and employed 10,191 full-time research staff in 2008.[2] Among the scientific institutes operating in Croatia, the largest is the Ruđer Bošković Institute in Zagreb.[70] The Croatian Academy of Sciences and Arts in Zagreb is a learned society promoting language, culture, arts and science from its inception in 1866.[71] Notable scientists from Croatia include inventors and Nobel Prize winners.[72]
Health
Main article: Healthcare in Croatia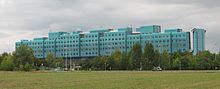 Clinical Hospital Dubrava in Zagreb
Croatia has a universal health care system, whose roots can be traced back to the Hungarian-Croatian Parliament Act of 1891, providing a form of mandatory insurance of all factory workers and craftsmen.[73] The population is covered by a basic health insurance plan provided by statute and optional insurance. In 2009, annual healthcare related expenditures reached 20.6 billion kuna (2.75 billion euro).[2] Healthcare expenditures comprise only 0.6% of private health insurance and public spending.[74] In 2010, Croatia spent 6.9% of its GDP on healthcare,[75] representing a decline from approximately 8% estimated in 2008, when 84% of healthcare spending came from public sources.[76] According to the World Health Organization, Croatia ranks around the 50th in the world in terms of life expectancy.[77]
There are hundreds of healthcare institutions Croatia, including 79 hospitals and clinics with 23,967 beds. The hospitals and clinics care for more than 700 thousand patients per year and employ 5,205 medical doctors, including 3,929 specialists. There are 6,379 private practice offices, and a total of 41,271 health workers in the country. There are 63 emergency medical service units, responding to more than a million calls. The principal cause of death in 2008 was cardiovascular disease at 43.5% for men and 57.2% for women, followed by tumours, at 29.4% for men and 21.4% for women. Other significant causes of death are injuries, poisonings and other external causes (7.7% men/3.9% women), digestive system diseases (5.7% men/3.6% women), respiratory system diseases (5.1% men/3.5% women) and endocrine, nutritional and metabolic diseases (2.1% men/3.0% women). There is no other cause of disease affecting more than 3% of the population. In 2009 only 13 Croatians had been infected with HIV/AIDS and 6 had died from the disease.[2] In 2008 it was estimated by the WHO that 27.4% of Croatians over age of 15 are smokers.[78] According to 2003 WHO data, 22% of the Croatian adult population is obese.[79]
See also
References
- ^ "Census 2011 First Results". Croatian Bureau of Statistics. 29 June 2011. http://www.dzs.hr/Eng/censuses/census2011/htm/e11_RH.html. Retrieved 5 August 2011.
- ^ a b c d e f g h i j k l m n "2010 – Statistical Yearbook of the Republic of Croatia" (PDF). Croatian Bureau of Statistics. December 2010. http://www.dzs.hr/Hrv_Eng/ljetopis/2010/SLJH2010.pdf. Retrieved 7 October 2011.
- ^ "Projekcija stanovništva Republike Hrvatske 2004. – 2051. [Projection of Population of the Republic of Croatia 2004–2051]" (in Croatian) (PDF). Croatian Bureau of Statistics. 2006. http://www.dzs.hr/Hrv/important/Notices/projekcije_stanovnistva_2004-2051.pdf. Retrieved 11 October 2011.
- ^ Snježana Mrđen; Mladen Friganović (June 1998). "The demographic situation in Croatia". Geoadria (Hrvatsko geografsko društvo – Zadar) 3 (1): 29–56. ISSN 1331-2294. http://hrcak.srce.hr/index.php?show=clanak&id_clanak_jezik=14991. Retrieved 7 November 2011.
- ^ a b c d e "World Factbook". Central Intelligence Agency. https://www.cia.gov/library/publications/the-world-factbook/geos/hr.html. Retrieved 9 September 2011.
- ^ a b "Summary of judgement for Milan Martić". United Nations. 12 June 2007. Archived from the original on 15 December 2007. http://web.archive.org/web/20071215084458/http://www.un.org/icty/pressreal/2007/pr1162e-summary.htm. Retrieved 21 June 2008.
- ^ a b Steven Erlanger (16 January 2000). "For Serbs in Croatia, a Pledge Unkept". The New York Times. http://www.nytimes.com/2000/01/16/world/for-serbs-in-croatia-a-pledge-unkept.html. Retrieved 18 October 2011.
- ^ a b Matt Prodger (5 August 2005). "Evicted Serbs remember Storm". BBC News. http://news.bbc.co.uk/1/hi/world/europe/4747379.stm. Retrieved 15 October 2011.
- ^ a b "STATUS REPORT No.16 ON CROATIA’S PROGRESS IN MEETING INTERNATIONAL COMMITMENTS SINCE NOVEMBER 2004" (PDF). Organization for Security and Co-operation in Europe. 7 July 2005. http://www.osce.org/zagreb/15985. Retrieved 13 October 2011.
- ^ a b "Savez udruga Hrvata iz BiH izabrao novo čelništvo [Union of associations of Bosnia and Herzegovina Croats elects new leadership]" (in Croatian). Index.hr. 28 June 2003. http://www.index.hr/vijesti/clanak/savez-udruga-hrvataiz-bih-izabrao-novo-celnistvo/145769.aspx. Retrieved 12 October 2011.
- ^ a b "29 06 2010 – Benkovac" (in Croatian). Office of the President of Croatia. 29 June 2010. http://www.predsjednik.hr/29062010. Retrieved 12 October 2011.
- ^ "U Hrvatskoj dvostruko više doseljenika [Twice as many immigrants in Croatia]". Limun.hr. 21 July 2007. http://limun.hr/main.aspx?id=178599&NadID=178578. Retrieved 12 October 2011.
- ^ "Traži se 40% više kvota za strane radnike". Poslovni dnevnik. 28 November 2008. http://www.poslovni.hr/101937.aspx. Retrieved 16 May 2010.
- ^ Nick Vidak (2008). "The Policy of Immigration in Croatia". Politička misao: Croatian Political Science Review (University of Zagreb, Faculty of Political Science) (5): 57–75. ISSN 0032-3241. http://hrcak.srce.hr/index.php?show=clanak&id_clanak_jezik=51084. Retrieved 15 October 2010.
- ^ a b c "Census of Population, Households and Dwellings 2011, First Results by Settlements" (PDF). Statistical Reports (Croatian Bureau of Statistics) (1441). 2011. ISSN 1333-1876. http://www.dzs.hr/Hrv_Eng/publication/2011/SI-1441.pdf. Retrieved 6 November 2011.
- ^ "About us". Croatian Bureau of Statistics. http://www.dzs.hr/Eng/about_us/abot_us.htm. Retrieved 6 November 2011.
- ^ a b "Zakon o popisu stanovništva, kućanstava, i stanova u Republici Hrvatskoj 2011. godine [Population, Household and Apartment Census in the Republic of Croatia in 2011]" (in Croatian). Narodne Novine. 24 July 2010. http://narodne-novine.nn.hr/clanci/sluzbeni/2010_07_92_2587.html. Retrieved 6 November 2011.
- ^ Kristina Turčin (29 June 2011). "Hrvatska ima 4,29 milijuna stanovnika. U Zagrebu živi blizu 800.000 ljudi [Croatia has 4.29 million residents. Nearly 800,000 people live in Zagreb]" (in Croatian). Jutarnji list. http://www.jutarnji.hr/popis-stanovnistva-2011---hrvatska-ima-4-29-milijuna-stanovnika--zagreb-blizu-800-000/956036/. Retrieved 6 November 2011.
- ^ Kristina Turčin (29 June 2011). "Nestao grad poput Rijeke: ima nas čak 150.000 manje! [A city as large as Rijeka missing: there's 150,000 fewer of us!]" (in Croatian). Jutarnji list. http://www.jutarnji.hr/popis-stanovnistva--nestao-grad-poput-rijeke--ima-nas-cak-150-000-manje-/955960/. Retrieved 6 November 2011.
- ^ Brian R. Mitchell (1980). European historical statistics, 1750-1975. Facts on File. p. 341. ISBN 9780871963291. http://books.google.com/books?id=13URAQAAMAAJ. Retrieved 8 November 2011.
- ^ "Database on developed countries". Institut national d'études démographiques. http://www.ined.fr/en/pop_figures/developed_countries/developed_countries_database/. Retrieved 8 November 2011.
- ^ a b "Ustav Republike Hrvatske [Constitution of the Republic of Croatia]" (in Croatian). Narodne Novine. 9 July 2010. http://narodne-novine.nn.hr/clanci/sluzbeni/2010_07_85_2422.html. Retrieved 11 October 2011.
- ^ "Stanovništvo prema narodnosti, po gradovima/općinama, popis 2001 [Population by Nationality, by City/Municipality, 2001 Census]" (in Croatian). Croatian Bureau of Statistics. 2001. http://www.dzs.hr/Hrv/censuses/Census2001/Popis/H01_02_02/H01_02_02.html. Retrieved 10 November 2011.
- ^ Ivan Mužić (2007) (in Croatian) (PDF). Hrvatska povijest devetoga stoljeća [Croatian Ninth Century History]. Naklada Bošković. pp. 249–293. ISBN 9789532630343. http://www.muzic-ivan.info/hrvatska_povijest.pdf. Retrieved 14 October 2011.
- ^ Ladislav Heka (October 2008). "Hrvatsko-ugarski odnosi od sredinjega vijeka do nagodbe iz 1868. s posebnim osvrtom na pitanja Slavonije [Croatian-Hungarian relations from the Middle Ages to the Compromise of 1868, with a special survey of the Slavonian issue]" (in Croatian). Scrinia Slavonica (Hrvatski institut za povijest – Podružnica za povijest Slavonije, Srijema i Baranje) 8 (1): 152–173. ISSN 1332-4853. http://hrcak.srce.hr/index.php?show=clanak&id_clanak_jezik=68144. Retrieved 16 October 2011.
- ^ "Povijest saborovanja [History of parliamentarism]" (in Croatian). Sabor. http://www.sabor.hr/Default.aspx?sec=404. Retrieved 18 October 2010.
- ^ Piotr Eberhardt (2003). Ethnic groups and population changes in twentieth-century Central-Eastern Europe. M.E. Sharpe. p. 266. ISBN 9780765606655. http://books.google.com/books?id=jLfX1q3kJzgC. Retrieved 5 November 2011.
- ^ Ante Čuvalo (December 2008). "Josip Jelačić – Ban of Croatia". Review of Croatian History (Croatian Institute of History) 4 (1): 13–27. ISSN 1845-4380. http://hrcak.srce.hr/index.php?show=clanak&id_clanak_jezik=77559. Retrieved 17 October 2011.
- ^ Ivan Jurković (September 2003). "Klasifikacija hrvatskih raseljenika za trajanja osmanske ugroze (od 1463. do 1593.) [Classification of Displacees Among Croats During the Ottoman Peril (from 1463 till 1593)]" (in Croatian). Migracijske i etničke teme (Institute for Migration and Ethnic Studies) 19 (2-3): 147–174. ISSN 1333-2546. http://hrcak.srce.hr/7855. Retrieved 5 November 2011.
- ^ "Povijest Gradišćanskih Hrvatov [History of Burgenland Croats]" (in Croatian). Croatian Cultural Association in Burgenland. http://www.hkd.at/index.php?option=com_content&view=article&id=61&Itemid=102&lang=hr. Retrieved 17 October 2011.
- ^ John R. Lampe; Marvin R. Jackson (1982). Balkan economic history, 1550–1950: from imperial borderlands to developing nations. Indiana University Press. p. 62. ISBN 9780253303684. http://books.google.hr/books?id=OtW2axOSn10C. Retrieved 17 October 2011.
- ^ Frederic Chapin Lane (1973). Venice, a Maritime Republic. JHU Press. p. 409. ISBN 9780801814600. http://books.google.com/?id=PQpU2JGJCMwC. Retrieved 18 October 2011.
- ^ Piotr Eberhardt (2003). Ethnic groups and population changes in twentieth-century Central-Eastern Europe. M.E. Sharpe. pp. 288–295. ISBN 9780765606655. http://books.google.com/books?id=jLfX1q3kJzgC. Retrieved 5 November 2011.
- ^ Jelena Lončar (22 August 2007). "Iseljavanje Hrvata u Amerike te Južnu Afriku [Migrations of Croats to the Americas and the South Africa]" (in Croatian). Croatian Geographic Society. http://www.geografija.hr/clanci/1225/iseljavanje-hrvata-u-amerike-te-juznu-afriku. Retrieved 5 November 2011.
- ^ a b "Hrvatsko iseljeništvo u Kanadi [Croatian diaspora in Canada]" (in Croatian). Ministry of Foreign Affairs and European Integration (Croatia). http://www.mvpei.hr/hmiu/tekst.asp?q=02hi-hi11. Retrieved 5 November 2011.
- ^ Charles W. Ingrao; Franz A. J. Szabo (2008). The Germans and the East. Purdue University Press. p. 357. ISBN 9781557534439. http://books.google.com/books?id=IHAcEB8jh1AC. Retrieved 5 November 2011.
- ^ James M. Markham (6 June 1987). "Election Opens Old Wounds in Trieste". The New York Times. http://www.nytimes.com/1987/06/06/world/election-opens-old-wounds-in-trieste.html. Retrieved 5 November 2011.
- ^ "Migrations in the territory of former Yugoslavia from 1945 until present time" (PDF). University of Ljubljana. http://www.ff.uni-lj.si/oddelki/zgodovin/wwwrepe/20th/Migrations%20in%20the%20territory.pdf. Retrieved 5 November 2011.
- ^ "Hrvatsko iseljeništvo u Australiji [Croatian diaspora in Australia]" (in Croatian). Ministry of Foreign Affairs and European Integration (Croatia). http://www.mvpei.hr/hmiu/tekst.asp?q=02hi-hi02. Retrieved 5 November 2011.
- ^ "Stanje hrvatskih iseljenika i njihovih potomaka u inozemstvu [Balance of Croatian Emigrants and their Descendants Abroad]" (in Croatian). Ministry of Foreign Affairs and European Integration (Croatia). http://www.mvpei.hr/hmiu/tekst.asp?q=02hi-hi00. Retrieved 5 November 2011.
- ^ Ivica Radoš (15 December 2006). "Atraktivan vodič kroz zaboravljeni i davno izgubljeni rat [Appealing Guide Through a Forgotten and a Long Lost War]" (in Croatian). Jutarnji list. http://www.jutarnji.hr/atraktivan-vodic-kroz-zaboravljeni-i-davno-izgubljeni-rat/166497/. Retrieved 6 November 2011.
- ^ Goran Hutinec (November 2006). "Odjeci epidemije "španjolske gripe" 1918. godine u hrvatskoj javnosti [The reflections of the so-called "Spanish flue" [sic epidemics on Croatian public in the year 1918]"] (in Croatian). Radovi Zavoda za hrvatsku povijest (University of Zagreb, Faculty of Philosophy, Croatian History Institute) 38 (1): 227–242. ISSN 0353-295X. http://hrcak.srce.hr/index.php?show=clanak&id_clanak_jezik=79285. Retrieved 6 November 2011.
- ^ Philip J. Cohen; David Riesman (1996). Serbia's Secret War: Propaganda and the Deceit of History. Texas A&M University Press. pp. 106–111. ISBN 9780890967607. http://books.google.hr/books?id=Fz1PW_wnHYMC. Retrieved 17 October 2011.
- ^ Cvijeto Job (2002). Yugoslavia's ruin: the bloody lessons of nationalism, a patriot's warning. Rowman & Littlefield. p. 28. ISBN 9780742517844. http://books.google.com/books?id=yH3Hz2AXonwC. Retrieved 6 November 2011.
- ^ Misha Glenny (2000). The Balkans: nationalism, war, and the Great Powers, 1804-1999. Viking. p. 530. ISBN 9780670853380. http://books.google.com/books?id=oSRpAAAAMAAJ. Retrieved 6 November 2011.
- ^ Ivo Goldstein (1999). Croatia: A History. C. Hurst & Co. Publishers. p. 256. ISBN 9781850655251. http://books.google.hr/books?id=pSxJdE4MYo4C. Retrieved 6 November 2011.
- ^ "Killed and missing persons from the territories of Republic Croatia and former Republic of Serb Krayina | the Polynational War Memorial". Polynational War Memorial. http://www.war-memorial.net/mem_det.asp?ID=164. Retrieved 7 February 2010.
- ^ Sandra Veljković; Stojan de Prato (5 November 2011). "Hrvatski postaje 24. službeni jezik Europske unije [Croatian Becomes the 24th Official Language of the European Union]" (in Croatian). Večernji list. http://www.vecernji.hr/vijesti/hrvatski-postaje-24-sluzbeni-jezik-europske-unije-clanak-211879. Retrieved 11 October 2011.
- ^ "Izviješće o provođenju ustavnog zakona o pravima nacionalnih manjina i utrošku sredstava osiguranih u državnom proračunu Republike Hrvatske za 2007. godinu za potrebe nacionalnih manjina [Report on Implementation of Constitutional Act on National Minority Rights and Expenditure of Funds Appropriated by the 2007 State Budget for Use by the National Minorities]" (in Croatian). Sabor. 28 November 2008. http://www.sabor.hr/Default.aspx?art=23872. Retrieved 27 October 2011.
- ^ "Stanovništvo prema materinskom jeziku, po gradovima/općinama, popis 2001 [Population by mother tongue, by city/municipality, 2001 census]" (in Croatian). Croatian Bureau of Statistics. 31 March 2001. http://www.dzs.hr/Hrv/censuses/Census2001/Popis/H01_02_03/H01_02_03.html. Retrieved 11 October 2011.
- ^ a b "Organska podloga hrvatskog jezika [Organic Base of the Croatian Language]" (in Croatian). Institute of Croatian Language and Linguistics. http://www.ihjj.hr/oHrJeziku-povijest-1.html. Retrieved 11 October 2011.
- ^ Mate Kapović (2009). "Položaj hrvatskoga jezika u svijetu danas [Position of Croatian Language in the World Today]" (in Croatian). Kolo (Matica hrvatska) (1-2). ISSN 1331-0992. http://www.matica.hr/kolo/kolo2009_1.nsf/AllWebDocs/Polozaj_hrvatskoga_jezika_u_svijetu_danas. Retrieved 26 October 2011.
- ^ Branka Tafra (February 2007). "Značenje narodnoga preporoda za hrvatski jezik [Significance of the National Revival for Croatian Language]" (in Croatian). Croatica et Slavica Iadertina 2: 43–55. ISSN 1845-6839. http://hrcak.srce.hr/index.php?show=clanak&id_clanak_jezik=26666. Retrieved 10 October 2011.
- ^ "Istraživanje: Tri posto visokoobrazovanih ne zna niti jedan strani jezik, Hrvati uglavnom znaju engleski [Survey: Three percent of higher educated people can not speak any foreign languages, Croats mostly speak English]" (in Croatian). Index.hr. 5 April 2011. http://www.index.hr/vijesti/clanak/istrazivanje-tri-posto-visokoobrazovanih-ne-zna-niti-jedan-strani-jezik-hrvati-uglavnom-znaju-engleski/545687.aspx. Retrieved 11 October 2011.
- ^ "Europeans and their languages – European commission special barometer FEB2006" (PDF). European Commission. February 2006. http://ec.europa.eu/public_opinion/archives/ebs/ebs_243_en.pdf. Retrieved 15 January 2010.
- ^ a b "STANOVNIŠTVO PREMA VJERI, PO GRADOVIMA/OPĆINAMA, POPIS 2001. [POPULATION BY RELIGION, BY CITY/MUNICIPALITY, CENSUS 2001]" (in Croatian). Croatian Bureau of Statistics. 2001. http://www.dzs.hr/Hrv/censuses/Census2001/Popis/H01_02_04/H01_02_04.html. Retrieved 14 June 2010.
- ^ "Social values, Science and Technology" (PDF). Eurostat. June 2005. http://ec.europa.eu/public_opinion/archives/ebs/ebs_225_report_en.pdf. Retrieved 5 November 2011.
- ^ "Religiosity Highest in World's Poorest Nations". The Gallup Organization. 31 August 2010. http://www.gallup.com/poll/142727/religiosity-highest-world-poorest-nations.aspx#2. Retrieved 5 November 2011.
- ^ "Balkan Monitor, 2008 Summary of Findings" (PDF). Gallup. 2008. http://www.balkan-monitor.eu/files/BalkanMonitor-2008_Summary_of_Findings.pdf. Retrieved 5 November 2011.
- ^ Ankica Barbir-Mladinović (10 September 2011). "Vjeronauk kao sredstvo ideologizacije [Religious education as a means of dissemination of ideologies]" (in Croatian). Radio Free Europe/Radio Liberty. http://www.slobodnaevropa.org/content/tema_sedmice_vjeronauka_hrvatske/24324338.html. Retrieved 5 November 2011.
- ^ "Zakon o blagdanima, spomendanima i neradnim danima u Republici Hrvatskoj [Public Holidays, Commemorative Days and Time-Off Days in the Republic of Croatia Act]" (in Croatian). Narodne Novine. 15 November 2002. http://narodne-novine.nn.hr/clanci/sluzbeni/2002_11_136_2194.html. Retrieved 5 November 2011.
- ^ Marijana Matković (9 June 1999). "Dva "ključa" za crkveni brak? [Two "keys" to religious marriages?]" (in Croatian). Vjesnik. http://www.monitor.hr/clanci/dva-kljuca-za-crkveni-brak/2504/. Retrieved 5 November 2011.
- ^ "Zakon o pravnom položaju vjerskih zajednica [Religious Communities Legal Position Act]" (in Croatian). Narodne Novine. 8 July 2002. http://narodne-novine.nn.hr/clanci/sluzbeni/309118.html. Retrieved 5 November 2011.
- ^ "Radno sposobno stanovništvo staro 15 i više godina prema starosti, trenutačnom statusu aktivnosti i završenoj školi, po županijama, popis 2001 [Population capable of employment, aged 15 and over, according to age, present activity status and completed education by county, 2001 census]" (in Croatian). Croatian Bureau of Statistics. http://www.dzs.hr/Hrv/censuses/Census2001/Popis/H01_02_14/H01_02_14_RH.html. Retrieved 7 November 2011.
- ^ Petar Dorić (7 September 2008). "Hrvatska po rastu broja studenata prva u Europi [Croatia tops European countries [university student number growth]"] (in Croatian). Slobodna Dalmacija. http://www.slobodnadalmacija.hr/Hrvatska/tabid/66/articleType/ArticleView/articleId/21394/Default.aspx. Retrieved 7 November 2011.
- ^ "Newsweek study of Health, Education, Economy and Politics ranks the globe's top nations". Newsweek. 15 August 2010. Archived from the original on 1 September 2010. http://www.newsweek.com/2010/08/15/interactive-infographic-of-the-worlds-best-countries.html. Retrieved 14 November 2010.
- ^ "Državna matura" (in Croatian). Ministry of Science, Education and Sports (Croatia). http://public.mzos.hr/Default.aspx?sec=2246. Retrieved 12 October 2011.
- ^ "O nama [About us]" (in Croatian). University of Zadar. http://www.unizd.hr/Onama/tabid/55/Default.aspx. Retrieved 15 October 2011.
- ^ "University of Zagreb 1699–2005". University of Zagreb. http://www.unizg.hr/homepage/about-university/history/. Retrieved 15 October 2011.
- ^ "60. rođendan Instituta Ruđer Bošković: Svijetu je dao ciklotron, spojeve i novi katalizator [The 60th Anniversary of the Ruđer Bošković Institute: It Presented the World with a Cyclotron, Compounds and a New Catalyst]" (in Croatian). Jutarnji list. 9 June 2010. http://www.jutarnji.hr/ciklotron--spojevi-i-novi-katalizatori---to-je-institut-ruder-boskovic-dao-svijetu-/823851/. Retrieved 12 October 2011.
- ^ "The Founding of the Academy". Croatian Academy of Sciences and Arts. http://info.hazu.hr/foundation_of_academy. Retrieved 12 October 2011.
- ^ Tanja Rudež (4 October 2010). "Najbolje što su Hrvati dali znanosti [The Best Scientific Contributions by Croatians]" (in Croatian). Jutarnji list. http://www.jutarnji.hr/najbolje-sto-su-hrvati-dali-znanosti/311070/. Retrieved 13 October 2011.
- ^ Siniša Zrinščak (February 2003). "Socijalna politika u kontekstu korjenite društvene transformacije postkomunističkih zemalja [Social Policy in the Context of Thorough Social Transformation of Post-Communist Countries]" (in Croatian). Revija za socijalnu politiku 10 (2): 135–159. ISSN 1330-2965. http://hrcak.srce.hr/index.php?show=clanak&id_clanak_jezik=47595. Retrieved 12 October 2011.
- ^ Marijana Matković (27 September 2011). "Ulaskom u EU Hrvatska će imati najveću potrošnju za zdravstvo [After the EU accession Croatia will have the maximum healthcare spending]" (in Croatian). Vjesnik. http://www.vjesnik.hr/Article.aspx?ID=B02A10F4-BFE5-4EC0-B0E5-BFCAFE8F2062. Retrieved 12 October 2011.
- ^ "Svjetska banka podržava gospodarski oporavak Hrvatske [World Bank Supports Economic Recovery of Croatia]" (in Croatian). World Bank. 10 May 2011. http://go.worldbank.org/R62VSWTTU0. Retrieved 12 October 2011.
- ^ Etibar Jafarov; Victoria Gunnarsson (May 2008). "Government Spending on Health Care and Education in Croatia: Efficiency and Reform Options" (PDF). International Monetary Fund. http://www.imf.org/external/pubs/ft/wp/2008/wp08136.pdf. Retrieved 7 November 2011.
- ^ "Croatia". World Health Organization. http://www.who.int/countries/hrv/en/. Retrieved 12 October 2011.
- ^ Marija Crnjak (10 January 2008). "U Hrvatskoj se puši manje nego u EU [Fewer smokers in Croatia than in the EU]" (in Croatian). Poslovni dnevnik. http://www.poslovni.hr/vijesti/u-hrvatskoj-se-pusi-manje-nego-u-eu-66591.aspx. Retrieved 12 October 2011.
- ^ "Croatia". World Health Organization. http://apps.who.int/whosis/database/core/core_select_process.cfm. Retrieved 12 October 2011.
External links
- Human Rights Watch Report "Broken Promises: Impediments to Refugee Return to Croatia"
- United Nations Statistics Division Millennium Indicators for Croatia
- Population of Croatia 1931-2001
Demographics of Europe Sovereign
states- Albania
- Andorra
- Armenia
- Austria
- Azerbaijan
- Belarus
- Belgium
- Bosnia and Herzegovina
- Bulgaria
- Croatia
- Cyprus
- Czech Republic
- Denmark
- Estonia
- Finland
- France
- Georgia
- Germany
- Greece
- Hungary
- Iceland
- Ireland
- Italy
- Kazakhstan
- Latvia
- Liechtenstein
- Lithuania
- Luxembourg
- Macedonia
- Malta
- Moldova
- Monaco
- Montenegro
- Netherlands
- Norway
- Poland
- Portugal
- Romania
- Russia
- San Marino
- Serbia
- Slovakia
- Slovenia
- Spain
- Sweden
- Switzerland
- Turkey
- Ukraine
- United Kingdom
- (England
- Northern Ireland
- Scotland
- Wales)
- Vatican City
States with limited
recognition- Abkhazia
- Kosovo
- Nagorno-Karabakh
- Northern Cyprus
- South Ossetia
- Transnistria
Dependencies
and other territories- Åland
- Faroe Islands
- Gibraltar
- Guernsey
- Jan Mayen
- Jersey
- Isle of Man
- Svalbard
Other entities - European Union
Categories:- Croatian society
- Demographics by country
- Demographics of Croatia


Wikimedia Foundation. 2010.