- Demographic transition
-
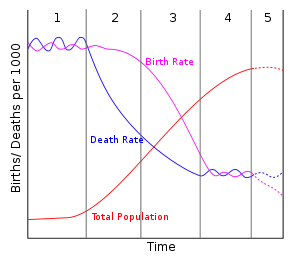 A diagram of the demographic transition model, including stage 5
The demographic transition model (DT) is the transition from high birth and death rates to low birth and death rates as a country develops from a pre-industrial to an industrialized economic system. The theory is based on an interpretation of demographic history developed in 1929 by the American demographer Warren Thompson (1887–1973).[1] Thompson observed changes, or transitions, in birth and death rates in industrialized societies over the previous 200 years. Most developed countries are in stage 3 or 4 of the model; the majority of developing countries have reached stage 2 or stage 3. The major (relative) exceptions are some poor countries, mainly in sub-Saharan Africa and some Middle Eastern countries, which are poor or affected by government policy or civil strife, notably Pakistan, Palestinian Territories, Yemen and Afghanistan.[2]
Although this model predicts ever decreasing fertility rates, recent data show that beyond a certain level of development fertility rates increase again.[3]
A correlation matching the demographic transition has been established; it not certain whether industrialization and higher incomes lead to lower population or if it is lower populations that lead to industrialization and higher incomes.[4]
In countries that are now developed this demographic transition began in the 18th century and continues today. In less developed countries, this demographic transition started later and is still at an earlier stage.[5]
Contents
Summary of the theory

 Demographic change in Sweden from 1735 to 2000.
Red line: crude death rate (CDR), blue line: (crude) birth rate (CBR)The transition involves four stages, or possibly five
- In stage one, pre-industrial society, death rates and birth rates are high and roughly in balance. All human populations are believed to have had this balance until the late 18th century when this balance ended in Western Europe.[6] In fact, growth rates were less than 0.05% at least since the Agricultural Revolution over 10,000 years ago.[6] Birth and death rates both tend to be very high in this stage.[6] Because both rates are approximately in balance, population growth is typically very slow in stage one.[6]
- In stage two, that of a developing country, the death rates drop rapidly due to improvements in food supply and sanitation, which increase life spans and reduce disease. The improvements specific to food supply typically include selective breeding and crop rotation and farming techniques.[6] Other improvements generally include access to technology, basic healthcare, and education. For example, numerous improvements in public health reduce mortality, especially childhood mortality.[6] Prior to the mid-20th century, these improvements in public health were primarily in the areas of food handling, water supply, sewage, and personal hygiene.[6] Interestingly, one of the variables often cited is the increase in female literacy combined with public health education programs which emerged in the late 19th and early 20th centuries.[6] In Europe, the death rate decline started in the late 18th century in northwestern Europe and spread to the south and east over approximately the next 100 years.[6] Without a corresponding fall in birth rates this produces an imbalance, and the countries in this stage experience a large increase in population.
- In stage three, birth rates fall due to access to contraception, increases in wages, urbanization, a reduction in subsistence agriculture, an increase in the status and education of women, a reduction in the value of children's work, an increase in parental investment in the education of children and other social changes. Population growth begins to level off. The birth rate decline in developed countries started in the late 19th century in northern Europe.[6] While improvements in contraception do play a role in birth rate decline, it should be noted that contraceptives were not generally available nor widely used in the 19th century and as a result likely did not play a significant role in the decline then.[6] It is important to note that birth rate decline is caused also by a transition in values; not just because of the availability of contraceptives.[6]
- During stage four there are both low birth rates and low death rates. Birth rates may drop to well below replacement level as has happened in countries like Germany, Italy, and Japan, leading to a shrinking population, a threat to many industries that rely on population growth. As the large group born during stage two ages, it creates an economic burden on the shrinking working population. Death rates may remain consistently low or increase slightly due to increases in lifestyle diseases due to low exercise levels and high obesity and an aging population in developed countries. By the late 20th century, birth rates and death rates in developed countries leveled off at lower rates.[5]
As with all models, this is an idealized picture of population change in these countries. The model is a generalization that applies to these countries as a group and may not accurately describe all individual cases. The extent to which it applies to less-developed societies today remains to be seen. Many countries such as China, Brazil and Thailand have passed through the Demographic Transition Model (DTM) very quickly due to fast social and economic change. Some countries, particularly African countries, appear to be stalled in the second stage due to stagnant development and the effect of AIDS.
Stage One
In pre-industrial society, death rates and birth rates were both high and fluctuated rapidly according to natural events, such as drought and disease, to produce a relatively constant and young population. Family planning and contraception were virtually nonexistent; therefore, birth rates were essentially only limited by the ability of women to bear children. Emigration depressed death rates in some special cases (for example, Europe and particularly the Eastern United States during the 19th century), but, overall, death rates tended to match birth rates, often exceeding 40 per 1000 per year. Children contributed to the economy of the household from an early age by carrying water, firewood, and messages, caring for younger siblings, sweeping, washing dishes, preparing food, and working in the fields.[7] Raising a child cost little more than feeding him; there were no education or entertainment expenses and, in equatorial Africa, there were no clothing expenses either. Thus, the total cost of raising children barely exceeded their contribution to the household. In addition, as they became adults they become a major input to the family business, mainly farming, and were the primary form of insurance for adults in old age. In India, an adult son was all that prevented a widow from falling into destitution. While death rates remained high there was no question as to the need for children, even if the means to prevent them had existed.[8]
During this stage, the society evolves in accordance with Malthusian paradigm, with population essentially determined by the food supply. Any fluctuations in food supply (either positive, for example, due to technology improvements, or negative, due to droughts and pest invasions) tend to translate directly into population fluctuations. Famines resulting in significant mortality are frequent. Overall, the population dynamics during stage one is highly reminiscent of that commonly observed in animals.
Stage Two
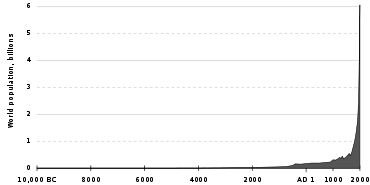 World population 10,000 BC - 2000 AD
This stage leads to a fall in death rates and an increase in population.[9] The changes leading to this stage in Europe were initiated in the Agricultural Revolution of the 18th century and were initially quite slow. In the 20th century, the falls in death rates in developing countries tended to be substantially faster. Countries in this stage include Yemen, Afghanistan, the Palestinian territories, Bhutan and Laos and much of Sub-Saharan Africa (but do not include South Africa, Zimbabwe, Botswana, Swaziland, Lesotho, Namibia, Kenya and Ghana, which have begun to move into stage 3).[10]
The decline in the death rate is due initially to two factors:
- First, improvements in the food supply brought about by higher yields in agricultural practices and better transportation prevent death due to starvation and lack of water. Agricultural improvements included crop rotation, selective breeding, and seed drill technology.
- Second, significant improvements in public health reduce mortality, particularly in childhood. These are not so much medical breakthroughs (Europe passed through stage two before the advances of the mid-20th century, although there was significant medical progress in the 19th century, such as the development of vaccination) as they are improvements in water supply, sewerage, food handling, and general personal hygiene following from growing scientific knowledge of the causes of disease and the improved education and social status of mothers.
A consequence of the decline in mortality in Stage Two is an increasingly rapid rise in population growth (a "population explosion") as the gap between deaths and births grows wider. Note that this growth is not due to an increase in fertility (or birth rates) but to a decline in deaths. This change in population occurred in northwestern Europe during the 19th century due to the Industrial Revolution. During the second half of the 20th century less-developed countries entered Stage Two, creating the worldwide population explosion that has demographers concerned today.

Another characteristic of Stage Two of the demographic transition is a change in the age structure of the population. In Stage One, the majority of deaths are concentrated in the first 5–10 years of life. Therefore, more than anything else, the decline in death rates in Stage Two entails the increasing survival of children and a growing population. Hence, the age structure of the population becomes increasingly youthful and more of these children enter the reproductive cycle of their lives while maintaining the high fertility rates of their parents. The bottom of the "age pyramid" widens first, accelerating population growth. The age structure of such a population is illustrated by using an example from the Third World today.
Stage Three
Stage Three moves the population towards stability through a decline in the birth rate.[11] Several factors contribute to this eventual decline, although some of them remain speculative:
- In rural areas continued decline in childhood death means that at some point parents realize they need not require so many children to be born to ensure a comfortable old age. As childhood death continues to fall and incomes increase parents can become increasingly confident that fewer children will suffice to help in family business and care for them in old age.
- Increasing urbanization changes the traditional values placed upon fertility and the value of children in rural society. Urban living also raises the cost of dependent children to a family. A recent theory suggests that urbanization also contributes to reducing the birth rate because it disrupts optimal mating patterns. A 2008 study in Iceland found that the most fecund marriages are between distant cousins. Genetic incompatibilities inherent in more distant outbreeding makes reproduction harder.[12]
- In both rural and urban areas, the cost of children to parents is exacerbated by the introduction of compulsory education acts and the increased need to educate children so they can take up a respected position in society. Children are increasingly prohibited under law from working outside the household and make an increasingly limited contribution to the household, as school children are increasingly exempted from the expectation of making a significant contribution to domestic work. Even in equatorial Africa, children now need to be clothed, and may even require school uniforms. Parents begin to consider it a duty to buy children books and toys. Partly due to education and access to family planning, people begin to reassess their need for children and their ability to raise them.[8]
 A major factor in reducing birth rates in stage 3 countries such as Malaysia is the availability of family planning facilities, like this one in Kuala Terengganu, Terengganu, Malaysia.
 - Increasing female literacy and employment lower the uncritical acceptance of childbearing and motherhood as measures of the status of women. Working women have less time to raise children; this is particularly an issue where fathers traditionally make little or no contribution to child-raising, such as southern Europe or Japan. Valuation of women beyond childbearing and motherhood becomes important.
- Improvements in contraceptive technology are now a major factor. Fertility decline is caused as much by changes in values about children and sex as by the availability of contraceptives and knowledge of how to use them.
The resulting changes in the age structure of the population include a reduction in the youth dependency ratio and eventually population aging. The population structure becomes less triangular and more like an elongated balloon. During the period between the decline in youth dependency and rise in old age dependency there is a demographic window of opportunity that can potentially produce economic growth through an increase in the ratio of working age to dependent population; the demographic dividend.
However, unless factors such as those listed above are allowed to work, a society's birth rates may not drop to a low level in due time, which means that the society cannot proceed to Stage Four and is locked in what is called a demographic trap.
Countries that have experienced a fertility decline of over 40% from their pre-transition levels include: Costa Rica, El Salvador, Panama, Jamaica, Mexico, Colombia, Ecuador, Guyana, Surinam, Philippines, Indonesia, Malaysia, Sri Lanka, Turkey, Azerbaijan, Turkmenistan, Uzbekistan, Egypt, Tunisia, Algeria, Morocco, Lebanon, South Africa, India, Saudi Arabia, and many Pacific islands.
Countries that have experienced a fertility decline of 25-40% include: Honduras, Guatemala, Nicaragua, Paraguay, Bolivia, Vietnam, Myanmar, Bangladesh, Tajikistan, Jordan, Qatar, Albania, United Arab Emirates, Zimbabwe, and Botswana.
Countries that have experienced a fertility decline of 10-25% include: Haiti, Papua New Guinea, Nepal, Pakistan, Syria, Iraq, Libya, Sudan, Kenya, Ghana and Senegal.[10]
Stage Four
This occurs where birth and death rates are both low. Therefore the total population is high and stable.[13] Some theorists[who?] consider there are only 4 stages and that the population of a country will remain at this level. The DTM is only a suggestion about the future population levels of a country. It is not a prediction.
Countries that are at this stage (Total Fertility Rate of less than 2.5 in 1997) include: United States, Canada, Argentina, Australia, New Zealand, all of Europe[14], Bahamas, Puerto Rico, Trinidad and Tobago, Brazil, Sri Lanka, South Korea, Singapore, Iran, China, Turkey, Thailand and Mauritius.[10]
Stage Five
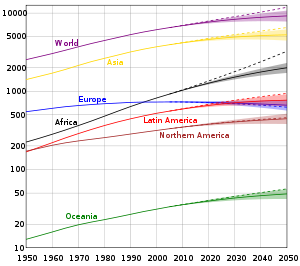 United Nation's population projections by location.
Note the vertical axis is logarithmic and represents millions of people.The original Demographic Transition model has just four stages; however, some theorists consider that a fifth stage is needed to represent countries that have sub-replacement fertility (that is, below 2.1 children per woman). Most European and many East Asian countries now have higher death rates than birth rates. In this stage, population aging and population decline will eventually occur to some extent, presuming that sustained mass immigration does not occur.
Possible Stage Six
There may even be a further stage of demographic development. In an article in the August 2009 issue of Nature, Myrskyla, Kohler and Billari show that previously negative relationship between national wealth (as measured by the human development index (HDI)) and birth rates has become J-shaped. Development promotes fertility decline at low and medium HDI levels, but advanced HDI promotes a rebound in fertility.[15] In many countries with very high levels of development (around 0.95) fertility rates are now approaching two children per woman - although there are exceptions, notably Germany and Japan.[16]
Effects on age structure
The decline in death rate and birth rate that occurs during the demographic transition leads to a radical transformation of the age structure. When the death rate declines during the second stage of the transition, the result is primarily an increase in the child population. The reason is that when the death rate is high (stage one), the infant mortality rate is very high, often above 200 deaths per 1000 children born. When the death rate falls or improves, this, in general, results in a significantly lower infant mortality rate and, hence, increased child survival. Over time, as cohorts increased by higher survival rates get older, there will also be an increase in the number of older children, teenagers, and young adults. This implies that there is an increase in the fertile population which, with constant fertility rates, will lead to an increase in the number of children born. This will further increase the growth of the child population. The second stage of the demographic transition, therefore, implies a rise in child dependency.
Historical studies
Britain
Between 1750 and 1975 England experienced the transition from high levels of both mortality and fertility, to low levels. A major factor was the sharp decline in the death rate for infectious diseases, which has fallen from about 11 per 1,000 to less than 1 per 1,000. By contrast, the death rate from other causes was 12 per 1,000 in 1850 and has not declined markedly. The agricultural revolution and the development of transport, initiated by the construction of canals, led to greater availability of food and coal, and enabled the Industrial Revolution to improve the standard of living. Scientific discoveries and medical breakthroughs did not, in general, contribute importantly to the early major decline in infectious disease mortality, and the decline in fertility occurred before efficient contraception became available.
Ireland
In the 1980s and early 1990s, the Irish demographic status converged to the European norm. Mortality rose above the European Community average, and in 1991 Irish fertility fell to replacement level. The peculiarities of Ireland's past demography and its recent rapid changes challenge established theory. The recent changes have mirrored inward changes in Irish society, with respect to family planning, women in the work force, the sharply declining power of the Catholic Church, and the emigration factor.[17]
France
France displays real divergences from the standard model of Western demographic evolution. The uniqueness of the French case arises from its specific demographic history, its historic cultural values, and its internal regional dynamics. France's demographic profile is similar to its European neighbors and to developed countries in general, yet it seems to be staving off the population decline of Western countries. With 62.9 million inhabitants in 2006, it is the second most populous country in the European Union, and it displays a certain demographic dynamism, with a growth rate of 2.4% between 2000 and 2005, above the European average. More than two-thirds of that growth can be ascribed to a natural increase resulting from high fertility and birthrates. In contrast, France is one of the developed nations whose migratory balance is rather weak, which is an original feature at the European level. Several interrelated reasons account for such singularities, in particular the impact of pro-family policies accompanied by greater unmarried households and out-of-wedlock births. These general demographic trends parallel equally important changes in regional demographics. Since 1982 the same significant tendencies have occurred throughout mainland France: demographic stagnation in the least-populated rural regions and industrial regions in the northwest, with strong growth in the southwest and along the Atlantic coast, plus dynamism in metropolitan areas. Shifts in population between regions account for most of the differences in growth. The varying demographic evolution regions can be analyzed though the filter of several parameters, including residential facilities, economic growth, and urban dynamism, which yield several distinct regional profiles. The distribution of the French population therefore seems increasingly defined not only by interregional mobility but also by the residential preferences of individual households. These challenges, linked to configurations of population and the dynamics of distribution, inevitably raise the issue of town and country planning. The most recent census figures show that an outpouring of the urban population means that fewer rural areas are continuing to register a negative migratory flow - two-thirds of rural communities have shown some since 2000. The spatial demographic expansion of large cities amplifies the process of peri-urbanization yet is also accompanied by movement of selective residential flow, social selection, and sociospatial segregation based on income.[18]
Asia
McNicoll (2006) examines the common features behind the striking changes in health and fertility in East and Southeast Asia in the 1960s-1990s, focusing on seven countries: Taiwan and South Korea ("tiger" economies), Thailand, Malaysia, and Indonesia ("second wave" countries), and China and Vietnam ("market-Leninist" economies). Demographic change can be seen as a byproduct of social and economic development together with, in some cases, strong governmental pressures. The transition sequence entailed the establishment of an effective, typically authoritarian, system of local administration, providing a framework for promotion and service delivery in health, education, and family planning. Subsequent economic liberalization offered new opportunities for upward mobility - and greater risks of backsliding - but these opportunities were accompanied by the erosion of social capital and the breakdown or privatization of service programs.
Korea
Cha (2007) analyzes a panel dataset to explore how industrial revolution, demographic transition, and human capital accumulation interacted in Korea from 1916-38. Income growth and public investment in health caused mortality to fall, which suppressed fertility and promoted education. Industrialization, skill premium, and closing gender wage gap further induced parents to opt for child quality. Expanding demand for education was accommodated by an active public school building program. The interwar agricultural depression aggravated traditional income inequality, raising fertility and impeding the spread of mass schooling. Landlordism collapsed in the wake of de-colonization, and the consequent reduction in inequality accelerated human and physical capital accumulation, hence growth in South Korea.[19]
Africa
Campbell has studied the demography of 19th-century Madagascar in the light of demographic transition theory. Both supporters and critics of the theory hold to an intrinsic opposition between human and "natural" factors, such as climate, famine, and disease, influencing demography. They also suppose a sharp chronological divide between the precolonial and colonial eras, arguing that whereas "natural" demographic influences were of greater importance in the former period, human factors predominated thereafter. Campbell argues that in 19th-century Madagascar the human factor, in the form of the Merina state, was the predominant demographic influence. However, the impact of the state was felt through natural forces, and it varied over time. In the late 18th and early 19th centuries Merina state policies stimulated agricultural production, which helped to create a larger and healthier population and laid the foundation for Merina military and economic expansion within Madagascar. From 1820, the cost of such expansionism led the state to increase its exploitation of forced labor at the expense of agricultural production and thus transformed it into a negative demographic force. Infertility and infant mortality, which were probably more significant influences on overall population levels than the adult mortality rate, increased from 1820 due to disease, malnutrition, and stress, all of which stemmed from state forced labor policies. Available estimates indicate little if any population growth for Madagascar between 1820 and 1895. The demographic "crisis" in Africa, ascribed by critics of the demographic transition theory to the colonial era, stemmed in Madagascar from the policies of the imperial Merina regime, which in this sense formed a link to the French regime of the colonial era. Campbell thus questions the underlying assumptions governing the debate about historical demography in Africa and suggests that the demographic impact of political forces be reevaluated in terms of their changing interaction with "natural" demographic influences.[20]
Russia
Russia has been undergoing a unique demographic transition since the 1980s; observers call it a "demographic catastrophe": the number of deaths exceeds the number of births, life expectancy is drastically decreasing and the number of suicides has increased.[21]
United States
Greenwood and Seshadri (2002) show that from 1800 to 1940 there was a demographic shift from a mostly rural US population with high fertility, with an average of seven children born per white woman, to a minority (43%) rural population with low fertility, with an average of two births per white woman. This shift resulted from technological progress. A sixfold increase in real wages made children more expensive in terms of forgone opportunities to work and increases in agricultural productivity reduced rural demand for labor, a substantial portion of which traditionally had been performed by children in farm families.
A simplification of the DTM theory proposes an initial decline in mortality followed by a later drop in fertility. The changing demographics of the U.S. in the last two centuries did not parallel this model. Beginning around 1800, there was a sharp fertility decline; at this time, an average woman usually produced seven births per lifetime, but by 1900 this number had dropped to nearly four. A mortality decline was not observed in the U.S. until almost 1900—a hundred years following the drop in fertility.
However, this late decline occurred from a very low initial level. It's been estimated that the crude death rate in 17th century rural New England was already as low as 20 deaths per 1000 residents per year (levels of up to 40 per 1000 being typical during stages one and two). The phenomenon is explained by the pattern of colonization of the United States: high death rates unavoidably had to match high birth rates in densely populated Europe, whereas in the United States, westward expansion of the frontier into sparsely populated interior allowed ample room to absorb all the excess people, resulting in exponential population growth (from less than 4 million people in 1790, to 23 million in 1850, to 76 million in 1900.)
Today, the U.S. is recognized as having both low fertility and mortality rates. Specifically, birth rates stand at 14 per 1000 per year and death rates at 8 per 1000 per year.[22]
Critical evaluation
It has to be remembered that the DTM is only a model and cannot necessarily predict the future. It does however give an indication of what the future birth and death rates may be for an underdeveloped country, together with the total population size. Most particularly, of course, the DTM makes no comment on change in population due to migration. It is not applicable for high levels of development, as it has been shown that after a HDI of 0.9 the fertility increases again.[3]
Non-applicability to less-developed countries
DTM has a questionable applicability to less economically developed countries (LEDCs), where wealth and information access are limited. For example, the DTM has been validated primarily in Europe, Japan and North America where demographic data exists over centuries, whereas high quality demographic data for most LDCs did not become widely available until the mid-20th century.[23] DTM does not account for recent phenomena such as AIDS; in these areas HIV has become the leading source of mortality. Some trends in waterborne bacterial infant mortality are also disturbing in countries like Malawi, Sudan and Nigeria; for example, progress in the DTM clearly arrested and reversed between 1975 and 2005.[24]
Economic development not sufficient cause to effect demographic change
DTM assumes that population changes are induced by industrial changes and increased wealth, without taking into account the role of social change in determining birth rates, e.g., the education of women. In recent decades more work has been done on developing the social mechanisms behind it.[2]
DTM assumes that the birth rate is independent of the death rate. Nevertheless, demographers maintain that there is no historical evidence for society-wide fertility rates rising significantly after high mortality events. Notably, some historic populations have taken many years to replace lives after events such as the Black Death.
Some have claimed that DTM does not explain the early fertility declines in much of Asia in the second half of the 20th century or the delays in fertility decline in parts of the Middle East. Nevertheless, the demographer John C Caldwell has suggested that the reason for the rapid decline in fertility in some developing countries compared to Western Europe, the United States, Canada, Australia and New Zealand is mainly due to government programs and a massive investment in education both by governments and parents.[10]
See also
- Demographic economics
- Demographic window
- Demographic dividend
- Overpopulation
- Epidemiological transition
- Malthusian catastrophe
Further reading
- Carrying capacity
- Caldwell, John C. (1976). "Toward a restatement of demographic transition theory". Population and Development Review 2 (3/4): 321–366. doi:10.2307/1971615. JSTOR 1971615.
- Caldwell, John C.; Bruce K Caldwell, Pat Caldwell, Peter F McDonald, Thomas Schindlmayr (2006). Demographic Transition Theory. Dordrecht, The Netherlands: Springer. pp. 418. ISBN 1-4020-4373-2.
- Chesnais, Jean-Claude. The Demographic Transition: Stages, Patterns, and Economic Implications: A Longitudinal Study of Sixty-Seven Countries Covering the Period 1720-1984. Oxford U. Press, 1993. 633 pp.
- Coale, Ansley J. 1973. "The demographic transition," IUSSP Liege International Population Conference. Liege: IUSSP. Volume 1: 53-72.
- Coale, Ansley J., Barbara A. Anderson, and Erna Härm. 1979. Human Fertility in Russia since the Nineteenth Century. Princeton, NJ: Princeton University Press.
- Coale, Ansley J. and Susan C. Watkins, Eds. 1987. The Decline of Fertility in Europe. Princeton, N.J.: Princeton University Press.
- Davis, Kingsley. 1945. "The World Demographic Transition." Annals of the American Academy of Political and Social Science, 1945 237: 1-11. classic article that introduced concept of transition in JSTOR
- Davis, Kingsley. 1963. "The theory of change and response in modern demographic history." Population Index 29(October): 345-366.
- Friedlander, Dov, Barbara S. Okun and Sharon Segal, "The Demographic Transition Then and Now: Processes, Perspectives, and Analyses." Journal of Family History 1999 24(4): 493-533. Issn: 0363-1990 Fulltext: in Ebsco
- Oded Galor. 2005. "The Demographic Transition and the Emergence of Sustained Economic Growth." Journal of the European Economic Association, 3, 494-504.
- Oded Galor. 2008. "The Demographic Transition." New Palgrave Dictionary of Economics - 2nd edition, Macmillan.
- Gillis, John R., Louise A. Tilly, and David Levine, eds. The European Experience of Declining Fertility, 1850-1970: The Quiet Revolution. 1992.
- Greenwood, Jeremy; Seshadri, Ananth (2002). "The U.S. Demographic Transition". American Economic Review 92 (2): 153–159. doi:10.1257/000282802320189168. JSTOR 3083393.
- Harbison, Sarah F.; Robinson, Warren C. (2002). "Policy Implications of the Next World Demographic Transition". Studies in Family Planning 33 (1): 37–48. doi:10.1111/j.1728-4465.2002.00037.x. JSTOR 2696331. PMID 11974418.
- Hirschman, Charles (1994). "Why fertility changes". Annual Review of Sociology 20: 203–233. doi:10.1146/annurev.so.20.080194.001223. PMID 12318868.
- Jones, G. W. et al., eds. The Continuing Demographic Transition. 1997. online edition
- Korotayev, Andrey; Malkov, Artemy & Khaltourina, Daria (2006). Introduction to Social Macrodynamics: Compact Macromodels of the World System Growth. Moscow, Russia: URSS. pp. 128. ISBN 5-484-00414-4 (?). http://edurss.ru/cgi-bin/db.pl?lang=en&blang=en&page=Book&list=14&id=34250.
- Kirk, Dudley (1996). "The Demographic Transition". Population Studies 50 (3): 361–387. doi:10.1080/0032472031000149536. JSTOR 2174639. PMID 11618374.
- Borgerhoff, Luttbeg B.; Borgerhoff Mulder, M. and Mangel, M. S. (2000). To marry or not to marry? A dynamic model of marriage behavior and demographic transition.. http://www.anthro.ucdavis.edu/faculty/monique/MBMWeb/Moniqueshomepage.htm. (Note: Click "Publications," then click on title.) in Cronk, L.; N. A. Chagnon and W. Irons, eds. (2000). Human behavior and adaptation: An anthropological perspective.. New York: Aldine Transaction. pp. 528. ISBN 0-202-02044-4.
- Landry, Adolphe, 1982 [1934], La révolution démographique - Études et essais sur les problèmes de la population, Paris, INED-Presses Universitaires de France
- Montgomery, Keith. The Demographic Transition
- McNicoll, Geoffrey. "Policy Lessons of the East Asian Demographic Transition," Population and Development Review, Vol. 32, No. 1 (Mar., 2006), pp. 1–25
- Notestein, Frank W. 1945. "Population — The Long View," in Theodore W. Schultz, Ed., Food for the World. Chicago: University of Chicago Press.
- Saito, Oasamu. "Historical Demography: Achievements and Prospects." Population Studies 1996 50(3): 537-553. Issn: 0032-4728 in Jstor
- Soares, Rodrigo R., and Bruno L. S. Falcão. "The Demographic Transition and the Sexual Division of Labor," Journal of Political Economy, Vol. 116, No. 6 (Dec., 2008), pp. 1058–1104
- Szreter, Simon. "The Idea of Demographic Transition and the Study of Fertility: A Critical Intellectual History." Population and Development Review, 1993. 19:4, pp 659–701. in JSTOR
- Szreter, Simon; Nye, Robert A.; and Poppel, Frans Van. "Fertility and Contraception During the Demographic Transition: Qualitative and Quantitative Approaches." Journal of Interdisciplinary History 2003 34(2): 141-154. Issn: 0022-1953 Fulltext: in Project Muse and Ebsco
- Thompson, Warren S. 1929. "Population". American Journal of Sociology 34(6): 959-975. After the next World War, we will see Germany lose more women and children and soon start again from a developing stage.
References
- ^ "Warren Thompson". Encyclopedia of Population. 2. Macmillan Reference. 2003. pp. 939–940. ISBN 0-02-865677-6.
- ^ a b Caldwell, John C.; Bruce K Caldwell, Pat Caldwell, Peter F McDonald, Thomas Schindlmayr (2006). Demographic Transition Theory. Dordrecht, The Netherlands: Springer. pp. 418. ISBN 1-4020-4373-2.,p239
- ^ a b "Advances in development reverse fertility declines". Nature. 6 August 2009. http://www.nature.com/nature/journal/v460/n7256/abs/nature08230.html.
- ^ National Geographic magazine, September 2011
- ^ a b http://geography.about.com/od/culturalgeography/a/demotransition.htm
- ^ a b c d e f g h i j k l http://www.marathon.uwc.edu/geography/demotrans/demtran.htm
- ^ Barcelona fieldwork
- ^ a b Caldwell (2006), Chapter 5
- ^ BBC bitesize[dead link]
- ^ a b c d Caldwell (2006), Chapter 10
- ^ Marathon geography
- ^ "Kissing cousins, missing children".[1] The Economist 7 February 2008.
- ^ Main vision
- ^ CIA figures
- ^ Myrskyla, M., Kohler, H-P., and Billari, F. Advances in development reverse fertility declines. Nature 460, 741-743 (6 August 2009).
- ^ "The best of all possible worlds?" The Economist 6 August 2009.
- ^ D. A. Coleman, "The Demographic Transition in Ireland in International Context." Proceedings of the British Academy 1992 79: 53-77. Issn: 0068-1202
- ^ Guy Baudelle and David Olivier, "Changement Global, Mondialisation et Modele De Transition Demographique: Reflexion Sur Une Exception Française Parmi Les Pays Developpes," Historiens et Géographes 2006 98(395): 177-204. Issn: 0046-757x
- ^ Myung Soo Cha, "Industrial Revolution, Demographic Transition, and Human Capital Accumulation in Korea, 1916-38." Naksungdae Institute of Economic Research Working Paper 2007-7. online at [2]
- ^ Gwyn Campbell, "State and Pre-colonial Demographic History: the Case of Nineteenth-century Madagascar." Journal of African History 1991 32(3): 415-445. Issn: 0021-8537 Fulltext: in Jstor
- ^ George J. Demko et al, eds. Population under Duress: The Geodemography of Post-Soviet Russia. 1999. online edition
- ^ World factbook
- ^ Ronald Lee, The Demographic Transition: Three Centuries (2003)
- ^ Nigeria: Reversal of Demographic Transition


Wikimedia Foundation. 2010.