- Demographics of Bulgaria
-
Demographics of Bulgaria 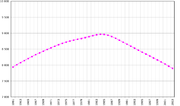
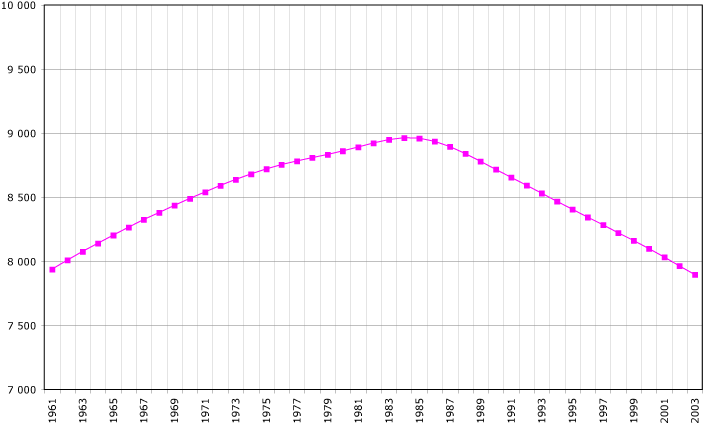
Population of Bulgaria (in millions) from 1960–2010.Population:  7 364 570 (1 February 2011) [1]
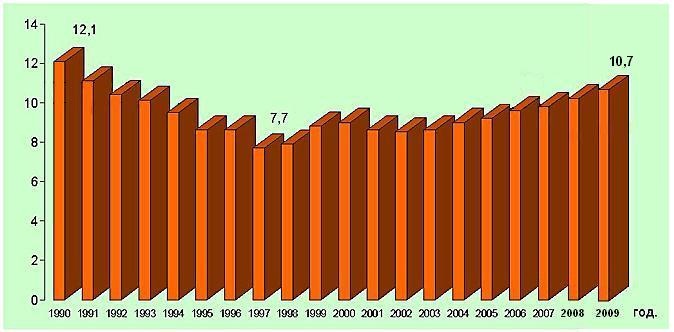
Growth rate: −4.6 people/1,000 population (2010) [2]Birth rate: 10.0 births/1,000 population (2010) [3]Death rate:  14.6 deaths/1,000 population (2010) [4]
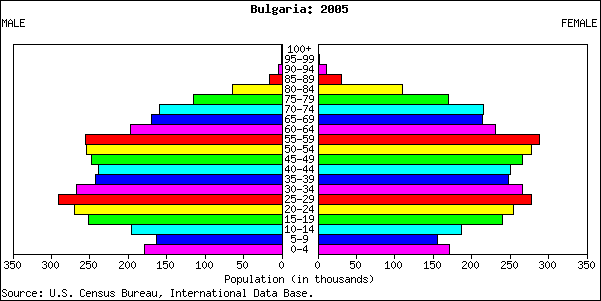
Life expectancy: 73.6 years (2010 est.)[5]–male: 70.0 years–female: 77.2 yearsFertility rate: 1.49 children born/woman (2010) [6]Infant mortality rate: 9.4 deaths/1,000 infants (2010) [7]Net migration rate: -2.2 migrant(s)/1,000 population (2009)Age structure: 0-14 years: 13.2%15-64 years: 68.3%65-over: 18.5% (Census 2011) [8]Sex ratio: At birth: 1.06 male(s)/female Under 15: 1.05 male(s)/female 15-64 years: 0.97 male(s)/female 65-over: 0.68 male(s)/female Nationality: Nationality: noun: Bulgarian(s) adjective: Bulgarian Major ethnic: Bulgarians (84.8%) Minor ethnic: Turks (8.8%) and
Roma (4.7%)Language: Official: Bulgarian Spoken: Bulgarian, others This article is about the demographic features of the population of Bulgaria, including population density, ethnicity, education level, health of the populace, economic status, religious affiliations and other aspects of the population.
Bulgaria has a high Human Development Index of 0.743, ranking 58th in the world in 2010[9] and holds the 38th position in Newsweek's rankings of the world's best countries to live in, measuring health, education, political environment and economic dynamism.[10]
Contents
Population
7,364,570 (Census 2011)[11]The interest for emigration was highest in the first years after the fall of Todor Zhivkov's regime and from 1989 to 1992 Bulgaria lost more than half million inhabitants. Thereafter the interest for emigration started reducing and now the population is comparatively stabilizing, the growth rate is again negative, but is much lower - in the past decade the country lost about 500 000 inhabitants, compared to more than 1 million in the previous decade. After the reduced emigrant interest, Bulgaria decrease with 20,000-30,000 people for a year, while some years after 1989 the country was decreasing with more than 150 000 people for a year. After the first EU census, held this year, the National Statistical Institute of Bulgaria for now gives only provisional result, which is 7,364,570 inhabitants, so to the publishing of the final data in July, 2011 is expected increasing.[12]

Ethnic groups
Population of Bulgaria according to ethnic group 1900-2011 Ethnic
groupcensus 1900 census 1910 census 1920 census 1926 census 1934 census 1946 census 1956 census 1965 1 census 1975 census 1985 census 1992 census 2001 [13] census 2011 Number % Number % Number % Number % Number % Number % Number % Number % Number % Number % Number % Number % Number % Bulgarians 2,888,000 77.1 83.3 83.2 86.4 6,506,541 85.5 87.9 90.0 83.7 6,655,210 85.9 5,666,624 84.8 Turks 531,240 14.2 465,641 10.8 520,339 10.7 577,552 10.5 591,193 9.7 675,500 9.6 656,025 8.6 780,928 9.5 8.4 822,253 9.7 746,664 9.4 588,318 8.8 Romani 89,549 2.4 122,296 2.8 98,451 2.0 138,844 2.5 2.5 170,011 2.4 197,865 2.6 148,874 1.8 2.1 313,396 3.7 350,908 4.7 325,343 4.9 Russians 10,551 0.1 10,595 0.2 9,978 0.1 Armenians 0.4 0.2 0.3 21,954 0.3 0.2 0.2 0.2 10,832 0.1 6,552 0.1 Vlachs 487 0.0 10,566 0.1 3,684 0.1 Macedonians 169,544[14] 2.4 187,789 2.5 5,071 0.0 1,654 0.0 Sarakatsani 2,085 0.0 4,107 0.0 2,556 0.0 Greeks 7,437 0.1 3,408 0.0 1,379 0.0 Ukrainians 2,489 0.0 1,789 0.0 Jews 0.9 0.9 0.6 6,027 0.1 0.1 1,363 0.0 1,162 0.0 Romanians 3,749 0.0 1,088 0.0 891 0.0 Others 13,199 0.2 35,707 0.4 19,659 0.3 Total 3,744,283 4,337,513 4,846,954 5,478,740 6,077,939 7,029,349 7,613,709 8,227,046 8,727,771 8,948,649 8,487,317 7,928,901 7,364,570 1 according to language 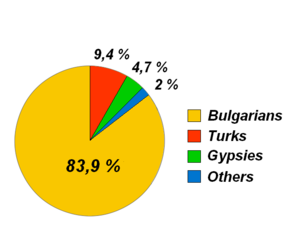
Vital statistics [15][16][17]
1900-1915
Average population (x 1000) Live births Deaths Natural change Crude birth rate (per 1000) Crude death rate (per 1000) Natural change (per 1000) 1900 3 710 157 000 84 000 73 000 42.3 22.6 19.7 1901 3 740 141 000 87 000 54 000 37.7 23.3 14.4 1902 3 800 149 000 91 000 58 000 39.2 23.9 15.3 1903 3 850 159 000 88 000 71 000 41.3 22.9 18.4 1904 3 910 167 000 84 000 83 000 42.7 21.5 21.2 1905 4 000 174 000 87 000 87 000 43.5 21.8 21.8 1906 4 100 179 000 91 000 88 000 43.7 22.2 21.5 1907 4 150 180 000 92 000 88 000 43.4 22.2 21.2 1908 4 200 169 000 102 000 67 000 40.2 24.3 16.0 1909 4 280 173 000 113 000 60 000 40.4 26.4 14.0 1910 4 350 180 000 100 000 80 000 41.4 23.0 18.4 1911 4 400 176 000 94 000 82 000 40.0 21.4 18.6 1912 4 430 185 000 91 000 94 000 41.8 20.5 21.2 1913 4 200 108 000 122 000 -14 000 25.7 29.0 -3.3 1914 4 240 191 000 88 000 103 000 45.0 20.8 24.3 1915 4 280 172 000 85 000 87 000 40.2 19.9 20.3 1916-1940
Average population (x 1000) Live births Deaths Natural change Crude birth rate (per 1000) Crude death rate (per 1000) Natural change (per 1000) 1916 4 660 99 000 97 000 2 000 21.2 20.8 0.4 1917 4 690 81 000 99 000 -18 000 17.3 21.1 -3.8 1918 4 740 100 000 152 000 -52 000 21.1 32.1 -11.0 1919 4 790 157 000 97 000 60 000 32.8 20.3 12.5 1920 4 850 193 000 104 000 89 000 39.8 21.4 18.4 1921 4 890 197 000 106 000 91 000 40.3 21.7 18.6 1922 5 010 203 000 106 000 97 000 40.5 21.2 19.4 1923 5 090 192 000 108 000 84 000 37.7 21.2 16.5 1924 5 210 207 000 108 000 99 000 39.7 20.7 19.0 1925 5 310 196 000 102 000 94 000 36.9 19.2 17.7 1926 5 420 203 000 93 000 110 000 37.5 17.2 20.3 1927 5 510 183 000 112 000 71 000 33.2 20.3 12.9 1928 5 590 185 000 99 000 86 000 33.1 17.7 15.4 1929 5 670 173 000 103 000 70 000 30.5 18.2 12.3 1930 5 740 180 000 93 000 87 000 31.4 16.2 15.2 1931 5 800 171 000 98 000 73 000 29.5 16.9 12.6 1932 5 884 186 000 96 000 90 000 31.6 16.3 15.3 1933 5 961 174 000 93 000 81 000 29.2 15.6 13.6 1934 6 039 181 795 85 046 96 749 30.1 14.1 16.0 1935 6 102 160 951 89 086 71 865 26.4 14.6 11.8 1936 6 154 159 146 87 723 71 423 25.9 14.3 11.6 1937 6 196 150 771 84 674 66 097 24.3 13.7 10.7 1938 6 244 142 415 85 373 57 042 22.8 13.7 9.1 1939 6 292 138 883 84 150 54 733 22.1 13.4 8.7 1940 6 341 140 564 85 046 55 518 22.2 13.4 8.8 1941 till present
Average population (x 1000) Live births Deaths Natural change Crude birth rate (per 1000) Crude death rate (per 1000) Natural change (per 1000) 1941 6 711 147 293 85 011 62 282 21.9 12.7 9.3 1942 6 767 153 272 88 082 65 190 22.6 13.0 9.6 1943 6 823 148 840 88 386 60 454 21.8 13.0 8.9 1944 6 879 151 013 94 082 56 931 22.0 13.7 8.3 1945 6 936 166 960 103 591 63 369 24.1 14.9 9.1 1946 6 993 179 226 95 799 83 427 25.6 13.7 11.9 1947 7 048 169 501 94 395 75 106 24.0 13.4 10.7 1948 7 130 175 771 89 927 85 844 24.7 12.6 12.0 1949 7 195 177 734 84 675 93 059 24.7 11.8 12.9 1950 7 251 182 571 74 134 108 437 25.2 10.2 15.0 1951 7 258 152 803 77 364 75 439 21.1 10.7 10.4 1952 7 275 154 014 84 254 69 760 21.2 11.6 9.6 1953 7 346 153 220 68 055 85 165 20.9 9.3 11.6 1954 7 423 149 902 68 384 81 518 20.2 9.2 11.0 1955 7 499 150 978 67 960 83 018 20.1 9.1 11.1 1956 7 576 147 910 71 153 76 757 19.5 9.4 10.1 1957 7 651 141 035 65 807 75 228 18.4 8.6 9.8 1958 7 728 138 294 60 734 77 560 17.9 7.9 10.0 1959 7 798 136 892 73 850 63 042 17.6 9.5 8.1 1960 7 867 140 082 63 665 76 417 17.8 8.1 9.7 1961 7 943 137 861 62 562 75 299 17.4 7.9 9.5 1962 8 013 134 148 69 640 64 508 16.7 8.7 8.1 1963 8 078 132 143 66 057 66 086 16.4 8.2 8.2 1964 8 144 130 958 64 479 66 479 16.1 7.9 8.2 1965 8 201 125 791 66 970 58 821 15.3 8.2 7.2 1966 8 258 123 039 68 366 54 673 14.9 8.3 6.6 1967 8 310 124 582 74 696 49 886 15.0 9.0 6.0 1968 8 370 141 460 72 176 69 284 16.9 8.6 8.3 1969 8 434 143 060 80 183 62 877 17.0 9.5 7.5 1970 8 490 138 745 77 095 61 650 16.3 9.1 7.3 1971 8 536 135 422 82 805 52 617 15.9 9.7 6.2 1972 8 576 131 316 84 174 47 142 15.3 9.8 5.5 1973 8 621 139 713 81 470 58 243 16.2 9.5 6.8 1974 8 679 149 196 85 239 63 957 17.2 9.8 7.4 1975 8 721 144 668 89 974 54 694 16.6 10.3 6.3 1976 8 759 144 929 88 348 56 581 16.5 10.1 6.5 1977 8 804 141 702 94 362 47 340 16.1 10.7 5.4 1978 8 814 136 442 92 445 43 997 15.5 10.5 5.0 1979 8 826 135 358 94 403 40 955 15.3 10.7 4.6 1980 8 862 128 190 97 950 30 240 14.5 11.1 3.4 1981 8 891 124 372 95 441 28 931 14.0 10.7 3.3 1982 8 917 124 166 100 293 23 873 13.9 11.2 2.7 1983 8 940 122 993 102 182 20 811 13.8 11.4 2.3 1984 8 961 122 303 101 419 20 884 13.6 11.3 2.3 1985 8 960 118 955 107 485 11 470 13.3 12.0 1.3 1986 8 958 120 078 104 039 16 039 13.4 11.6 1.8 1987 8 971 116 672 107 213 9 459 13.0 12.0 1.0 1988 8 981 117 440 107 385 10 055 13.1 12.0 1.1 1989 8 877 112 289 106 902 5 387 12.6 12.0 0.6 1990 8 718 105 180 108 608 -3 428 12.1 12.5 -0.4 1991 8 632 95 910 110 423 -14 513 11.1 12.8 -1.7 1992 8 540 89 134 107 998 -18 864 10.4 12.6 -2.2 1993 8 472 84 400 109 540 -25 140 10.0 12.9 -2.9 1994 8 444 79 442 111 787 -32 345 9.4 13.2 -3.8 1995 8 406 71 967 114 670 -42 703 8.6 13.6 -5.0 1996 8 363 72 188 117 056 -44 868 8.6 14.0 -5.4 1997 8 312 64 125 121 861 -57 736 7.7 14.7 -7.0 1998 8 257 65 361 118 190 -52 829 7.9 14.3 -6.4 1999 8 211 72 291 111 786 -39 495 8.8 13.6 -4.8 2000 8 170 73 679 115 087 -41 408 9.0 14.1 -5.1 2001 7 910 68 180 112 368 -44 188 8.6 14.2 -5.6 2002 7 849 66 499 112 617 -46 118 8.5 14.3 -5.8 2003 7 786 67 359 111 927 -44 568 8.6 14.3 -5.7 2004 7 724 69 886 110 110 -40 224 9.0 14.2 -5.2 2005 7 667 71 075 113 374 -42 299 9.2 14.6 -5.4 2006 7 608 78 978 105 438 -29 460 9.6 14.7 -5.1 2007 7 552 74 349 110 004 -30 655 9.8 14.8 -4.0 2008 7 497 77 712 110 523 -32 811 10.2 14.5 -3.3 2009 7 447 80 956 108 068 -27 112 10.7 14.2 -3.0 2010 7 403 75 513[18] 110 165[19] -34 652 10.0[20] 14.6[21] -4.6 2011 7 364[22] 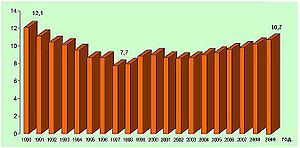
Total fertility rate
- 1.49 children born/woman (2010) [23]
Infant mortality rate
- Total: 9.4 deaths/1,000 live births (2010)[24]
- Male: 10.2 deaths/1,000 live births (2009)
- Female: 7.7 deaths/1,000 live births (2009)
Life expectancy at birth
- Total population: 73.6 years
- Male: 70.0 years
- Female: 77.2 years (2010 est.)[25]
Age structure

- 0–17 years: 16.0%
- 18–65 years: 65.1%
- 65 years and over: 18.9% (Census 2011) [26]
Urbanization
- Urban population: 72.5% of total population (Census 2011) [1]
- Rate of urbanization: -0.3% annual rate of change (2005–10 est.)
CIA World Factbook demographic statistics
Historical populations Year Pop. ±% 1887 3,154,375 — 1892 3,310,713 +5.0% 1900 3,744,283 +13.1% 1905 4,035,575 +7.8% 1910 4,337,513 +7.5% 1920 4,846,971 +11.7% 1926 5,528,741 +14.1% 1934 6,077,939 +9.9% 1946 7,029,349 +15.7% 1956 7,613,709 +8.3% 1965 8,227,866 +8.1% 1975 8,727,771 +6.1% 1985 8,948,649 +2.5% 1992 8,487,317 −5.2% 2001 7,932,984 −6.5% 2011 7,364,570 −7.2% Source: Censuses in Bulgaria The following demographic statistics are from the CIA World Factbook,[27] unless otherwise indicated.
Median age
- Total: 41.4 years
- Male: 39.2 years
- Female: 43.6 years
Sex ratio
- At birth: 1.06 male(s)/female
- Under 15 years: 1.05 male(s)/female
- 15–64 years: 0.97 male(s)/female
- 65 years and over: 0.68 male(s)/female
- Total population: 0.92 male(s)/female (2009 est.)
HIV/AIDS
- Adult prevalence rate: less than 0.1% (2011 est.)
- People living with HIV/AIDS: 803 (November 2007)[28]
- Deaths: 100 (2011 est.)
Nationality
- Noun: Bulgarian(s)
- Adjective: Bulgarian
Religion
- Orthodox Christian 85.6%,
Muslim 10.2%, Roman Catholic 0.6%, Protestant 0.5%, other 0.2%, undeclared and not shown 2.9% (2011 census)[29]
Languages
The 2011 census defines an ethnic group as a "community of people, related to each other by origin and language, and close to each other by mode of life and culture"; and one's mother tongue as "the language a person speaks best and usually uses for communication in the family (household)".[31]
Native Language By ethnic group Percentage By first language Percentage Bulgarian 5,664,624 76.9% 5,666,624 86.8% Turkish 588,318 8.0% 528,318 7.8% Romani 325,343 4.4% 280,908 3.7% Others 49,304 0.7% 45,226 0.7% Refuse to answer 736,981 10.0% 45,226 0.7% Total 7,364,570 100% 7,364,570 100% [31] Literacy
- Definition: age 15 and over can read and write
- Total: 98.2%
- Male: 98.7%
- Female: 100.0% (2011 census)
Education expenditures
- 4.5% of total GDP (2005)
See also
- Immigration to Bulgaria
- Immigration to Europe
- List of countries by immigrant population
- Bulgaria
- Aging of Europe
References
- ^ a b [http://www.nsi.bg/census2011/PDOCS2/Census2011final_en.pdf 2011 Bulgarian census] (in English)
- ^ http://www.nsi.bg/EPDOCS/Population2010.pdf
- ^ http://www.nsi.bg/EPDOCS/Population2010.pdf
- ^ http://www.nsi.bg/EPDOCS/Population2010.pdf
- ^ http://www.nsi.bg/EPDOCS/Population2010.pdf
- ^ http://www.nsi.bg/EPDOCS/Population2010.pdf
- ^ http://www.nsi.bg/EPDOCS/Population2010.pdf
- ^ http://www.nsi.bg/census2011/PDOCS2/Census2011final_en.pdf
- ^ Human development index trends, Human development indices by the United Nations. Retrieved on 8 October 2011
- ^ "Interactive Infographic of the World’s Best Countries". Newsweek.com. 2010-08-15. http://www.newsweek.com/2010/08/15/interactive-infographic-of-the-worlds-best-countries.html. Retrieved 2011-07-24.
- ^ http://www.nsi.bg/EPDOCS/Census2011pr.pdf
- ^ http://www.nsi.bg/EPDOCS/Census2011pr.pdf
- ^ "НАСЕЛЕНИЕ КЪМ 01.03.2001 Г. ПО ОБЛАСТИ И ЕТНИЧЕСКА ГРУПА (Inhabitants as at 01.03.2001 by province and ethnic group)". NSI. 1 March 2001. http://www.nsi.bg/Census/Ethnos.htm.
- ^ Georgeoff, Peter John (with David Crowe), “National Minorities in Bulgaria, 1919- 1980” in Horak, Stephen, ed., Eastern European National Minorities 1919/1980: A Handbook, (Littleton, Co: Libraries Limited, Inc.).
- ^ B.R. Mitchell. European historical statistics, 1750-1975.
- ^ http://unstats.un.org/unsd/demographic/products/dyb/dybsets/1948%20DYB.pdf United nations. Demographic Yearbook 1948
- ^ National Statistical Institute of Bulgaria
- ^ http://www.nsi.bg/EPDOCS/Population2010.pdf
- ^ http://www.nsi.bg/EPDOCS/Population2010.pdf
- ^ http://www.nsi.bg/EPDOCS/Population2010.pdf
- ^ http://www.nsi.bg/EPDOCS/Population2010.pdf
- ^ http://www.nsi.bg/census2011/PDOCS2/Census2011final_en.pdf
- ^ http://www.nsi.bg/EPDOCS/Population2010.pdf
- ^ http://www.nsi.bg/EPDOCS/Population2010.pdf
- ^ http://www.nsi.bg/EPDOCS/Population2010.pdf
- ^ http://www.nsi.bg/census2011/pagebg2.php?p2=36&sp2=37&SSPP2=40
- ^ "CIA – The World Factbook – Bulgaria". CIA. 24 February 2010. https://www.cia.gov/library/publications/the-world-factbook/geos/bu.html.
- ^ Kristalina Ilieva (27 November 2007). "803 HIV- Positive Registered Officially in Bulgaria". News.bg. http://international.ibox.bg/news/id_1502149034.
- ^ "НАСЕЛЕНИЕ КЪМ 01.02.2011 Г. ПО ОБЛАСТИ И ВЕРОИЗПОВЕДАНИЕ (Inhabitants as at 01.02.2011 by province and religion)". NSI. 1 February 2011. http://www.nsi.bg/Census/Religion.htm.
- ^ "НАСЕЛЕНИЕ КЪМ 01.02.2011 Г. ПО ОБЛАСТИ И МАЙЧИН ЕЗИК (Inhabitants as at 01.02.2011 by province and mother tongue)". NSI. 1 February 2011. http://www.nsi.bg/Census/MotherTongue.htm.
- ^ a b Cultrual Policies and Trends in Europe. "Population by ethnic group and mother tongue, 2001". http://www.culturalpolicies.net/web/bulgaria.php?aid=421. Retrieved 2 December 2008.
 This article incorporates public domain material from the CIA World Factbook document "2008 edition".
External links
- 2005 Eurostat Report on European Demography
- Annual report of the National Statistics Institute for 2005 regarding population and demographic processes
- Bulgarian Subject Files – Social Issues: Minorities Open Society Archives, Budapest
Demographics of Europe Sovereign
states- Albania
- Andorra
- Armenia
- Austria
- Azerbaijan
- Belarus
- Belgium
- Bosnia and Herzegovina
- Bulgaria
- Croatia
- Cyprus
- Czech Republic
- Denmark
- Estonia
- Finland
- France
- Georgia
- Germany
- Greece
- Hungary
- Iceland
- Ireland
- Italy
- Kazakhstan
- Latvia
- Liechtenstein
- Lithuania
- Luxembourg
- Macedonia
- Malta
- Moldova
- Monaco
- Montenegro
- Netherlands
- Norway
- Poland
- Portugal
- Romania
- Russia
- San Marino
- Serbia
- Slovakia
- Slovenia
- Spain
- Sweden
- Switzerland
- Turkey
- Ukraine
- United Kingdom
- (England
- Northern Ireland
- Scotland
- Wales)
- Vatican City
States with limited
recognition- Abkhazia
- Kosovo
- Nagorno-Karabakh
- Northern Cyprus
- South Ossetia
- Transnistria
Dependencies
and other territories- Åland
- Faroe Islands
- Gibraltar
- Guernsey
- Jan Mayen
- Jersey
- Isle of Man
- Svalbard
Other entities - European Union
 Ethnic groups in Bulgaria
Bulgarians (6,655,210) ·
minorities: Turks (746,664) · Roma (370,908) · Russians (15,595) · Armenians (10,832) · Vlachs (10,566) · ethnic Macedonians (5,071) · Sarakatsani (4,107) · Greeks (3,408) ·
Ukrainians (2,489) Jews (1,363) · Romanians (1,088) · Germans (436) · Albanians (278) · Czechs and Slovaks (350) · Arabs (c. 10,000) · Chinese (c. 10,000) ·
Vietnamese (c. 1,500) · Black Africans ·Categories:- Bulgarian society
- Demographics by country
- Demographics of Bulgaria


Wikimedia Foundation. 2010.