- Demographics of Armenia
-
The Demographics of Armenia is about the demographic features of the population of Armenia, including population growth, population density, ethnicity, education level, health, economic status, religious affiliations, and other aspects of the population.
Contents
Demographics trends
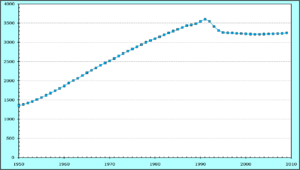
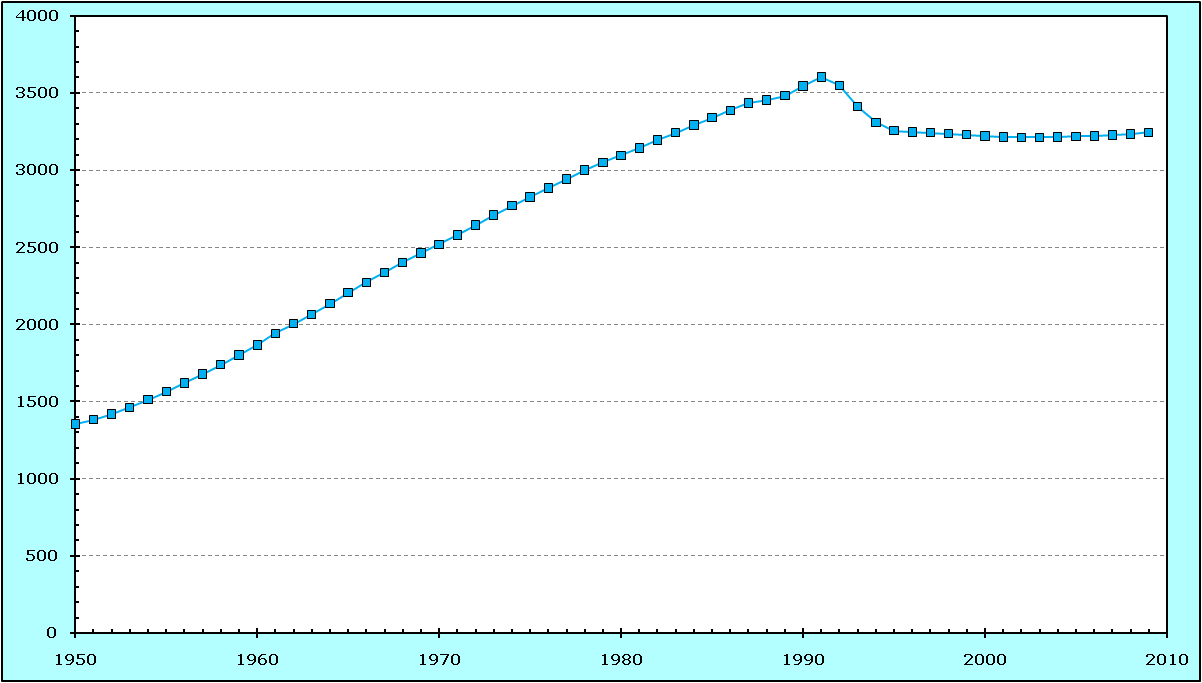
After registering a steady increase all through the Soviet period, the population of Armenia declined from 3.604 million in 1991 to 3.211 million in 2003. The latest estimate is 3.251 million on January 1, 2010.
Armenia is the only republic of the former Soviet Union that has a nearly-homogeneous population. It is also the second-most densely populated post-Soviet state after Moldova. Ethnic minorities include Russians, Assyrians, Ukrainians, Yazidi Kurds, Iranians, Greeks, Georgians, and Belarusians. There are also smaller communities of Vlachs, Mordvins, Ossetians, Udis, and Tats. Minorites of Poles and Caucasus Germans also exist though they are heavily Russified.[1]
Most Armenians are Christian, primarily of Oriental Orthodox rite. Armenia is considered the first nation to adopt Christianity, which was first preached in Armenia by two Apostles of Jesus, St. Bartholomew and St. Thaddeus in the 1st century. The Armenian Apostolic Church can trace its roots back to the 3rd and 4th centuries. The country formally adopted the Christian faith in 301 A.D. Over 90% of Armenians belong to the Armenian Apostolic Church, a form of Oriental (Non-Chalcedonianism) Orthodoxy, which is a very ritualistic, conservative church, roughly comparable to the Coptic and Syrian churches. Armenia also has a population of Catholics and evangelical Protestants.
There has been a problem of population decline due to elevated levels of emigration after the break-up of the USSR. The rates of emigration and population decline, however, have decreased drastically in the recent years, and a moderate influx of Armenians returning to Armenia have been the main reasons for the trend, which is expected to continue. In fact Armenia is expected to resume its positive population growth by 2010. According to Birthright Armenia website, a census done in 2004 shows Armenia's population to be 2.7 million.[2]
Vital statistics[3][4][5]
Average population (x 1000) Live births1 Deaths1 Natural change Crude birth rate (per 1000) Crude death rate (per 1000) Natural change (per 1000) 1950 1 354 43 500 11 500 32 000 32.1 8.5 23.6 1951 1 383 49 900 12 400 37 500 36.1 9.0 27.1 1952 1 420 54 100 12 900 41 200 38.1 9.1 29.0 1953 1 463 51 400 14 000 37 400 35.1 9.6 25.6 1954 1 511 58 300 12 400 45 900 38.6 8.2 30.4 1955 1 564 59 400 13 800 45 600 38.0 8.8 29.2 1956 1 619 62 300 12 300 50 000 38.5 7.6 30.9 1957 1 678 67 100 14 100 53 000 40.0 8.4 31.6 1958 1 739 71 500 14 100 57 400 41.1 8.1 33.0 1959 1 802 72 400 14 100 58 300 40.2 7.8 32.4 1960 1 867 74 825 12 675 62 150 40.1 6.8 33.3 1961 1 942 72 377 12 496 59 881 37.3 6.4 30.8 1962 2 005 69 505 13 297 56 208 34.7 6.6 28.0 1963 2 064 67 382 12 046 55 336 32.6 5.8 26.8 1964 2 133 64 454 12 415 52 039 30.2 5.8 24.4 1965 2 205 62 969 12 582 50 387 28.6 5.7 22.9 1966 2 273 61 594 12 445 49 149 27.1 5.5 21.6 1967 2 337 57 031 12 622 44 409 24.4 5.4 19.0 1968 2 401 57 503 12 231 45 272 23.9 5.1 18.9 1969 2 462 56 203 12 782 43 421 22.8 5.2 17.6 1970 2 518 55 694 12 844 42 850 22.1 5.1 17.0 1971 2 580 58 188 12 518 45 670 22.6 4.9 17.7 1972 2 644 59 313 13 730 45 583 22.4 5.2 17.2 1973 2 708 59 593 14 102 45 491 22.0 5.2 16.8 1974 2 770 60 419 14 276 46 143 21.8 5.2 16.7 1975 2 826 62 866 15 498 47 368 22.2 5.5 16.8 1976 2 883 65 065 15 688 49 377 22.6 5.4 17.1 1977 2 943 65 830 15 813 50 017 22.4 5.4 17.0 1978 3 001 66 698 16 465 50 233 22.2 5.5 16.7 1979 3 051 69 786 17 125 52 661 22.9 5.6 17.3 1980 3 096 70 324 17 124 53 200 22.7 5.5 17.2 1981 3 144 73 682 16 659 57 023 23.4 5.3 18.1 1982 3 194 74 225 17 469 56 756 23.2 5.5 17.8 1983 3 243 76 436 18 369 58 067 23.6 5.7 17.9 1984 3 292 79 767 19 043 60 724 24.2 5.8 18.4 1985 3 339 80 306 19 581 60 725 24.1 5.9 18.2 1986 3 387 81 192 19 410 61 782 24.0 5.7 18.2 1987 3 435 78 492 19 727 58 765 22.9 5.7 17.1 1988 3 453 74 707 35 5672 39 140 21.6 10.3 11.3 1989 3 482 75 250 20 853 54 397 21.6 6.0 15.6 1990 3 545 79 882 21 993 57 889 22.5 6.2 16.3 1991 3 604 77 825 23 425 54 400 21.6 6.5 15.1 1992 3 549 70 581 25 824 44 757 19.9 7.3 12.6 1993 3 410 59 041 27 500 31 541 17.3 8.1 9.2 1994 3 309 51 143 24 648 26 495 15.5 7.4 8.0 1995 3 255 48 960 24 842 24 118 15.0 7.6 7.4 1996 3 247 48 134 24 936 23 198 14.8 7.7 7.1 1997 3 242 43 929 23 985 19 944 13.5 7.4 6.2 1998 3 235 39 366 23 210 16 156 12.2 7.2 5.0 1999 3 230 36 502 24 087 12 415 11.3 7.5 3.8 2000 3 221 34 276 24 025 10 251 10.6 7.5 3.2 2001 3 214 32 065 24 003 8 062 10.0 7.5 2.5 2002 3 212 32 229 25 554 6 675 10.0 8.0 2.1 2003 3 211 35 793 26 014 9 779 11.1 8.1 3.0 2004 3 214 37 520 25 679 11 841 11.7 8.0 3.7 2005 3 218 37 499 26 379 11 120 11.7 8.2 3.5 2006 3 221 37 639 27 202 10 437 11.7 8.4 3.2 2007 3 226 40 105 26 830 13 275 12.4 8.3 4.1 2008 3 234 41 185 27 412 13 773 12.7 8.5 4.3 2009 3 244 44 466 27 528 16 938 13.7 8.5 5.2 2010 1 the numbers of life births and deaths until 1959 were calculated from the birth rate and death rate, respectively
2 the high number of deaths in 1988 is related to the Spitak earthquake
Ethnic groups
Main article: Censuses of ArmeniaPopulation of Armenia according to ethnic group 1926–2001 Ethnic
groupcensus 19261 census 19392 census 19593 census 19704 census 19795 census 19896 census 2001 Number % Number % Number % Number % Number % Number % Number % Armenians 743,571 84.8 1,061,997 82.8 1,551,610 88.0 2,208,327 88.6 2,724,975 89.7 3,083,616 93.3 3,145,354 97.9 Yazidis 12,237 1.4 20,481 1.6 25,627 1.5 37,486 1.5 50,822 1.7 56,127 1.7 40,620 1.3 Kurds 3,025 0.3 1,519 0.0 Russians 19,548 2.2 51,464 4.0 56,464 3.2 66,108 2.7 70,336 2.3 51,555 1.6 14,660 0.5 Assyrians 2,215 0.3 3,280 0.3 4,326 0.2 5,544 0.2 6,183 0.2 5,963 0.2 3,409 0.1 Ukrainians 2,286 0.3 5,496 0.4 5,593 0.3 8,390 0.3 8,900 0.3 8,341 0.3 1,633 0.1 Greeks 2,980 0.3 4,181 0.3 4,976 0.3 5,690 0.2 5,653 0.2 4,650 0.1 1,176 0.0 Jews 335 0.0 512 0.0 1,024 0.1 1,047 0.0 959 0.0 720 0.0 600 0.0 Azeris 76,870 8.7 130,896 10.2 107,748 6.1 148,189 5.9 160,841 5.3 84,860 2.6 Others 17,683 2.0 4,031 0.3 5,667 0.3 11,092 0.4 8,590 0.3 8,944 0.3 4,640 0.1 Total 881,290 1,282,338 1,763,048 2,491,873 3,037,259 3,304,776 3,213,011 1 Source: [2]. 2 Source: [3]. 3 Source: [4]. 4 Source: [5]. 5 Source: [6]. 6 Source: [7]. Languages
Armenian is the only official language. Russian is widely used, especially in education[6]. 94% of adult Armenians considers that it's important their children learn Russian.[7]
Armenia is an observant member of the La Francophonie due to a small percentage of people studying enough French.
The largest communities of the ethnic Armenian diaspora are fluent in English.
CIA World Factbook demographic statistics
- Data from CIA World Factbook, unless indicated otherwise.
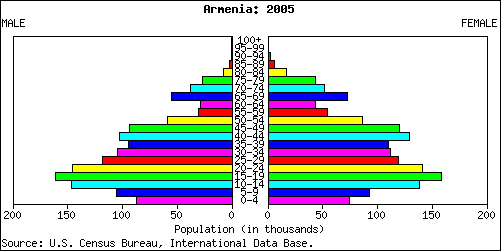
Age structure
- 0-14 years: 18.2% (male 289,119/female 252,150)
- 15-64 years: 71.1% (male 986,764/female 1,123,708)
- 65 years and over: 10.6% (male 122,996/female 192,267) (2009 est.)
Median age
- Total: 31.5 years
- Male: 28.8 years
- Female: 34.4 years (2009 est.)
Urbanization
- Urbanization population: 64% of population (2008)
- Rate of urbanization: -0.3% annual rate of change (2005-10 est.)
Sex ratio
- At birth: 1.15 male(s)/female
- Under 15 years: 1.14 male(s)/female
- 15-64 years: 0.88 male(s)/female
- 65 years and over: 0.65 male(s)/female
- Total population: 0.89 male(s)/female (2008 est.)
Infant mortality rate
- Total: 20.21 deaths/1,000 live births
- country comparison to the world: 106
- Male: 24.97 deaths/1,000 live births
- Female: 14.77 deaths/1,000 live births (2009 est.)
Life expectancy at birth
- Total population: 72.68 years
- country comparison to the world: 116
- Male: 69.06 years
- Female: 76.81 years (2009 est.)
Total fertility rate
- 1.36 children born/woman (2009 est.)
- country comparison to the world: 201
HIV/AIDS
- Adult prevalence rate: 0.1% (2007 est.)
- country comparison to the world: 114
- People living with HIV/AIDS: 2,400 (2007 est.)
- country comparison to the world: 135
- Deaths: less than 200 (2007 est.)
- country comparison to the world: 104
Nationality
- Noun: Armenian(s)
- Adjective: Armenian
Religions
Main article: Religion in Armenia- Armenian Apostolic 94.7%, other Christian 4% (mostly Armenian Catholic and Russian Orthodox), Yazidi (monotheist with elements of nature worship) 1.3%, and small Muslim and Jewish populations.
Literacy
- Definition: age 15 and over can read and write
- Total population: 99.4%
- Male: 99.7%
- Female: 99.2% (2001 census)
Education expenditures
- 3.2% of GDP (2001)
- country comparison to the world: 139
See also
- Censuses of Armenia
- Ethnic minorities in Armenia
- Assyrians in Armenia
- Greeks in Armenia
- Yazidis in Armenia
- Lom people
References
 This article incorporates public domain material from the CIA World Factbook document "2006 edition".
- ^ Garnik Asatryan and Victoria Arakelova, The Ethnic Minorities of Armenia, Routledge, part of the OSCE, 2002
- ^ Emigration Issues in Armenia
- ^ B.R. Mitchell. International historical statistics 1750-2005: Africa. Asia and Oceania
- ^ http://unstats.un.org/unsd/demographic/products/dyb/dyb2.htm#2001 United nations. Demographic Yearbooks
- ^ National Statistical Service of the Republic of Armenia
- ^ "Problems of Bilingualism in Armenia" (PDF). http://www.lingref.com/isb/4/092ISB4.PDF. Retrieved 2010-01-25. : "In 1999 the decision of the Government of Armenia that the Russian language would be used in the system of education and cultural and social life of the Republic of Armenia was approved and adopted. This decision contained the concept about a place and role of the Russian language in the system of education."
- ^ http://www.gallup.com/poll/109228/russian-language-enjoying-boost-postsoviet-states.aspx
External links
 Armenia topics
History (timeline) EarlyOrigins · Name · Kura-Araxes culture · Hayk · Hayasa-Azzi · Mitanni · Nairi · Kingdom of Urartu · Orontid dynasty · Kingdom of Armenia · Roman Armenia · Byzantine Armenia · Bagratuni Armenia · Armenian Kingdom of CiliciaMiddleModernBy topicGovernment and
politicsConstitution · President · Prime Minister · National Assembly · Political parties · Elections · Foreign relations · Corruption · Human rights · LGBT rights · Relations with the European Union · more on government / politicsEconomy Armenian dram · Central Bank · List of companies · Armex · Agriculture · Industry · Communications · Transport · Energy · Mining · Waste management · International rankingsAdministrative
divisionsArmed Forces Geography Demographics Religion Culture Symbols Demographics of Europe Sovereign
states- Albania
- Andorra
- Armenia
- Austria
- Azerbaijan
- Belarus
- Belgium
- Bosnia and Herzegovina
- Bulgaria
- Croatia
- Cyprus
- Czech Republic
- Denmark
- Estonia
- Finland
- France
- Georgia
- Germany
- Greece
- Hungary
- Iceland
- Ireland
- Italy
- Kazakhstan
- Latvia
- Liechtenstein
- Lithuania
- Luxembourg
- Macedonia
- Malta
- Moldova
- Monaco
- Montenegro
- Netherlands
- Norway
- Poland
- Portugal
- Romania
- Russia
- San Marino
- Serbia
- Slovakia
- Slovenia
- Spain
- Sweden
- Switzerland
- Turkey
- Ukraine
- United Kingdom
- (England
- Northern Ireland
- Scotland
- Wales)
- Vatican City
States with limited
recognition- Abkhazia
- Kosovo
- Nagorno-Karabakh
- Northern Cyprus
- South Ossetia
- Transnistria
Dependencies
and other territories- Åland
- Faroe Islands
- Gibraltar
- Guernsey
- Jan Mayen
- Jersey
- Isle of Man
- Svalbard
Other entities - European Union
Ethnic groups in Europe Sovereign
states- Albania
- Andorra
- Armenia
- Austria
- Azerbaijan
- Belarus
- Belgium
- Bosnia and Herzegovina
- Bulgaria
- Croatia
- Cyprus
- Czech Republic
- Denmark
- Estonia
- Finland
- France
- Georgia
- Germany
- Greece
- Hungary
- Iceland
- Ireland
- Italy
- Kazakhstan
- Latvia
- Liechtenstein
- Lithuania
- Luxembourg
- Macedonia
- Malta
- Moldova
- Monaco
- Montenegro
- Netherlands
- Norway
- Poland
- Portugal
- Romania
- Russia
- San Marino
- Serbia
- Slovakia
- Slovenia
- Spain
- Sweden
- Switzerland
- Turkey
- Ukraine
- United Kingdom
- (England
- Northern Ireland
- Scotland
- Wales)
States with limited
recognition- Abkhazia
- Kosovo
- Nagorno-Karabakh
- Northern Cyprus
- South Ossetia
- Transnistria
Dependencies
and other territories- Åland
- Faroe Islands
- Gibraltar
- Guernsey
- Jan Mayen
- Jersey
- Isle of Man
- Svalbard
Other entities Ethnic groups in Asia Sovereign
states- Afghanistan
- Armenia
- Azerbaijan
- Bahrain
- Bangladesh
- Bhutan
- Brunei
- Burma (Myanmar)
- Cambodia
- People's Republic of China
- Cyprus
- East Timor (Timor-Leste)
- Egypt
- Georgia
- India
- Indonesia
- Iran
- Iraq
- Israel
- Japan
- Jordan
- Kazakhstan
- North Korea
- South Korea
- Kuwait
- Kyrgyzstan
- Laos
- Lebanon
- Malaysia
- Maldives
- Mongolia
- Nepal
- Oman
- Pakistan
- Philippines
- Qatar
- Russia
- Saudi Arabia
- Singapore
- Sri Lanka
- Syria
- Tajikistan
- Thailand
- Turkey
- Turkmenistan
- United Arab Emirates
- Uzbekistan
- Vietnam
- Yemen
States with limited
recognition- Abkhazia
- Nagorno-Karabakh
- Northern Cyprus
- Palestine
- Republic of China (Taiwan)
- South Ossetia
Dependencies and
other territories- Christmas Island
- Cocos (Keeling) Islands
- Hong Kong
- Macau
Categories:- Armenian society
- Demographics of Armenia
Wikimedia Foundation. 2010.