- Demographics of Singapore
-
This article is about the demographic features of the population of Singapore, including population density, ethnicity, education level, health of the populace, economic status, religious affiliations and other aspects of the population.

Life in SingaporeCulture
Dance
Demographics
Driving
Economy
Education
Film
Holidays
Languages
Literature
Music
Politics
Religion
Singapore English
Sports
Transportedit box By end of June 2011, the island's population stood at 5.18 million with 3.8 million citizens and 1.4 million non-resident foreigners[1] and is the second most densely populated independent country in the world (behind Monaco).[2] Singapore is a multicultural country with a majority population of Chinese (74 percent), with substantial Malay (13 percent) and Indian minorities (9.2 percent).[1] The Malays are recognised as the indigenous community although most are the descendants of post-1945 immigrants from Indonesia and Malaysia.[3][4][5][6] Mahayana Buddhism is the first religion in Singapore though not representing a majority, with significant numbers following Islam, Christianity, Hinduism, Sikhism or no religion at all. The annual population growth rate for the year 2000 was 2.8%. The country has four official languages consisting of Mandarin, Malay, Tamil and English. English is the current main working language while Mandarin has been heavily promoted by the government and is now the second working language in the country.[7] According to latest 2010 statistics, Singapore’s resident total fertility rate (TFR) reached a level of 1.1 in 2010. The Chinese TFR was (1.08), followed by Indians (1.14) and Malays (1.82). Malay fertility-rate is ~70% higher than Chinese and Indians.[8] Singapore has attempted to boost the fertility rate for years to the replacement level of 2.1 birth per woman.[1]
Contents
Ethnic groups
Main article: Race in SingaporeSee also: Immigrant workers in SingaporeSingapore became numerically dominated by immigrant ethnic groups soon after Sir Stamford Raffles established a trading post on the island in 1819. It is estimated that in January 1819, Singapore had about 880 Malays and aboriginal tribes and about 20 to 30 Chinese. In 1821, it was estimated that there were nearly 3,000 Malays and more than 1,000 Chinese.
While the Singapore Department of Statistics reports overall population figures for Singapore (4.48 million in 2006), as a matter of policy, it only provides more detailed demographic breakdown analysis for the approximately 80% of the population who are Singapore citizens and Permanent Residents (collectively termed 'residents'). Of this group of about 3.6 million people, Chinese form 75.2%, Malays form 13.6%, Indians form 8.8%, while Eurasians and other groups form 2.4%.
Official figures show that the number of foreigners on short-term permits (termed 'non-residents') has grown from 30,900 in 1970 to 797,900 in 2005, which translate roughly to a 24-fold increase in 35 years, or from 1% of the population in 1970 to 18.3% in 2005. Despite this huge increase, no further breakdown is given by Singstat.
Some studies have attempted to cast light on the demographic profile of Singapore's non-resident population. According to 'The Encyclopedia of the Indian Diaspora' (published in 2006), "independent surveys approximate the number of South Asians on work permits to be between 30-35 per cent of the total 'Indian' population in Singapore, or approximately 90,000-100,000." Based on this, we can estimate that, as of June 2006, the Indian population formed 12.5% of the non-resident population, and therefore numbered between 415,000 and 430,000, or about 9.5% of the total population of about 4.5 million. It is likely the population of 'others' is similarly greater than suggested by the figures for the 'resident' population. Conversely, it is likely that the Chinese form significantly less than 75% of the total population of 4.5 million.
Following figures show that the ethnic composition of the resident population has been stable over the last 30 years, while non-resident population has boomed.
A recent figure released by the Straits Times on 20 July 2010 shows that the total population of Non Resident Singaporeans (PRs + foreigners) is around 1.79 million[9] of which Indians are 400,000 (22.35%). It is noteworthy that the number of Indian PRs and foreigners have doubled in the last 2 years![9] An increase of 200,000 in 2 years may portend a rapid shift in the demographic scenery of Singapore.
Ethnic composition (%) of resident population (chart) Ethnic 1970 1980 1990 2000 2010 Chinese 77.0 78.3 77.7 76.8 74.1 Malays 14.8 14.4 14.1 13.9 13.4 Indians 7.0 6.3 7.1 7.9 9.2 Others 1.2 1.0 1.1 1.4 3.3 Note: No breakdown by ethnicity is released for the non-resident population.
Part of non-residents in total population (chart) 1970 1980 1990 2000 2009 Non-residents (Residents = Citizens + PRs) 2.9% 5.5% 10.2% 18.7% 25.3% Source: Singapore Department of Statistics.[10]
Languages
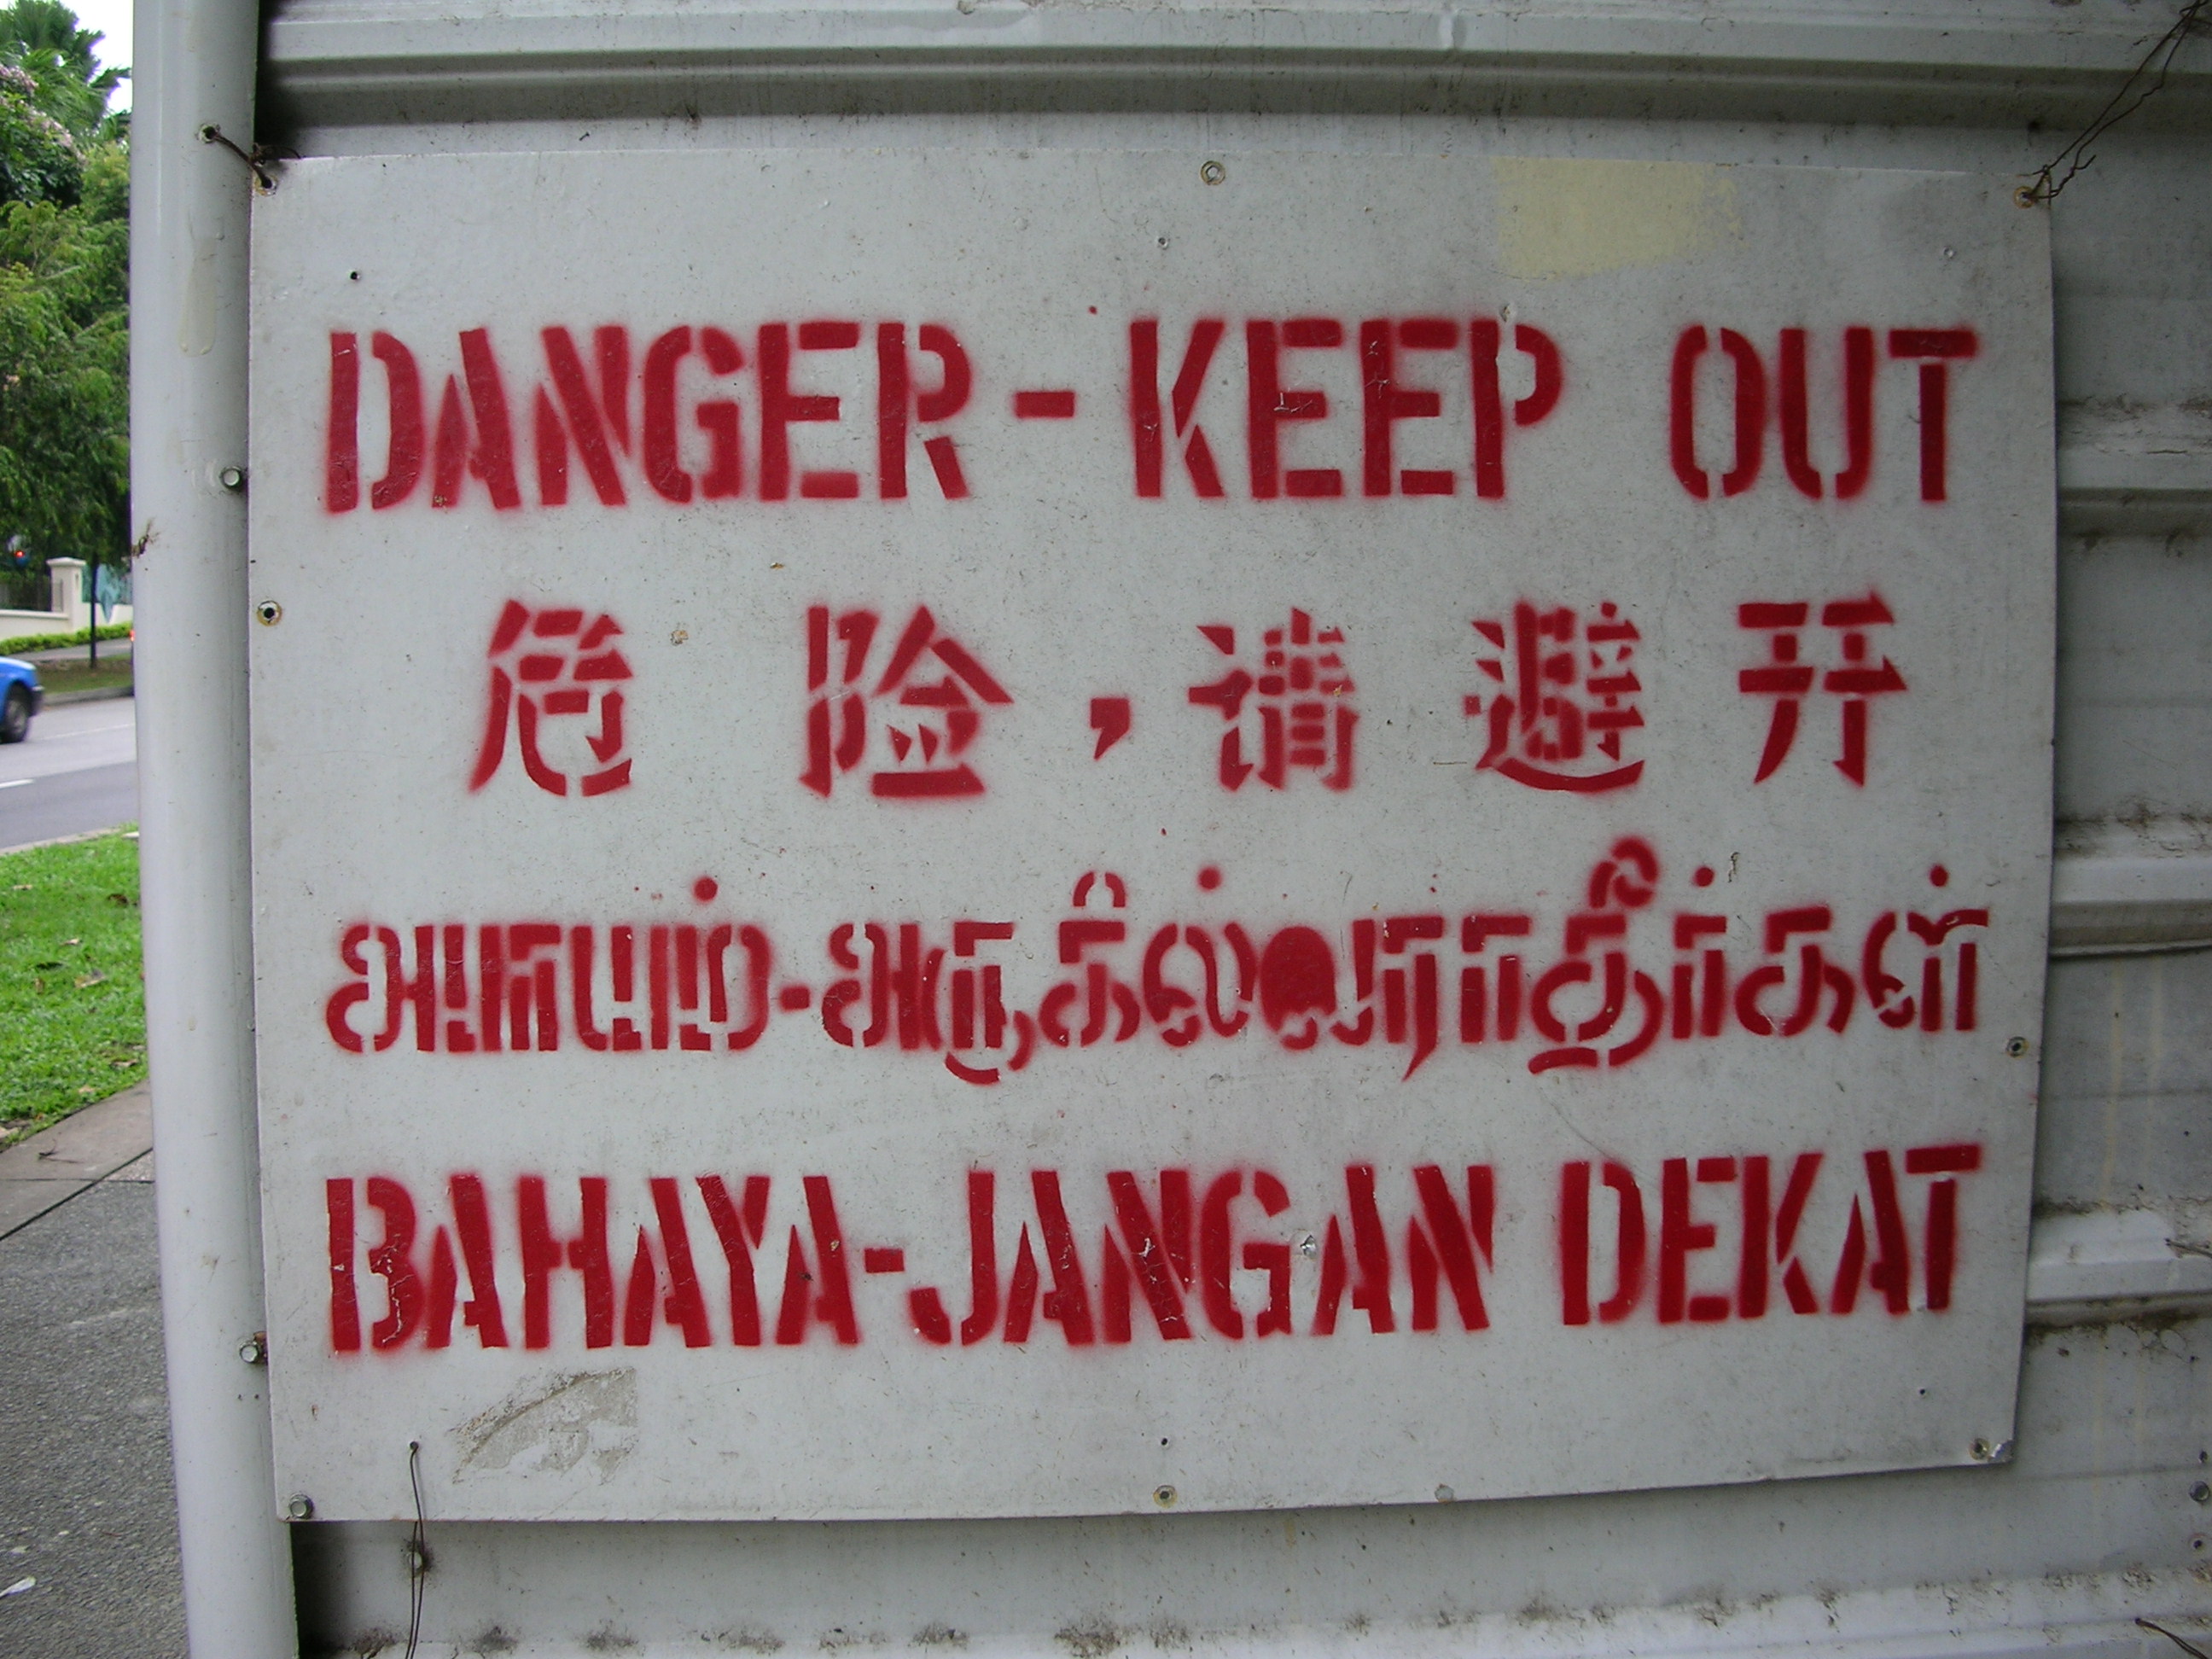
Main article: Languages in SingaporeThere are four official languages: English, Malay, Mandarin and Tamil.
Malay is the national language of the country, although English is mainly used. English serves as the link between the different ethnic groups and is the language of the educational system and the administration. The colloquial English used in everyday life is often referred to as Singlish.
The government of Singapore has been promoting the use of Mandarin, the official form of Chinese in Singapore as well as mainland China and Taiwan, with its Speak Mandarin Campaign among the Chinese population. The use of other Chinese dialects, like Hokkien, Teochew, Cantonese, Hainanese and Hakka, has been declining over the last two decades, although they are still being used especially by the older generations of the Chinese population.
About 60% of Singapore's Indian population speaks Tamil as their native language. Other Indian languages widely spoken are Malayalam and Hindi.
Around 5,000 Peranakans, the early Chinese population of the region, still use the Hokkien-influenced Malay dialect called Baba Malay.
Language most frequently spoken at home (%)[11] (chart) Language 1990 2000 2010 English 18.8 23.0 32.3 Mandarin 23.7 35.0 35.6 (non-Mandarin) Chinese Dialects 39.6 23.8 14.3 Malay 14.3 14.1 12.2 Tamil 2.9 3.2 3.3 Religion
Main article: Religion in SingaporeSingapore generally allows religious freedom, although some religious sects are restricted or banned, such as Jehovah's Witness, due to its opposition of National Service. The majority of Malays are Muslim, the plurality of Chinese practise Buddhism and syncretic Chinese folk traditions. Christianity is growing among the Chinese, having overtaken Taoism as second most important religion among this ethnic group. Indians are mostly Hindus though many others are Muslims, Sikhs, Buddhists and Christians. People who practice no religion form the third largest group in Singapore.
Resident population aged 15 years and over by religion (%)[11][12] (Generate a chart) Religion 1980 1990 2000 2010 Buddhism 27.0 31.2 42.5 33.3 Christianity 10.1 12.7 14.6 18.3 No religion 13.0 14.1 14.8 17.0 Islam 15.7 15.3 14.9 14.7 Taoism/Chinese traditional beliefs 30.0 22.4 8.5 10.9 Hinduism 3.6 3.7 4.0 5.1 Other religions 0.5 0.6 0.6 0.7
Religions of the main ethnic groups (2000):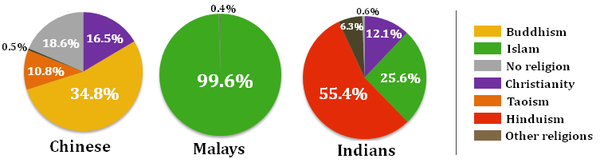
Source: Census 2000.[12]
Population
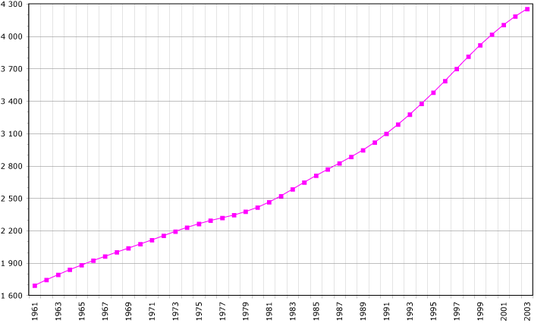 Demographics of Singapore, Data of FAO, year 2005 ; Number of inhabitants in thousands.
5,076,700 - 2010 est. Source: World Bank, World Development Indicators
Population growth and population control
See also: Eugenics in SingaporeAfter World War II, from 1947 to 1957, Singapore's version of the post–World War II baby boom occurred. [13] The birth rate rose and the death rate fell; the average annual growth rate was 4.4%, of which 1% was due to immigration; Singapore experienced its highest birth rate in 1957 at 42.7 per thousand individuals. (This was also the same year the United States saw its peak birth rate.) By 1960, the government publicly funded and supported family planning programmes; after independence in 1965, the birth rate had fallen to 29.5 per thousand individuals, and the natural growth rate had fallen to 2.5%. Singapore's population expansion can be seen in the graph below:
Per-period
population growth
1947—2000[13] (chart)Period Growth rate 1947—1957 84.7% 1957—1970 90.8% 1970—1980 13.3% 1980—1990 18.5% 1990— 2000 20.6% Birth rates in the 1960s were still perceived as high by the government; on average, a baby was born every 11 minutes in 1965. Kandang Kerbau Hospital (KKH) — which specialised in women's health and was the most popular hospital to have children — saw over 100 deliveries per day in 1962. In 1966, KKH delivered 39835 babies, earning it a place in the Guinness Book of World Records for "largest number of births in a single maternity facility" for ten years. Because there was generally a massive shortage of beds in that era, mothers with routine deliveries were discharged from hospitals within 24 hours. [14]
In September 1965 the Minister for Health, Yong Nyuk Lin, submitted a white paper to Parliament, recommending a "Five-year Mass Family Planning programme" that would reduce the birth rate to 20.0 per thousand individuals by 1970. In 1966, the Family Planning and Population Board (FPPB) had been established based on the findings of the white paper, providing clinical services and public education on family planning. [15] By 1970, the Stop at Two campaign was firmly established, implementing incentives, disincentives and public exhortation to discourage families from having more than two children. After 1975, the fertility rate declined below replacement level, in a sign that Singapore was undergoing the demographic transition. In 1983, the Graduate Mothers' Scheme was implemented in an attempt to get educated women, especially women with a university degree, to marry and procreate, while the government encouraged women without an O-level degree to get sterilised. This was done out of the government's belief (led by Lee Kuan Yew) that for the nation to best develop and avoid hardship, the educated classes should be encouraged to contribute to the nation's breeding pool, while the uneducated should not, sparking the Great Marriage Debate. [15] In 1986, the government reversed its population policy — except its stance on low-income, lowly-educated women — and initiated the Have Three or More (if you can afford it) campaign, offering cash and public administration incentives to have children. In 2001, the Singapore government started its Baby Bonus scheme.
Singapore's current fertility rate is 1.16 children born per woman (in 2010), which is one of the lowest in the world. Chinese had a ferlility of 1.07 in 2004 (1.65 in 1990), while Malays had a TFR of 2.10 (2.69 in 1990). Both figures declined further in 2006. TFR for Indians was 1.30 in 2004 and 1.89 in 1990. 1 2 While the Singapore government has launched several highly publicized attempts to raise the fertility rate and increase awareness of the negative effects of an aging population, the elderly (65+) still constitute only 8.3% of its population; this proportion is significantly lower than that of many other developed nations, such as the United States (12%) and Japan (21.2%).
Current population structure
Age structure Age percentage male female 0–14 years 15.6% 362,329 337,964 15–64 years 76.1% 1,666,709 1,750,736 65 years and over 8.3% 165,823 208,589 (2006 est.)
Population by residential status Residential Status Number Percentage Total Population 4,017,733 100.0% Citizens 2,973,091 74.0% Permanent Residents 290,118 7.2% Non-resident Population 754,524 18.8% (2000 est.)
Population growth rate 1.42% (2006) Birth rate 9.34 births/1,000 population Death rate 4.28 deaths/1,000 population Net migration rate 9.12 migrants/1,000 population (2006 est.)
Sex ratio Age males/female at birth 1.08 under 15 years 1.07 15–64 years 0.95 65 years and over 0.80 total population 0.96 (2006 est.)
Infant mortality rate
2.29 deaths/1,000 live births (2007 est.)
Life expectancy at birth
total population: 81 years
male: 79 years
female: 83 yearsMarriage and divorce
Marriages and divorces 2007 Number of marriages (excluding previously married) 23,996 Number of resident marriage (excluding previously married) 23,088 Number of divorces and annulments 7,226 Mean age of first marriage (years) …Grooms 29.8 …Brides 27.2 General marriage rate …Males (per 1,000 unmarried resident males) 43.8 …Females (per 1,000 unmarried resident females) 42.6 General divorce rate …Males (per 1,000 unmarried resident males) 8.1 …Females (per 1,000 unmarried resident females) 8.3 Crude marriage rate (per 1,000 resident population) 6.69 Crude rate of marital dissolution (per 1,000 resident population) 2.02 Source: Singapore Department of Statistics.[16]
The divorce rate has doubled over the last decade, and as of 2003, for every ten marriages registered in Singapore, almost three ended in divorce. The Women's Charter protects the women's financial interests during a divorce, often requiring the husband to contribute to his divorced wife and their children.
Literacy
Aged 15 years & above
Year 2000 1990 Total 92.5% 89.1% Male 96.6% 95.1% Female 88.6% 83.0% Source: Census 2000.
Education
Highest qualification attained Population Percent Total 2,277,401 100.0% No qualification 445,444 19.6% Primary 276,542 12.1% Lower secondary 248,598 10.9% Secondary 560,570 24.6% Upper secondary 226,275 9.9% Polytechnic 140,970 6.2% Other Diploma 112,371 4.9% University 266,631 11.7% Source: Census 2000.[17] Note: Based on resident non-students aged 15 years and over by highest qualification attained.
Employment
In 2005, the unemployment rate is 2.5%, the lowest in the last four years, with a labour force of 2.3 million people.[18][19]
Year Labour Force Unemployment
rateLabour force participation rate CPF contributors
in labour forceUnion members
among employedTotal Males Females Thousand Percent 1994 1,693.1 1.9 64.9 79.6 50.9 67.3 14.1 1999 1,976.0 3.6 64.7 77.8 52.7 62.0 15.4 2000 2,192.2 3.5 68.6 81.1 55.5 58.1 15.0 2001 2,119.7 2.7 65.4 77.8 54.3 59.9 16.5 2002 2,128.5 4.2 64.7 77.2 53.4 60.3 19.3 2003 2,150.1 4.4 64.2 75.8 53.9 59.7 20.5 2004 2,183.3 4.3 64.2 75.6 54.2 60.7 21.5 2005 2,317.4 2.5 ? ? ? ? ? Unemployment rates were seasonally adjusted. Source: Singapore Department of Statistics.[20]
Note: Based on persons aged 15 years and over.
Household income
Average household monthly income
The average household monthly income is SGD$4,943 in 2000, which is an increase from SGD$3,080 in 1990 at an average annual rate of 4.9%. The average household income experienced a drop of 2.7% in 1999 due to economic slowdown.
Household income from work Year Average income (SGD$) Median income (SGD$) 1990 3,076 2,296 1995 4,107 3,135 1997 4,745 3,617 1998 4,822 3,692 1999 4,691 3,500 2000 4,943 3,607 Source: Singapore Department of Statistics.[21]
Measured in 1990 dollars, the average household monthly income rose from SGD$3,080 in 1990 to SGD$4,170 in 2000 at an average annual rate of 2.8%.[21]
Households income from work by ethnic group of head Ethnic group Average household
income (SGD$)Median household
income (SGD$)1990 2000 1990 2000 Total 3,076 4,943 2,296 3,607 Chinese 3,213 5,219 2,400 3,848 Malays 2,246 3,148 1,880 2,708 Indians 2,859 4,556 2,174 3,387 Others 3,885 7,250 2,782 4,775 Source: Singapore Department of Statistics.[21]
Household income distribution
Resident households by income from work Monthly household
income (SGD$)Number ('000) Percent 1990 2000 1990 2000 Total 661.7 923.3 100.0 100.0 Below 1,000 105.7 116.3 16.0 12.6 1,000-1,999 179.3 128.9 27.1 14.0 2,000-2,999 133.3 136.1 20.1 14.7 3,000-3,999 86.1 121.3 13.0 13.1 4,000-4,999 54.0 95.2 8.2 10.3 5,000-5,999 33.5 75.4 5.1 8.2 6,000-6,999 21.7 57.5 3.3 6.2 7,000-7,999 13.8 42.2 2.1 4.6 8,000-8,999 9.5 32.4 1.4 3.5 9,000-9,999 6.5 23.4 1.0 2.5 10,000 & over 18.3 94.6 2.8 10.3 Source: Singapore Department of Statistics.[21]
Growth in household income by decile
With the recovery from the 1998 economic slowdown, household income growth had resumed for the majority of households in 2000. However, for the lowest two deciles, the average household income in 2000 had declined compared with 1999. This was mainly due to the increase in the proportion of households with no income earner from 75% in 1999 to 87% in 2000 for the lowest 10%. Households with no income earner include those with retired elderly persons as well as unemployed members. [1]
Average household income from work by decile
among all resident householdsDecile Average household income (SGD$) Annual Change (%) 1990 1997 1998 1999 2000 1998 1999 2000 Total 3,076 4,745 4,822 4,691 4,943 1.6 -2.7 5.4 Lowest 10% 370 327 258 133 61 -21.1 -48.4 -54.1 Lowest 10%, excluding households
with no income earner620 716 681 531 459 -4.9 -22.0 -13.6 Next 10% 934 1,352 1,332 1,172 1,145 -1.5 -12.0 -2.3 Next 10% 1,321 2,002 2,005 1,853 1,862 0.1 -7.6 0.5 Next 10% 1,686 2,613 2,647 2,470 2,535 1.3 -6.7 2.6 Next 10% 2,076 3,254 3,305 3,137 3,237 1.6 -5.1 3.2 Next 10% 2,541 4,019 4,097 3,900 4,036 1.9 -4.8 3.5 Next 10% 3,116 4,938 5,034 4,828 5,017 1.9 -4.1 3.9 Next 10% 3,897 6,093 6,271 6,023 6,316 2.9 -4.0 4.9 Next 10% 5,152 7,965 8,221 7,937 8,419 3.2 -3.5 6.1 Top 10% 9,671 14,890 15,053 15,451 16,804 1.1 2.6 8.8 Source: Singapore Department of Statistics.[21]
Household income disparity
The disparity in household income had widened in 2000, reflecting the faster income growth for the higher-income households. The Gini coefficient, a measure of income inequality, rose from 0.446 in 1998 to 0.481 in 2000. Other measures of income inequality also indicated similar trend of increasing disparity in household income.[21]
Measures of household income disparity Measure 1990 1995 1997 1998 1999 2000 Gini coefficient 0.436 0.443 0.444 0.446 0.467 0.481 —Excluding households with no income earner 0.410 0.409 0.412 0.410 0.424 0.432 Ratio of Average Income —Top 20% to Lowest 20% 11.4 13.8 13.6 14.6 17.9 20.9 —9th decile to 2nd decile 5.5 6.1 5.9 6.2 6.8 7.4 Source: Singapore Department of Statistics.[21]
In the United Nations Development Programme Report 2004, (page 50-53)],[22] Singapore's Gini coefficient based on income is 0.425 in 1998, which is ranked 78 among 127 countries in income equality (see list of countries by income equality).
International rankings
Main article: International rankings of SingaporeSee also
- Malay Singaporean
- Chinese Singaporean
- Indian Singaporean
- Arab Singaporean
- Eurasians in Singapore
- Eugenics in Singapore
References
- ^ a b c "September 28, 2011 - Singapore's Fertility Rate Dropped to a Record Low". http://www.thejakartaglobe.com/international/singapores-fertility-rate-dropped-to-a-record-low/468263.
- ^ Department of Economic and Social Affairs Population Division (2009) (.PDF). World Population Prospects, Table A.1. 2008 revision. United Nations. http://www.un.org/esa/population/publications/wpp2008/wpp2008_text_tables.pdf. Retrieved 2011-07-19.
- ^ http://www.unhcr.org/refworld/topic,463af2212,469f2f192,49749cb046,0.html
- ^ Vasil, R K (2000). Governing Singapore: democracy and national development. Allen & Unwin. p. 96. ISBN 1865082112, 9781865082110.
- ^ "Constitution of the Republic of Singapore". Attorney-General's Chambers of Singapore website. http://statutes.agc.gov.sg/non_version/cgi-bin/cgi_retrieve.pl?actno=REVED-CONST&doctitle=CONSTITUTION%20OF%20THE%20REPUBLIC%20OF%20SINGAPORE%0a&date=latest&method=part&sl=1. Retrieved August 11, 2011.
- ^ http://www.cidcm.umd.edu/mar/assessment.asp?groupId=83001#summary
- ^ http://www.asiaone.com/Business/SME%2BCentral/Talking%2Bpoint/Story/A1Story20090916-168233.html
- ^ Lee Kuan Yew (22 June 2010). "Singapore releases 2010 population in Brief Report". Govmonitor. http://www.thegovmonitor.com/world_news/asia/singapore-releases-2010-population-in-brief-report-34158.html. Retrieved 23 June 2010.
- ^ a b http://www.straitstimes.com/The+Print+Edition/The%2BPrint%2BEdition_20100720.html?vgnid=1
- ^ http://www.singstat.gov.sg
- ^ a b "Census of Population 2010 Statistical Release 1: Demographic Characteristics, Education, Language and Religion". Department of Statistics, Ministry of Trade & Industry, Republic of Singapore. January 2011. ISBN 978-981-08-7808-5. http://www.singstat.gov.sg/pubn/popn/C2010sr1/cop2010sr1.pdf. Retrieved 2011-08-28.
- ^ a b "Census 2000 - Chapter 5: Religion" (PDF). http://www.singstat.gov.sg/pubn/popn/c2000adr/chap5.pdf. Retrieved 2011-08-29.
- ^ a b Wong, Theresa; Brenda Yeoh (2003). "Fertility and the Family: An Overview of Pro-natalist Population Policies in Singapore". ASIAN METACENTRE RESEARCH PAPER SERIES (12). http://www.populationasia.org/Publications/RP/AMCRP12.pdf.
- ^ "Family Planning". National Archives. Government of Singapore. http://www.a2o.com.sg/a2o/public/html/etc/07_family.htm. Retrieved 12 August 2011.
- ^ a b "Singapore: Population Control Policies". Library of Congress Country Studies (1989). Library of Congress. http://www.photius.com/countries/singapore/society/singapore_society_population_control_p~11008.html. Retrieved 11 August 2011.
- ^ http://www.singstat.gov.sg/stats/themes/people/marriages.pdf
- ^ http://www.singstat.gov.sg/keystats/c2000/education.pdf
- ^ "Latest Data (1 Feb 2006) - Singapore Department of Statistics. URL accessed on 2 February 2006.
- ^ "Singapore's employment hits all-time high of 2.3 m in 2005". Channel NewsAsia. 2006-02-01. http://www.channelnewsasia.com/stories/singaporebusinessnews/view/191175/1/.html. By May Wong.
- ^ http://www.singstat.gov.sg/keystats/annual/yos/yos110.pdf
- ^ a b c d e f g http://mms.elibraryhub.com/SHC/Govt/MTI/SingStat/c2000adr-hhinc.pdf
- ^ http://hdr.undp.org/reports/global/2004/pdf/hdr04_HDI.pdf
- ^ Freedom in the World (report)
- ^ Freedom of the Press (report)
- ^ Press Freedom Index
- ^ Democracy Index
- ^ Corruption Perceptions Index
- ^ Privacy International
- ^ List of countries by GDP (nominal) per capita
- ^ List of countries by GDP (PPP) per capita
- ^ List of countries by foreign exchange reserves
- ^ List of countries by income equality
- ^ Ease of Doing Business Index
- ^ Global Enabling Trade Report
- ^ Global Competitiveness Report
- ^ Human Development Index
- ^ a b Quality-of-life index
- ^ List of countries and dependencies by population density
- ^ List of countries by immigrant population
- ^ List of countries by carbon dioxide emissions per capita
- ^ List of countries by number of troops
- ^ List of countries and territories by fertility rate
External links
Singapore topics History Timeline · Founding of modern Singapore · Straits Settlements · Battle of Singapore · Japanese occupation · Sook Ching massacre · 1962 referendum · PAP-UMNO relations
Politics and
governmentGeography Beaches · Chek Jawa · Conservation · Districts and places · Expressways · Wildlife (Fauna · Flora) · Islands · Lakes · Parks · Reservoirs · Rivers · Towns, estates and neighbourhoods · Waterways · Urban planning (Urban Redevelopment Authority)Economy Singapore dollar · Companies · Banks · Singapore Exchange · Monetary Authority · Central Provident Fund · Biopolis · Fusionopolis · Economic Development Board · JTC Corporation · International rankings · Financial servicesDemographics Culture Architecture · Cinema · Cuisine · Education · Languages · Literature · Music · Public holidays · Sports · SmokingTransport Symbols Related topics Ethnic groups in Asia Sovereign
states- Afghanistan
- Armenia
- Azerbaijan
- Bahrain
- Bangladesh
- Bhutan
- Brunei
- Burma (Myanmar)
- Cambodia
- People's Republic of China
- Cyprus
- East Timor (Timor-Leste)
- Egypt
- Georgia
- India
- Indonesia
- Iran
- Iraq
- Israel
- Japan
- Jordan
- Kazakhstan
- North Korea
- South Korea
- Kuwait
- Kyrgyzstan
- Laos
- Lebanon
- Malaysia
- Maldives
- Mongolia
- Nepal
- Oman
- Pakistan
- Philippines
- Qatar
- Russia
- Saudi Arabia
- Singapore
- Sri Lanka
- Syria
- Tajikistan
- Thailand
- Turkey
- Turkmenistan
- United Arab Emirates
- Uzbekistan
- Vietnam
- Yemen
States with limited
recognition- Abkhazia
- Nagorno-Karabakh
- Northern Cyprus
- Palestine
- Republic of China (Taiwan)
- South Ossetia
Dependencies and
other territories- Christmas Island
- Cocos (Keeling) Islands
- Hong Kong
- Macau
Ethnic and national groups in Singapore Major groups Minor groups Related topics Categories:- Demographics of Singapore
- Demographics by city


Wikimedia Foundation. 2010.