- List of countries by income equality
-
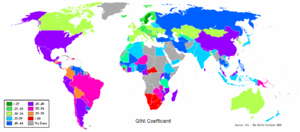 Differences in national income equality around the world as measured by the national Gini coefficient.
Contents
This is a list of countries or dependencies by income inequality metrics, including Gini coefficients, according to the United Nations (UN) and the US Central Intelligence Agency (CIA). Note that because the underlying household surveys differ in method and in the type of data collected, the distribution data are not strictly comparable across countries. The Gini coefficient is a number between 0 and 1, where 0 corresponds with perfect equality (where everyone has the same income) and 1 corresponds with perfect inequality (where one person has all the income — and everyone else has zero income). All Gini coefficients are before taxes which will tend to decrease the wealth of the upper income groups and decrease the value of the Gini coefficient. Income distribution can vary greatly from wealth distribution in a country. See: List of countries by distribution of wealth. Where information is unavailable it is marked N/A.
Income inequality can only be calculated accurately if all income data is included in the calculations.[1] Many financial transactions take place off the books in the so-called "shadow economy"; also called the cash economy, off-the-books economy, informal sector, black markets, System D., etc.. For 2002/2003 the estimated size of the "shadow", unrecorded, unregulated and untaxed, economies (in percent of official GDP) is an average of 43.2% in Africa, 43.4% in South and Central America, 40.1% in East and Central European countries, Russia and former Soviet Union countries, 30.8% in Asia (excluding Russia and Japan), and 16.3% in OECD countries (which varies from 28.2% in Greece to a low of about 8.4% in the United States, 9.4% in Switzerland, and 10.8% in Japan).[2][1]
List
- Note: The table is sortable in various ways. Click the sort button
 at the top of the column you wish to sort. Click again to reverse the order of sorting. Reload the page to reset everything to its original format.
Key:
R/P 10%: The ratio of the average income of the richest 10% to the poorest 10%
R/P 20%: The ratio of average income of the richest 20% to the poorest 20%
Gini: Gini index, a quantified representation of a nation's Lorenz curveUN: Data from the United Nations Development Programme.
CIA: Data from the Central Intelligence Agency's The World Factbook.
GPI: Data from the Global Peace Index.Country UN R/P 10%[3] UN R/P 20%[4] UN Gini as a percentage[5] CIA R/P 10%[6] Year CIA Gini as a percentage[7] Year GPI Gini as a percentage[8]  Afghanistan
60.0  Albania
7.2 4.8 31.1 7.2 2004 26.7 2005 -  Algeria
9.6 6.1 35.3 9.6 1995 35.3 1995 -  Angola
62.0  Argentina
31.6 17.8 48.8 35.0 2007 Jan.-Mar. 41.4 2010 (3rd quarter) -  Armenia
8.0 5.0 33.8 25.8 2004 37.0 2006 -  Australia
12.5 7.0 35.2 12.7 1994 30.5 2006 -  Austria
6.9 4.4 29.1 6.8 2004 26.0 2007 -  Azerbaijan
9.7 6.0 36.5 9.5 2001 36.5 2001 -  Bahrain
36.0  Bangladesh
7.5 4.9 33.4 7.5 2000 est. 33.2 2005 -  Belarus
6.9 4.5 29.7 6.9 2002 27.9 2005 -  Belgium
8.2 4.9 33.0 8.3 2000 28.0 2005 -  Belize
49.2  Benin
Benin9.4 6.0 36.5 9.4 2003 36.5 2003 -  Bhutan
32  Bolivia
93.9 42.3 57.2 157.3 2002 59.2 2006 -  Bosnia and Herzegovina
5.4 3.8 26.2 5.5 2001 56.2 2007 - UN R/P 10% UN R/P 20% UN Gini as a percentage CIA R/P 10% Year CIA Gini as a percentage Year GPI Gini 2008 as a percentage  Botswana
43.0 20.4 60.5 63 1993 -  Brazil
40.6 21.8 55.0 49.8 2004 56.7 2005 -  Bulgaria
7.0 4.4 29.2 8.8 2005 29.8 2008 -  Burkina Faso
11.6 6.9 39.5 11.5 2003 39.5 2007 -  Burundi
19.3 9.5 42.4 19.3 1998 42.4 1998 -  Cambodia
12.2 7.3 41.7 12.0 2004 43 2007 est. -  Cameroon
15.7 9.1 44.6 15.4 2001 44.6 2001 -  Canada
9.4 5.5 32.6 9.5 2000 32.1 2005 -  Central African Republic
69.2 32.7 61.3 68.1 1993 61.3 1993 -  Chad
Chad52.3  Chile
Chile26.2 15.7 52.0 32.1 2003 54.9 2003 -  China (PRC)
21.6 12.2 46.9 21.8 2004 41.5 2007 46.9[9]  Colombia
60.4 25.3 58.5 56.3 2008 58.5 2008 -  Democratic Republic of the Congo
55  Congo
Congo56.2  Costa Rica
23.4 15.6 48.9 37.4 2003 48.0 2008 -  Côte d'Ivoire
16.6 9.7 44.6 17.0 2002 44.6 2002 -  Croatia
7.3 4.8 29.0 7.2 2003 est. 29 2008 - UN R/P 10% UN R/P 20% UN Gini as a percentage CIA R/P 10% Year CIA Gini as a percentage Year GPI Gini 2008 as a percentage  Cuba
Cuba30.0  Cyprus
29 2005 -  Czech Republic
5.2 3.5 25.4 5.2 1996 26.0 2005 -  Denmark
8.1 4.3 24.7 12.0 2000 est. 29 2007 -  Dominican Republic
25.3 14.3 50.0 29.4 2005 49.9 2005[10] -  Ecuador
35.2 17.3 54.4 17.5 2006 Oct. [11] 47.9 2009 -  Egypt
Egypt8.0 5.1 34.4 8.0 2000 34.4 2001 -  El Salvador
38.6 20.9 46.9 55.4 2002 52.4 2002 -  Equatorial Guinea
65  Estonia
10.8 6.4 35.8 11.0 2003 34.0 2008 -  Ethiopia
6.6 4.3 30 6.5 2000 30 2000 -  Finland
5.6 3.8 26.9 5.7 2000 26.8 2008 -  France
9.1 5.6 32.7 8.3 2004 32.7 2008 -  Gabon
Gabon60  The Gambia
20.2 11.2 50.2 20.6 1998 50.2 1998 -  Georgia
15.4 8.3 40.4 15.2 2003 40.8 2009 -  Germany
6.9 4.3 28.3 6.9 2000 27.0 2006 -  Ghana
Ghana14.1 8.4 40.8 13.7 1999 39.4 2006 - UN R/P 10% UN R/P 20% UN Gini as a percentage CIA R/P 10% Year CIA Gini as a percentage Year GPI Gini 2008 as a percentage  Greece
10.2 6.2 34.3 10.4 2000 est. 33.0 2005 -  Guatemala
33.9 20.3 53.7 48.2 2002 55.1 2007 -  Guinea
10.5 6.6 38.6 21.6 2006 38.1 2006 -  Guinea-Bissau
19.0 10.3 47 84.8 1991 -  Guyana
26.0 1999 43.2 1999 -  Haiti
Haiti54.4 26.6 59.5 68.1 2001 59.2 2001 -  Honduras
59.4 17.2 55.3 35.2 2003 53.8 2003 -  Hong Kong
17.8 9.7 43.4 53.3 2007 -  Hungary
5.5 3.8 26.9 5.6 2002 28.0 2005 -  Iceland
28 2006 -  India
India8.6 5.6 36.8 8.6 2004 36.8 2004 -  Indonesia
7.8 5.2 34.3 7.9 2002 39.4 2005 -  Iraq
Iraq42  Iran
Iran17.2 9.7 43 16.9 1998 44.5 2006 38.3[12]  Ireland
9.4 5.6 34.3 9.4 2000 30.7 2008 -  Israel
13.4 7.9 39.2 11.8 2005 39.2 2008 -  Italy
Italy11.6 6.5 36 11.7 2000 32 2006 -  Jamaica
17.3 9.8 45.5 17.0 2004 45.5 2004 - UN R/P 10% UN R/P 20% UN Gini as a percentage CIA R/P 10% Year CIA Gini as a percentage Year GPI Gini 2008 as a percentage  Japan
Japan4.5 3.4 24.9 4.5 1993 37.6 2008 -  Jordan
11.3 6.9 38.8 11.3 2003 39.7 2007 -  Kazakhstan
8.5 5.6 33.9 8.0 2004 est. 28.8 2008 -  Kenya
Kenya13.6 8.2 42.5 18.6 2000 42.5 2008 -  North Korea
31.0  South Korea
7.8 4.7 31.6 8.6 2005 est. 31.4 2009 -  Kuwait
30  Kyrgyzstan
6.4 4.4 30.3 6.4 2003 30.3 2003 -  Laos
Laos8.3 5.4 34.6 8.4 2002 34.6 2002 -  Latvia
11.6 6.8 37.7 11.6 2003 36.0 2005 -  Lebanon
45  Lesotho
10.5 44.2 63.2 48.2 2002 est. 63.2 1995 -  Liberia
12.8 52.6 -  Libya
Libya36.0  Lithuania
10.4 6.3 36 10.3 2003 36.0 2005 -  Luxembourg
6.8 2000 26 2005 -  Macedonia
12.5 7.5 39 12.3 2003 39 2003 -  Madagascar
19.2 11.0 47.5 19.3 2001 47.5 2001 - UN R/P 10% UN R/P 20% UN Gini as a percentage CIA R/P 10% Year CIA Gini as a percentage Year GPI Gini 2008 as a percentage  Malawi
10.9 6.7 39 11.0 2004 39.0 2004 -  Malaysia
22.1 12.4 49.2 28.0 2003 est. 46.1 2002 -  Mali
Mali12.5 7.6 40.1 12.6 2001 40.1 2001 -  Malta
Malta26 2007 -  Mauritania
12.0 7.4 39 11.8 2000 39 2000 -  Mauritius
39 2006 est. -  Mexico
21.6 12.8 51.6 24.6 2004 48.2 2008 -  Moldova
8.2 5.3 33.2 8.3 2003 33.2 2003 -  Mongolia
8.2 5.4 32.8 8.2 2002 32.8 2002 -  Montenegro
30 2003 -  Morocco
11.7 7.2 39.5 11.9 1999 40.9 2005 est. -  Mozambique
18.8 9.9 47.3 18.8 2002 47.3 2002 -  Myanmar
11.6 1998 40  Namibia
12.8 56.1 74.3 129.0 2003 70.7 2003 -  Nepal
Nepal15.8 9.1 47.2 15.6 2004 47.2 2008 -  Netherlands
9.2 5.1 30.9 9.2 1999 30.9 2007 -  New Zealand
12.5 6.8 36.2 36.2 1997 -  Nicaragua
31.0 8.8 52.3 15.4 2001 43.1 2001 - UN R/P 10% UN R/P 20% UN Gini as a percentage CIA R/P 10% Year CIA Gini as a percentage Year GPI Gini 2008 as a percentage  Niger
Niger46.0 20.7 50.5 44.3 1995 50.5 1995 -  Nigeria
17.8 9.7 43.7 17.5 2003 43.7 2003 -  Norway
6.1 3.9 25.8 6.0 2000 25.0 2008 -  Oman
Oman32  Pakistan
6.5 4.3 30.6 6.6 2002 30.6 2008 -  Panama
49.9 23.9 54.9 61.4 2003 56.1 2003 -  Papua New Guinea
23.8 12.6 50.9 23.8 1996 50.9 1996 -  Paraguay
38.8 25.7 53.2 65.9 2003 53.2 2009 -  Peru
Peru26.1 15.2 50.5 31.5 2003 52 2008 -  Philippines
15.5 9.3 44.5 15.5 2003 45.8 2006 -  Poland
8.8 5.6 34.5 8.7 2002 34.9 2005 -  Portugal
15.0 8.0 38.5 9.2 1995 est. 38.5 2007 -  Qatar
Qatar39  Romania
7.5 4.9 31.0 7.4 2003 32.0 2008 -  Russia
12.7 7.6 39.9 12.8 2002 42.3 2008 -  Rwanda
18.6 9.9 46.8 18.2 2000 46.8 2000 -  Saudi Arabia
32.0  Senegal
12.3 7.4 41.3 12.4 2001 41.3 2001 - UN R/P 10% UN R/P 20% UN Gini as a percentage CIA R/P 10% Year CIA Gini as a percentage Year GPI Gini 2008 as a percentage  Serbia
26 2008 -  Sierra Leone
87.2 57.6 62.9 87.2 1989 62.9 1989 -  Singapore
17.7 9.7 42.5 17.3 1998 48.1 2008 -  Slovakia
6.7 4.0 25.8 6.7 1996 26 2005 -  Slovenia
5.9 3.9 28.4 5.9 1998 28.4 2008 -  Somalia
30  South Africa
33.1 17.9 57.8 31.9 2000 65.0 2005 -  Spain
Spain10.3 6.0 34.7 10.2 2000 32.0 2005 -  Sri Lanka
11.1 6.9 40.2 36.1 2003/04 fiscal year 49 2007 -  Sudan
Sudan51  Swaziland
25.1 13.0 50.4 25.4 2001 50.4 2001 -  Sweden
6.2 4.0 25.0 6.2 2000 23.0 2005 -  Switzerland
9.0 5.5 33.7 8.9 2000 33.7 2008 -  Syria
Syria42.0  Taiwan (ROC)
6.1 2002 est. 33 2000[13] -  Tajikistan
7.8 5.2 32.6 7.8 2003 32.8 2006 -  Tanzania
9.2 5.8 34.6 9.3 2000 34.6 2000 -  Thailand
12.6 7.7 42 12.4 2002 43 2006 - UN R/P 10% UN R/P 20% UN Gini as a percentage CIA R/P 10% Year CIA Gini as a percentage Year GPI Gini 2008 as a percentage  Timor-Leste
38 2002 est. -  Trinidad and Tobago
12.9 7.6 38.9 -  Tunisia
13.4 7.9 39.8 13.7 2000 40 2005 est. -  Turkey
6.6 4.6 41.2 17.1 2003 41 2007 -  Turkmenistan
12.3 7.7 40.8 12.2 1998 40.8 1998 -  Uganda
16.6 9.2 45.7 16.4 2002 45.7 2002 -  Ukraine
5.9 4.1 28.1 7.6 2006 31.0 2006 -  United Arab Emirates
31  United Kingdom
13.8 7.2 36.0 13.6 1999 34.0 2005 -  United States
15.9 8.4 40.8 15.0 2007 est. 45.0 2007 -  Uruguay
20.1 10.2 47.1 17.9 2003 45.2 2006 -  Uzbekistan
10.6 6.2 36.8 10.6 2003 36.8 2003 -  Venezuela
18.8 16.0 49.5 50.3 2003 41.0 2009 -  Vietnam
6.9 4.9 34.4 10.0 2004 37.0 2004 -  Yemen
Yemen8.6 5.6 33.4 8.6 2003 37.7 2005 - World 12.0 2002 est. - See also
- List of countries by distribution of wealth
- Income inequality metrics
References
- ^ a b Underground economy and income inequality: two connected aspects in the oncoming context of Italian federalism. By Iacopo Odoardi and Carmen Pagliari. Vol. 15 No. 1, 2011. Global & Local Economic Review.
- ^ The Size of the Shadow Economies of 145 Countries all over the World: First Results over the Period 1999 to 2003. December 2004. By Friedrich Schneider (University of Linz and IZA Bonn). Institute for the Study of Labor.
- ^ Data show the ratio of the income or expenditure share of the richest group to that of the poorest. Human Development Report 2009, UNDP, accessed on July 30, 2011.
- ^ Data show the ratio of the income or expenditure share of the richest group to that of the poorest. Human Development Report 20087-2008, UNDP, accessed on February 3, 2008.
- ^ Human Development Report 2010, United Nations Development Programme. Table 3 has the Gini coefficients by country. The year is not given for the Gini coefficient.
- ^ Data show the ratio of the household income or consumption share of the richest group to that of the poorest. Household income or consumption by percentage share (%), The World Factbook, CIA, updated on January 24, 2008. Note: To calculate the value given in the table for this article, the highest 10% value was divided by the lowest 10% value.
- ^ Distribution of family income - Gini index, The World Factbook, CIA, updated on January 24, 2008.
- ^ Global Peace Index calculation incorporates UN Gini scores where available, so countries with a UN Gini calculation are left blank in this column. At [1] click on each country to see its Gini coefficient. Year is not given. "There are, nevertheless, some problems with the Gini-coefficient; there is a considerable lag in the publication of statistics for many countries suffers, forcing the Economist Intelligence Unit to estimate the coefficient for a sizeable proportion of the 153 countries in the GPI. These problems of measurement look likely to persist for the foreseeable future, and the use of other measures of income inequality may be more effective."
- ^ Stephen Young (2010) Geni Coefficient Nation Multimedia
- ^ Data are for urban households.
- ^ Data for urban households only.
- ^ http://hdr.undp.org/en/media/HDR_2009_EN_Complete.pdf
- ^ "CIA - The World Factbook 2002 - Field Listing - Distribution of family income - Gini index". Faqs.org. http://www.faqs.org/docs/factbook/fields/2172.html. Retrieved 2011-08-03.
External links
- Global Peace Index Map of Gini data for 2007-2010
- The World Distribution of Household Wealth
- A map of world poverty
- It's the Inequality, Stupid. March/April 2011 Issue. Mother Jones (magazine). Many charts, with sources.
- Who Rules America: Wealth, Income, and Power. July 2011. By G. William Domhoff. Many charts, and sources. See table 4 for wealth distribution by country. See table 7 for income distribution by country.
- Alan Grayson says United States has fifth-most unequal wealth distribution in world. 10 October 2011. PolitiFact. Discusses income distribution too.
- CHARTS: Here's What The Wall Street Protesters Are So Angry About.... 11 October 2011. Business Insider.
- Shadow economies all over the world : new estimates for 162 countries from 1999 to 2007. Friedrich Schneider, Andreas Buehn, Claudio E. Montenegro. July 2010. World Bank.
Lists of countries by population statistics Demographics Population (density · graphical · growth rate · per household · past and future · per unit area of arable land · urban) · Age at first marriage · Birth rate · Natural increase · Death rate · Divorce rate · Fertility rate · Foreign-born (2005) · Life expectancy · Median age · Net migration · Sex ratio · UrbanizationHealth Antiviral medications for pandemic influenza · Health expenditure per capita · HIV/AIDS adult prevalence rate · Infant mortality rate · Percentage suffering from undernourishment · Suicide rate (OECD)Education and innovation Education Index · Global Innovation Index · Literacy rate · Patents · Programme for International Student AssessmentEconomic Development aid · Distribution of wealth · Employment rate · Global Gender Gap Report · Human Poverty Index · Income equality · Labour force · Millionaires · Per capita personal income · Percentage living in poverty · Sen social welfare function · Unemployment rate · US dollar billionairesOther Categories:- Economics lists by country
- Income distribution
- Note: The table is sortable in various ways. Click the sort button

Wikimedia Foundation. 2010.