- Demographics of Burma
-
The following is an overview of the demographics of Burma (or Myanmar), including statistics such as population, ethnicity, language, education level and religious affiliation.
Contents
Population
At the time of the last official census in Burma, 31 March 1983, the population was 35,442,972. As of July 2003[update], this was estimated by the CIA World Factbook to have increased to 47,758,180; however, many other estimates put this much higher, at around 50-60 million. Britain-based human rights agencies place the population as high as 70 million. Estimates for the country explicitly take into account the effects of excess mortality due to AIDS; this can result in lower life expectancy, higher infant mortality and death rates, lower population and growth rates, and changes in the distribution of population by age and sex than would otherwise be expected.
China's People Daily reported that a Myanmar had a census in 2007, and at the end of 2009 has 59.2 million people, and growing at 2% annually,[1] with exception for Cyclone Nargis in 2008.
No trustworthy census has occurred since the 1930s. In the 1940s, the detailed census results were destroyed during the Japanese invasion of 1942. Census results after that time have been flawed by civil wars and a series of military governments. The last official census in 1983 occurred at a time when parts of the country were controlled by insurgent groups and inaccessible to the government.
The 2006 Household Income and Expenditure Survey found that the average household size was 4.72 (urban 4.87, rural 4.67), and that the average per capita household expenditure was K 20,581.71 (urban K 23269.10, rural K. 19407.25)[2]
Vital statistics
Burma has a low fertility rate (2.07 in 2010), slightly above replacement level, especially as compared to other Southeast Asian countries of similar economic standing, like Cambodia (3.18) and Laos (4.41), representing a significant decline from 4.7 in 1983 to 2.4 in 2001, despite the absence of any national population policy.[3][4] The fertility rate is much pronouncedly lower in urban areas. This is attributed to extreme delays in marriage (almost unparalleled in the region, with the exception of developed countries), the prevalence of illegal abortions, and the high proportion of single, unmarried women of reproductive age (with 25.9% of women aged 30–34 and 33.1% of men and women aged 25–34 single). This stems from several cultural and economic issues. The first is economic hardship, which results in the delay of marriage and family-building (the average age of marriage in Burma is 27.5 for men, 26.4 for women).[4][5] The second is the social acceptability of celibacy among the Burmese, who are predominantly Buddhist and value celibacy as a means of spiritual development.[3][6]
Births and deaths [7]
Period Live births per year Deaths per year Natural change per year CBR* CDR* NC* TFR* IMR* 1950-1955 856 000 515 000 341 000 47.5 28.6 18.9 6.00 212.8 1955-1960 885 000 466 000 419 000 44.4 23.4 21.0 6.00 175.2 1960-1965 928 000 454 000 475 000 41.9 20.5 21.4 6.10 155.7 1965-1970 993 000 426 000 567 000 40.1 17.2 22.9 6.10 131.1 1970-1975 1 092 000 418 000 674 000 39.2 15.0 24.2 5.90 112.7 1975-1980 1 068 000 402 000 666 000 34.2 12.9 21.4 4.90 97.5 1980-1985 1 085 000 421 000 664 000 31.5 12.2 19.2 4.30 93.0 1985-1990 1 100 000 445 000 656 000 29.2 11.8 17.4 3.80 89.7 1990-1995 1 017 000 418 000 598 000 25.0 10.3 14.7 3.10 76.1 1995-2000 969 000 405 000 564 000 22.3 9.3 13.0 2.65 65.4 2000-2005 881 000 408 000 473 000 19.3 8.9 10.4 2.25 59.8 2005-2010 846 000 417 000 428 000 17.9 8.9 9.1 2.08 55.0 - CBR = crude birth rate (per 1000); CDR = crude death rate (per 1000); NC = natural change (per 1000); IMR = infant mortality rate per 1000 births; TFR = total fertility rate (number of children per woman)
Ethnic groups
Main article: Ethnic groups of BurmaThe Burmese government identifies eight major national ethnic races (which comprise 135 "distinct" ethnic groups), which include the Bamar (68%), Shan (9%), Kayin (7%), Rakhine (4%), Mon (2%), Kayah, and Kachin. However, the government classification system is flawed, because it groups ethnic groups under ethnic races by geography, rather than by linguistic or genetic similarity (e.g. the Kokang are under the Shan ethnic race, although they are ethnic Chinese). Unrecognised ethnic groups include Burmese Indians and Burmese Chinese, who form 2% and 3% of the population respectively. The remaining 5% of the population belong to small ethnic groups such as the remnants of the Anglo-Burmese and Anglo-Indian communities, as well as the Lisu, Rawang, Naga, Padaung, Moken, and many minorities across Shan State.
Language
Main article: Languages of BurmaThe official language and primary medium of instruction of Burma is Burmese (65%). However, a diversity of languages is spoken in Burma, and includes Shan (6.4%), Karen (5.2%), Kachin (1.8%), Chin (1.6%), Mon (1.5%), and Rakhine (1.5%). English is also spoken, particularly by the educated urban elite, and is the secondary language learnt in government schools.
Religious affiliation
Religion in Burma Faith %
(2008 est.)Total Buddhism 89% Theravada Buddhism 89% Mahayana Buddhism <1% Total Christianity 4% Baptist 3% Roman Catholicism 1% Total Islam 4% Sunni Islam 2.65% Shi'a Islam 1.35% Total other religions <1% Animism 1% Other (inc. Hinduism) 2% See also: Buddhism in Burma, Myanmar Baptist Convention
CIA World Factbook demographic statistics
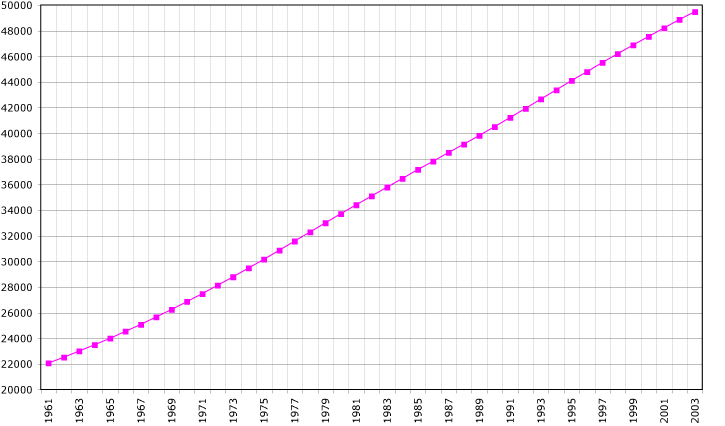
 Demographics of Burma, Data of FAO, year 2009 ; Number of inhabitants in thousands.
The following demographic statistics are from the CIA World Factbook, unless otherwise indicated.
Age structure
(2003 est.)
- 0–14 years: 28.1% (male 6,091,220; female 5,840,968)
- 15–64 years: 67% (male 14,162,190; female 14,347,751)
- 65 years and over: 4.9% (male 916,702; female 1,151,706)
Median age
- total: 28.2 years years (2009 est.)
Population growth rate
0.783% (2009 est.)
Urbanization
- urban population: 33% of total population (2008)
- rate of urbanization: 2.9% of annual rate of change (2005-10 est.)
Human sex ratios
- at birth: 1.06 males/female
- under 15 years: 1.03 males/female
- 15–64 years: 0.98 male/female
- 65 years and over: 0.75 male/female
- total population: 0.98 male/female (2009 est.)
Life expectancy
- total population: 63.39 years
- male: 61.17 years
- female: 65.74 years
Literacy
(age 15 and over can read and write, official statistics)
- total population: 89.9%
- male: 93.9%
- female: 86.4% (2008 est.)
Education expenditures
1.2% of total GDP (2001)
Notes
- ^ "Myanmar population hits over 59 mln in 2009". People's Daily (Xinhua). 1 July 2010. http://english.peopledaily.com.cn/90001/90777/90851/7049436.html. Retrieved 17 July 2011.
- ^ "Household Income and Expenditure Survey". Central Statistical Organization. Ministry of National Planning and Economic Development. http://www.csostat.gov.mm/survey.asp. Retrieved 17 July 2011.
- ^ a b Jones, Gavin W. (2007). "Delayed Marriage and Very Low Fertility in Pacific Asia". Population and Development Review (The Population Council, Inc.) 33 (33): 453–478. doi:10.1111/j.1728-4457.2007.00180.x. http://dahuang.dhxy.info/population/Delayed_Marriage_Fertility09.pdf.
- ^ a b Myat Mon (2008). "The Economic Position of Women in Burma". Asian Studies Review (Wiley) 24 (2): 243–255. doi:10.1111/1467-8403.00076.
- ^ http://www.un.org/esa/population/publications/worldmarriage/worldmarriagepatterns2000.pdf
- ^ Nyi Nyi (2005). "V: Conclusion and Recommendation". The Determinants of Age at First Marriage in Myanmar (Master's thesis). Mahidol University. http://mulinet10.li.mahidol.ac.th/e-thesis/4738657.pdf. Retrieved 2010-09-20.
- ^ World Population Prospects: The 2010 Revision
References
- Population Projections for Myanmar, 1983-2013 - Asia Pacific Population Journal, Vol. 6, No. 2 (PDF document)
 This article incorporates public domain material from websites or documents of the CIA World Factbook.
Government-classified ethnic groups in Burma (Myanmar) Kachin (12) Kayah (9) Kayah (Karenni) · Pale · Zayein · Ka-Yun (Kayan; Padaung) · Manu Manaw · Gheko · Yin Talai · Yin Baw · Kayinpyu (Geba Karen)Karen (11) Kayin (Karen) · Pa-Le-Chi · Mon Kayin (Sarpyu) · S'gaw · Ta-Hlay-Pwa · Paku · Bwe · Monpwa · Monnepwa · Shu (Pwo)Chin (53) Anu · Anun · Asho · Awa Khami · Bre (Ka-Yaw) · Chin · Dai (Yindu) · Dim · Eik-swair · Gunte (Lyente) · Guite · Haulngo · Ka-Lin-Kaw (Lushay) · Kaung Saing Chin · Kaungso · Kebar · Khawno · Kwangli (Sim) · Kwelshin · Kwe Myi · Lai (Haka Chin) · Laizao · Lawhtu · Laymyo · Lhinbu · Lushei (Lushay) · Lyente · Magun · Malin · Maramagyi · Matu · Meithei (Kathe) · Mgan · Mi-er · Naga · Ngorn · Oo-Pu · Panun · Rongtu · Saing Zan · Saline · Sentang · Tanghkul · Tapong · Tay-Zan · Thado · Tiddim (Hai-Dim) · Torr (Tawr) · Wakim (Mro) · Yin Gog · Za-How · Zahnyet (Zanniet) · Zizan · Zou · Zo-Pe · ZotungBamar (9) Mon (1) Rakhine (7) Shan (33) Shan · Danaw (Danau) · Danu · Intha · Pa-O · Khamti Shan · Khmu (Khamu) · Kwi · Kokang · Lahu · Palaung · Shan Gale · Shan Gyi · Tai-Loi · Tai-Lem · Tai-Lon · Tai-Lay · Taishon · Taungyo · Wa (Va) · Yao · Yin Kya · Yin Net · Yun (Lao) · Man Zi · Pyin · Eng · Son · Kaw (Akha-E-Kaw) · Maw Shan · Maingtha · Hkun (Khün)Unrecognized Burmese Chinese · Panthay · Burmese Indians · Anglo-Burmese · Rohingya · Gurkha
Categories:- Burmese society
- Demographics by country

Wikimedia Foundation. 2010.