- Demographics of Laos
-

This article is about the demographic features of the population of Laos, including population density, ethnicity, education level, health of the populace, economic status, religious affiliations and other aspects of the population.
Laos' population was estimated at about 6 million in July 2004, dispersed unevenly across the country. Most people live in valleys of the Mekong River and its tributaries. Vientiane Prefecture, which includes Vientiane, the capital and largest city of the country, had about 569,000 residents in 1999. The country's population density is 23.4/km².
In March 2005, the total population was 5.62 million (2.82 million females, 2.80 million males) in the 2005 census, an increase of 1 047 000 since the previous 1995 census. [1]
Contents
Overview
The demographic makeup of the population is uncertain as the government divides the people into three groups according to the altitude at which they live, rather than according to ethnic origin. The lowland Lao (Lao Loum) account for 68%, upland Lao (Lao Theung) for 22%, and the highland Lao (Lao Soung, including the Hmong and the Yao) for 9%. Ethnic Vietnamese constitutes about 2% of the population.
Ethnic Lao, the principal lowland inhabitants and politically and culturally dominant group, make up the bulk of the Lao Loum and around 60% of the total population. The Lao are a branch of the Tai people who began migrating southward from China in the first millennium A.D. In the north, there are mountain tribes of Miao–Yao, Austro-Asiatic, Tibeto-Burman - Hmong, Yao, Akha, and Lahu who migrated into the region in the 19th century. Collectively, they are known as Lao Sung or highland Lao. In the central and southern mountains, Mon–Khmer tribes known as Lao Theung or upland Lao, predominate. Some Vietnamese and Chinese minorities remain, particularly in the towns, but many left in two waves - after independence in the late 1940s and again after 1975.
The predominant religion is Theravada Buddhism. Animism is common among the mountain tribes. Buddhism and spirit worship coexist easily. There also is a small number of Christians and Muslims.
The official and dominant language is Lao, a tonal language of the Tai linguistic group. Midslope and highland Lao speak an assortment of tribal languages. French, once common in government and commerce, has declined in usage, while knowledge of English - the language of the Association of Southeast Asian Nations (ASEAN) - has increased in recent years.
With a median age of 19.3, Laos has the youngest population of Asia.
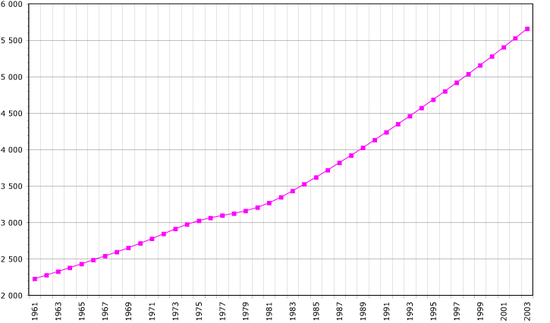 Demographics of Laos, Data of FAO, year 2005 ; Number of inhabitants in thousands.
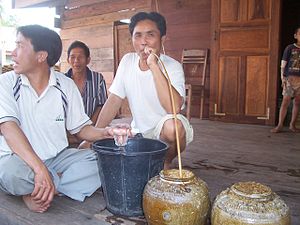 Lao men drinking Lao-Lao, a type of Laotian rice whiskey.
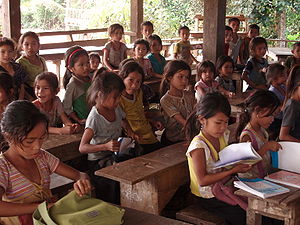 A primary school in a village in northern rural Laos
Population
Accoding to the 2010 Revision of the UN World Population Prospects [2], the population of Laos increased from 1.7 million in 1950 to 6.2 million in 2010. Until the year 2000 the proportion of children 0-14 years of age was over 40% of the total population. Due to decreasing fertility rates this porportion decreased to 34.5% in 2010. The proportion of elderly people is still very low (3.9%), although the proportion doubled between 1950 and 2010.
Total population Population aged 0-14
(%)Population aged 15-64
(%)Population aged 65+
(%)1950 1 683 40.4 57.4 2.1 1955 1 897 41.4 56.2 2.4 1960 2 130 42.1 55.3 2.6 1965 2 391 42.2 54.9 2.9 1970 2 691 41.9 55.0 3.1 1975 3 042 42.1 54.7 3.2 1980 3 235 43.9 52.5 3.5 1985 3 648 44.0 52.4 3.6 1990 4 192 43.7 52.7 3.6 1995 4 795 43.6 52.8 3.6 2000 5 317 42.3 54.0 3.7 2005 5 753 39.1 57.1 3.8 2010 6 201 34.5 61.6 3.9 Vital statistics
Births and deaths [2]
Period Live births per year Deaths per year Natural change per year CBR* CDR* NC* TFR* IMR* 1950-1955 80 000 37 000 43 000 44.8 20.9 23.9 5.94 167.1 1955-1960 87 000 40 000 47 000 43.2 20.1 23.1 5.96 160.1 1960-1965 96 000 44 000 52 000 42.4 19.3 23.1 5.97 153.5 1965-1970 107 000 47 000 60 000 42.3 18.7 23.6 5.98 147.0 1970-1975 122 000 52 000 70 000 42.5 18.1 24.4 5.99 140.5 1975-1980 132 000 54 000 78 000 42.2 17.2 25.0 6.15 132.4 1980-1985 145 000 56 000 90 000 42.2 16.2 26.0 6.36 122.6 1985-1990 165 000 56 000 109 000 42.1 14.4 27.7 6.27 107.6 1990-1995 180 000 53 000 127 000 40.0 11.9 28.1 5.88 88.3 1995-2000 170 000 48 000 122 000 33.6 9.4 24.2 4.81 70.8 2000-2005 154 000 44 000 110 000 27.8 7.9 19.9 3.70 58.2 2005-2010 144 000 39 000 105 000 24.1 6.6 17.5 3.02 44.5 - CBR = crude birth rate (per 1000); CDR = crude death rate (per 1000); NC = natural change (per 1000); IMR = infant mortality rate per 1000 births; TFR = total fertility rate (number of children per woman)
Ethnic groups
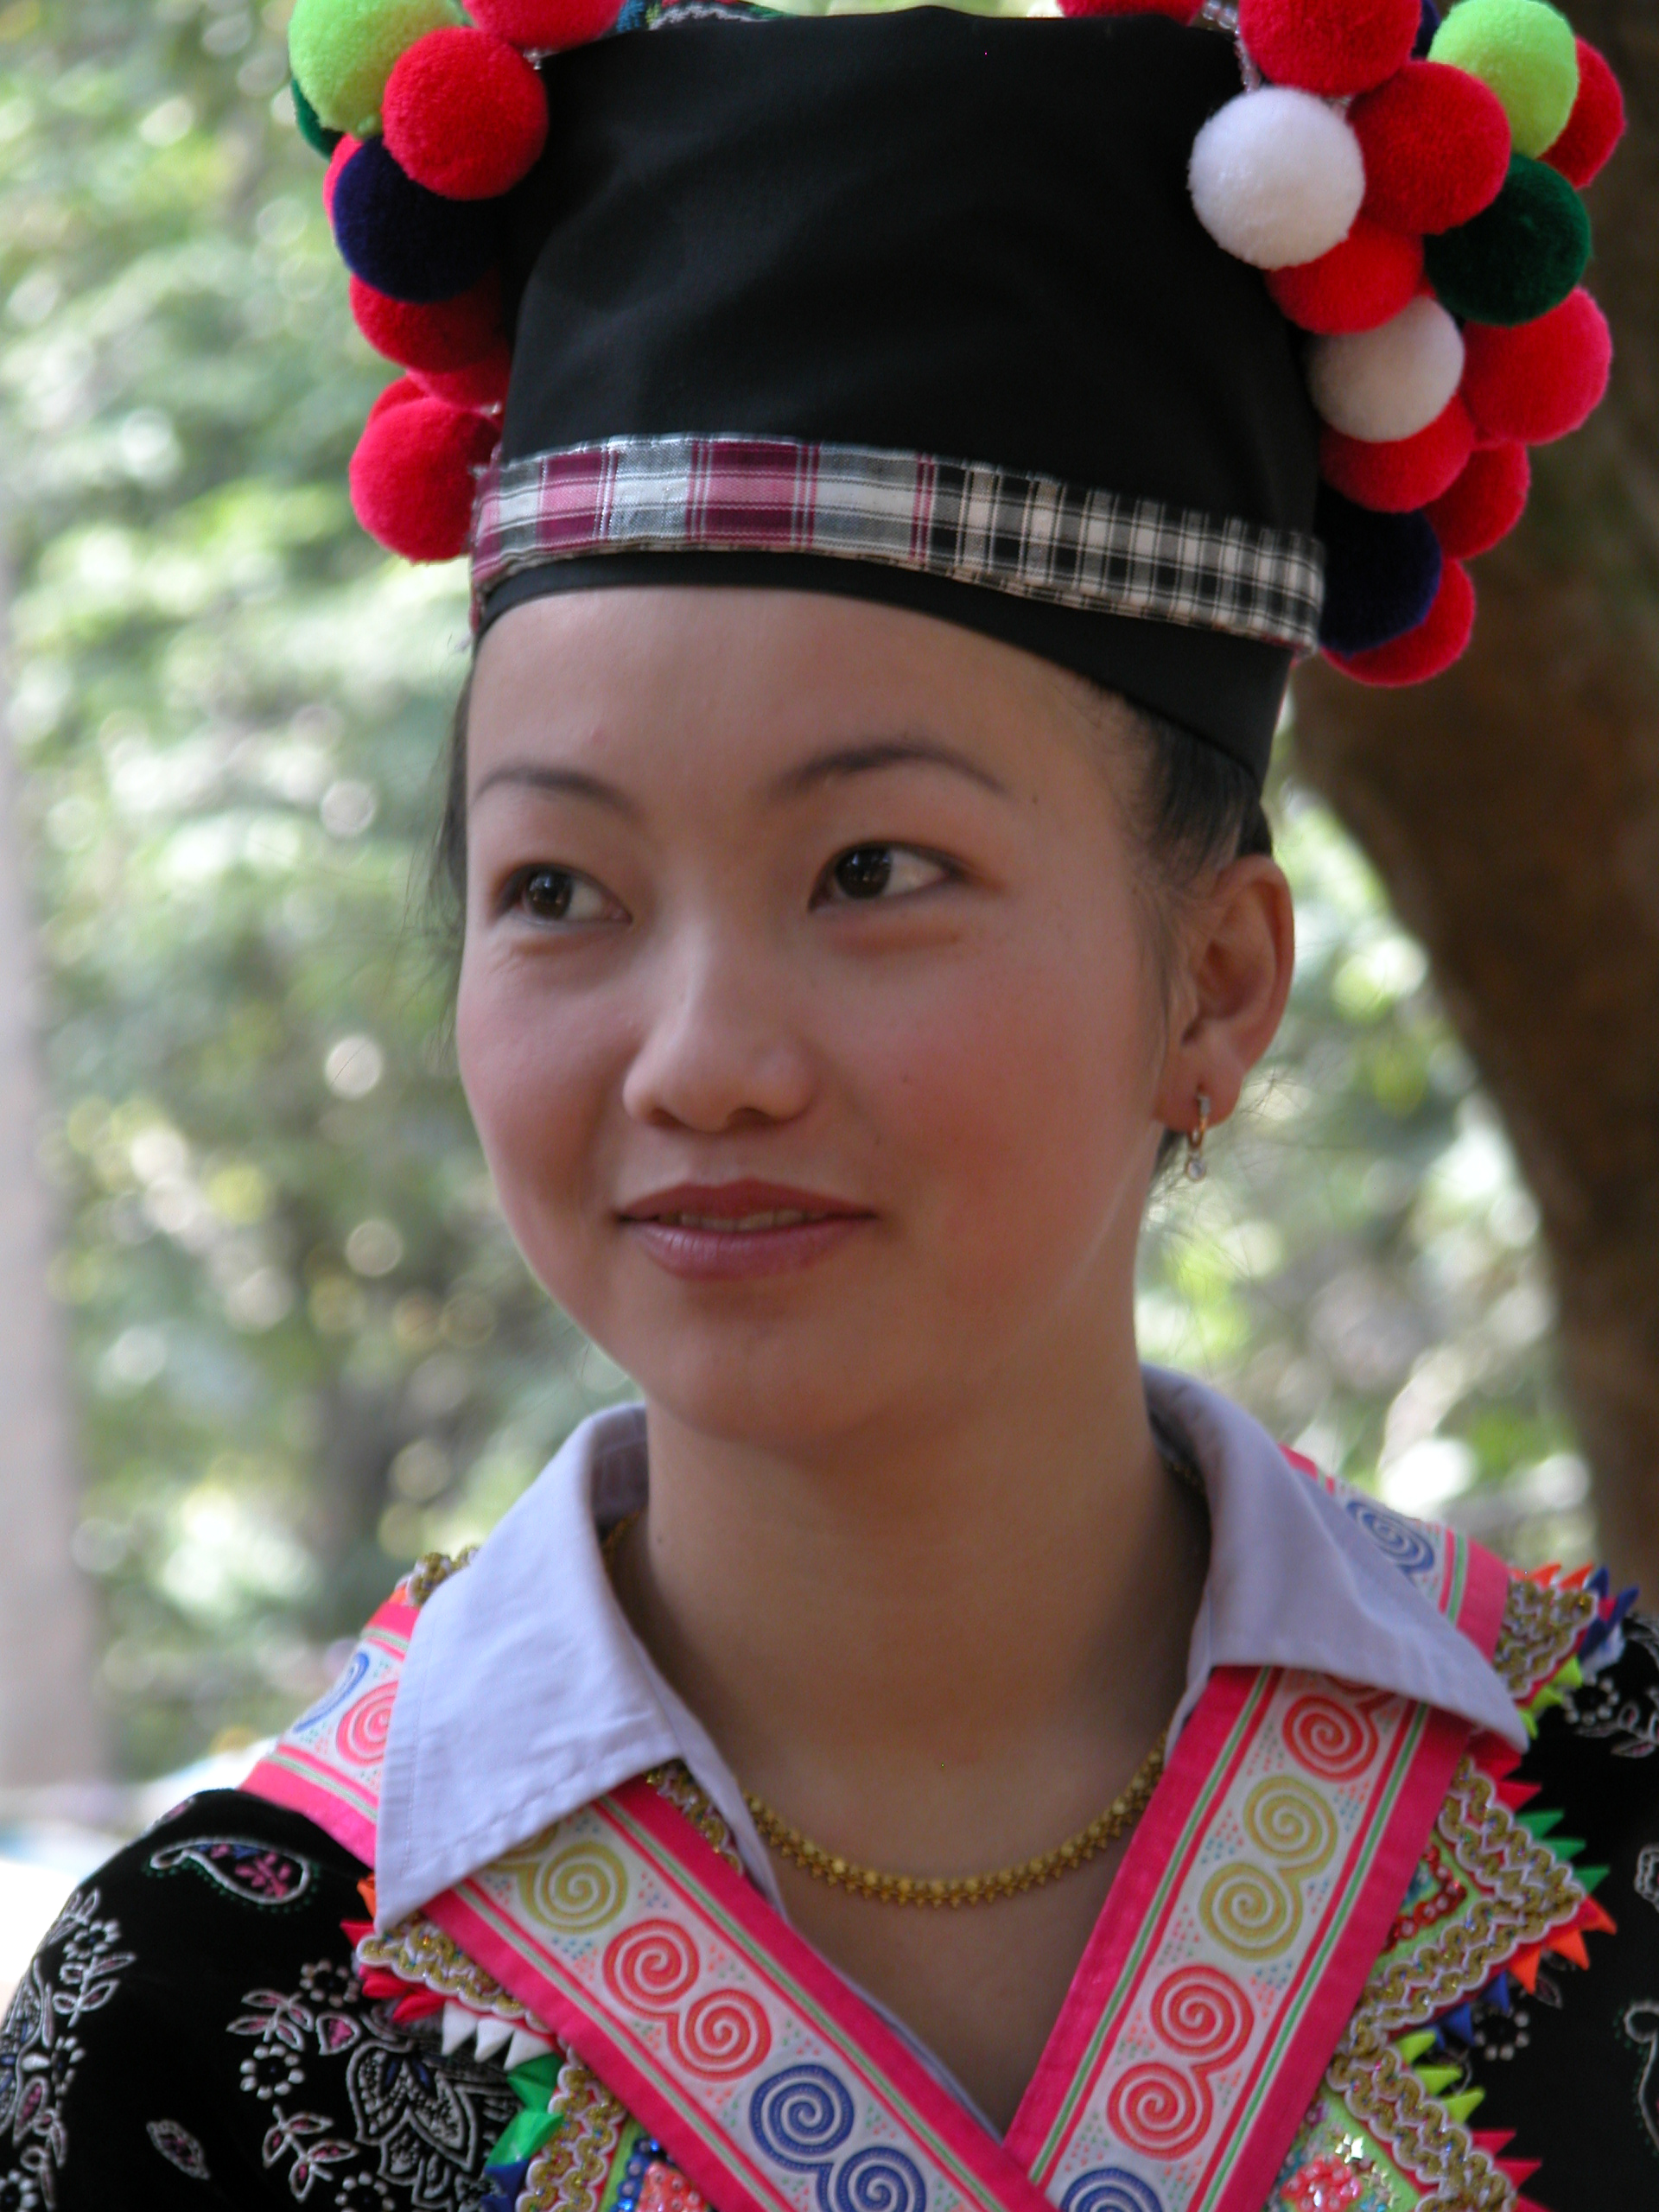
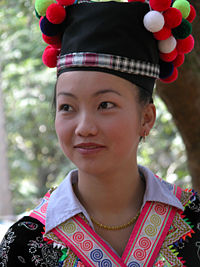 In Luang Prabang, a young woman at the time of a Hmong Meeting Festival
Specialists are largely in agreement as to the ethnolinguistic classification of the ethnic groups of Laos.[3] For the purposes of the 1995 census, the government of Laos recognized 149 ethnic groups within 47 main ethnicities.[3] whereas the Lao Front for National Construction (LFNC) recently revised the list to include 49 ethnicities consisting of over 160 ethnic groups.[3] The term ethnic minorities is used by some to classify the non-Lao ethnic groups, while the term indigenous peoples is not used by the Lao PDR.[3] These 160 ethnic groups speak a total of 82 distinct living languages.[4]
Lao 55%, Khmu 11%, Hmong 8%, Vietnamese 2%, other (over 100 minor ethnic groups) 26% (2005 census).
Population of Laos according to ethnic group in 1995 and 2005 Ethnic
groupLanguage
familycensus 1995[5] census 2005[5] Number % Number % Lao Tai-Kadai 2,403,891 52.5 3,067,005 54.6 Khmu Mon-Khmer 500,957 11.0 613,893 10.9 Hmong Hmong-Mien 315,465 6.9 415,946 8.0 Thai Tai-Kadai 215,254 3.8 Puthai Tai-Kadai 472,458 10.3 187,391 3.3 Leu Tai-Kadai 119,191 2.6 123,054 2.2 Katang Mon-Khmer 95,440 2.1 118,276 2.1 Makong Mon-Khmer 92,321 2.0 117,872 2.1 Akha (Kor) Tibeto-Burman 66,108 1.4 90,698 1.6 Xuay 45,498 1.0 42,834 0.8 Singsily 37,447 0.7 Taoey Mon-Khmer 30,876 0.7 32,177 0.6 Nhuane 26,239 0.6 29,442 0.5 Iewmien (Yao) Hmong-Mien 22,665 0.5 27,449 0.5 Phong Mon-Khmer 21,395 0.5 26,314 0.5 Brao (Lavae) Mon-Khmer 17,544 0.4 22,772 0.4 Katu Mon-Khmer 17,024 0.4 22,759 0.4 Oey Mon-Khmer 14,947 0.3 22,458 0.4 Pray Mon-Khmer 15,000 [4] 0.3 21,922 0.4 Lamed Mon-Khmer 16,740 0.3 19,827 0.4 Lahu (Musir) Tibeto-Burman 8,702 0.2 15,238 0.3 Thaneua Tai-Kadai 14,799 0.3 Kriang (Ngae) Mon-Khmer 12,189 0.3 12,879 0.2 Hor 8,900 0.2 10,437 0.2 Xingmoon (Puoc) Mon-Khmer 5,834 0.1 8,565 0.2 Jeng Mon-Khmer 6,511 0.1 7,559 0.1 Nhahem 5,152 0.1 6,785 0.1 Kmer 3,902 0.1 5,825 0.1 Toum (Hung) Mon-Khmer 2,510 0.05 4,458 0.08 Xaek Tai-Kadai 2,745 0.06 3.733 0.07 Samtao Mon-Khmer 2,213 0.05 3,533 0.06 Sila (Sida) Tibeto-Burman 1,772 0.04 2,939 0.05 Tri 20,906 0.5 2.668 0.05 Harak 2,128 0.04 Bid Mon-Khmer 1,509 0.03 1,691 0.03 Lolo Tibeto-Burman 1,407 0.03 1,691 0.03 Pako Mon-Khmer 13,224 0.3 1,675 0.03 Lavy Mon-Khmer 538 0.01 1,193 0.02 Yae Mon-Khmer 8,013 0.2 1,057 0.02 Sadang Mon-Khmer 786 0.02 938 0.02 Hanyi Tibeto-Burman 1,122 0.02 848 0.02 Nguane 1,344 0.03 722 0.01 Oedou Mon-Khmer 649 0.01 Yang 4,630 0.1 616 0.01 Moy 534 0.01 Thin (Mal) Mon-Khmer 23,193 0.51 514 0.01 Kree 739 0.02 495 0.01 Laven Mon-Khmer 40,519 0.9 Phounoy Tibeto-Burman 35,635 0.8 Talieng Mon-Khmer 23,091 0.5 Alack Mon-Khmer 16,594 0.4 Kui Mon-Khmer 6,268 0.1 Khir 1,639 0.04 Mone 217 0.00 Others & not stated 19,285 0.4 216,780 3.9 Total 4,574,848 5,621,982 CIA World Factbook demographic statistics
The following demographic statistics are from the CIA World Factbook, unless otherwise indicated.
Sex ratio:
at birth: 1.05 male(s)/female
under 15 years: 1.01 male(s)/female
15-64 years: 0.98 male(s)/female
65 years and over: 0.76 male(s)/female
total population: 0.98 male(s)/female (2009 est.)Life expectancy at birth:
total population: 56.68 years (2009 est.)
male: 54.56 years (2009 est.)
female: 58.9years (2009 est.)Nationality:
noun: Lao(s) or Laotian(s)
adjective: Lao or Laotian
Religions: Buddhist 67%, Christian 1.5%, other and unspecified 31.5% (see Religion in Laos)Languages: Lao (official), French, English, Vietnamese, and various ethnic languages
Literacy:
definition: age 15 and over can read and write
total population: 68.7%
male: 77%
female: 60.9% (2001 est.)See also
References
- ^ Population Census 2005
- ^ a b Population Division of the Department of Economic and Social Affairs of the United Nations Secretariat, World Population Prospects: The 2010 Revision
- ^ a b c d Indigenous Peoples Development Planning Document
- ^ a b Ethnologue report for Laos
- ^ a b UN Demographic Yearbooks
Sources
Categories:- Demographics by country
- Laotian society


Wikimedia Foundation. 2010.