- Demographics of Kazakhstan
-
Demographics of Kazakhstan 
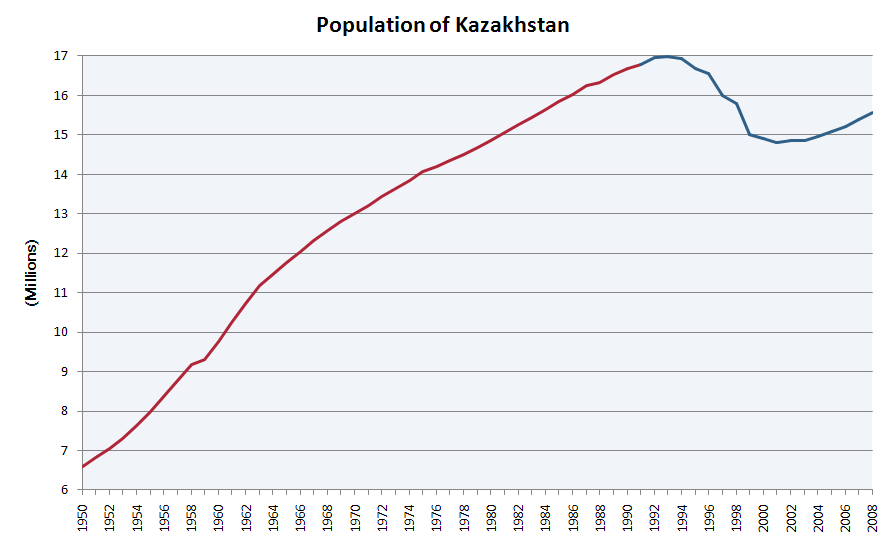
Population of Kazakhstan (in millions) from 1950-2009.Population: 16,500,000 (April, 2011) Density: 5.94/km2 Growth rate: 13.5/1,000 population (2010 est.) Birth rate: 22.4 births/1,000 population (2010 est.) Death rate: 8.9 deaths/1,000 population (2010 est.) Life expectancy: 67.87 years –male: 62.58 years –female: 73.47 years (2009 est.) Fertility rate: 2.65 children born/woman (2010 est.) Infant mortality rate: 18.4 deaths/1,000 live births Age structure: 0-14 years: 21.8% (male 1,717,469/female 1,643,920) 15-64 years: 70.2% (male 5,279,292/female 5,534,607) 65-over: 7.9% (male 426,494/female 797,655) (2009 est.) Sex ratio: At birth: 1.06 male(s)/female Under 15: 1.04 male(s)/female 15-64 years: 0.95 male(s)/female 65-over: 0.54 male(s)/female Nationality: Nationality: Kazakh(s) Major ethnic: Kazakh Minor ethnic: Russian, Uzbek, Ukrainian, Uyghur, Tatar, German Language: Official: Kazakh Spoken: Kazakh, Russian The Demographics of Kazakhstan enumerate the demographic features of the population of Kazakhstan, including population growth, population density, ethnicity, education level, health, economic status, religious affiliations, and other aspects of the population. The adjective to describe people or things from Kazakhstan is Kazakh[1][2][3] (though the US State Department uses Kazakhstani).[4] The name of the ethnic majority are Kazakhs.
Contents
Demographic trends
Official estimates put the population of Kazakhstan at 16 500 000 as of April, 2011, of which 46% is rural and 54% urban population.[5] The 2009 population estimate is 6.8% higher than the population reported in the last census from January 1999 (slightly less than 15 million). These estimates have been confirmed by the 2009 population census, and this means that the decline in population that began after 1989 has been arrested and reversed.
The proportion of men makes up 48.3%, the proportion of women 51.7%. The proportion of Kazakhs makes up 63.6%, Russians 23.3%, Uzbeks 2.9%, Ukrainians 2.0%, Uygur 1.4%, Tatars 1.2%, Germans 1.1%, others 4.5%.
The population of Kazakhstan increased steadily from 6.1 million in the 1939 census to 16.5 million in the 1989 census. Official estimates indicate that the population continued to increase after 1989, peaking out at 17 million in 1993 and then declining to 15 million in the 1999 census. The downward trend continued through 2002, when the estimated population bottomed out at 14.9 million, and then resumed its growth.[6] Kazakhstan underwent significant urbanization during the first 50 years of the Soviet era, as the share of rural population declined from more than 90% in the 1920s to less than 50% since the 1970s.[7]
Population of Kazakhstan 1939-2009
Year (January) Population ('000) Rural, % Urban, % Source 1939 6,081 72 28 census 1959 9,295 56 44 census 1970 13,001 50 50 census 1979 14,685 46 54 census 1989 16,537 43 57 census 1999 14,953 43 57 census 2002 14,851 43 57 estimate 2005 15,075 43 57 estimate 2008 15,572 47 53 estimate 2009 16,005 46 54 census - Data sources: Population 1939-1999 from demoscope.ru,[6] 2002-2008 from Kazakhstan Statistical Agency web site.[8] Rural/urban shares 1939-1993 from statistical yearbooks, print editions,[7] 2002-2008 from Kazakhstan Statistical Agency web site.[8] 2009 census [9]
As of 2003, there were discrepancies between Westerm sources regarding the population of Kazakhstan. United States government sources, including the CIA World Fact Book and the US Census Bureau International Data Base, listed the population as 15,340,533,[10] while the World Bank gave a 2002 estimate of 14,794,830.[citation needed] This discrepancy was presumably due to difficulties in measurement caused by the large migratory population in Kazakhstan, emigration, and low population density - only about 5.5 persons per km² in an area the size of Western Europe.
Vital statistics
Births and deaths[11] [12]
Average population (x 1000) Live births1 Deaths1 Natural change1 Crude birth rate (per 1000) Crude death rate (per 1000) Natural change (per 1000) 1950 6 703 252 000 97 000 155 000 37.6 14.4 25.9 1951 6 831 256 000 98 000 158 000 37.5 26.3 1952 7 042 264 000 101 000 163 000 37.5 26.8 1953 7 316 262 000 104 000 158 000 35.8 25.7 1954 7 637 286 000 106 000 180 000 37.5 27.7 1955 7 992 300 000 109 000 191 000 37.5 12.9 28.2 1956 8 371 313 000 112 000 201 000 37.4 28.8 1957 8 765 326 000 115 000 211 000 37.2 29.2 1958 9 169 340 000 116 000 224 000 37.1 29.7 1959 9 581 354 000 118 000 236 000 36.9 29.9 1960 9 995 371 800 121 000 250 800 37.2 11.3 30.6 1961 10 480 377 000 124 000 253 000 36.0 24.1 1962 10 958 368 300 127 000 241 300 33.6 22.0 1963 11 321 352 400 125 000 227 400 31.1 20.1 1964 11 610 330 500 125 000 205 500 28.5 17.7 1965 11 910 320 600 124 000 196 600 26.9 9.6 16.5 1966 12 185 313 500 124 000 189 500 25.7 15.6 1967 12 456 307 200 123 000 184 200 24.7 14.8 1968 12 694 302 000 121 000 181 000 23.8 14.3 1969 12 900 302 200 122 000 180 200 23.4 13.9 1970 13 105 306 700 121 000 185 700 23.4 9.2 17.4 1971 13 320 317 400 124 000 193 400 23.8 14.4 1972 13 533 318 600 125 000 193 600 23.5 14.2 1973 13 742 321 100 126 000 195 100 23.4 14.1 1974 13 955 338 300 127 000 211 300 24.2 15.1 1975 14 136 343 700 127 000 216 700 24.3 8.8 15.3 1976 14 279 350 400 128 000 222 400 24.5 15.6 1977 14 425 349 400 128 000 221 400 24.2 15.3 1978 14 588 355 300 127 000 228 300 24.4 15.6 1979 14 753 354 320 113 687 240 633 24.0 16.3 1980 14 919 356 013 119 078 236 935 23.9 8.0 15.9 1981 15 096 367 950 120 974 246 976 24.4 8.0 16.4 1982 15 279 373 416 120 165 253 251 24.4 7.9 16.6 1983 15 463 378 577 123 807 254 770 24.5 8.0 16.5 1984 15 647 399 403 129 796 269 607 25.5 8.3 17.2 1985 15 780 396 929 126 786 270 143 25.2 8.0 17.1 1986 15 965 410 846 119 149 291 697 25.7 7.5 18.3 1987 16 167 417 139 122 835 294 304 25.8 7.6 18.2 1988 16 362 407 116 126 898 280 218 24.9 7.8 17.1 1989 16 537 382 269 126 378 255 891 23.1 7.6 15.5 1990 16 670 363 335 128 787 234 548 21.8 7.7 14.1 1991 16 525 354 101 134 572 219 529 21.4 8.1 13.3 1992 16 440 338 475 137 705 200 770 20.6 8.4 12.2 1993 16 381 316 263 156 317 159 946 19.3 9.5 9.8 1994 16 146 306 509 160 590 145 919 19.0 9.9 9.0 1995 15 816 277 006 168 885 108 121 17.5 10.7 6.8 1996 15 578 253 175 166 028 87 147 16.3 10.7 5.6 1997 15 334 232 356 160 138 72 218 15.2 10.4 4.7 1998 15 072 222 380 154 314 68 066 14.8 10.2 4.5 1999 14 928 217 578 147 416 70 162 14.6 9.9 4.7 2000 14 882 222 054 149 778 72 276 14.9 10.1 4.9 2001 14 854 221 487 147 876 73 611 14.9 10.0 5.0 2002 14 854 227 171 149 381 77 790 15.3 10.1 5.2 2003 14 901 247 946 155 277 92 669 16.6 10.4 6.2 2004 15 013 273 028 152 250 120 778 18.2 10.1 8.0 2005 15 147 278 977 157 121 121 856 18.4 10.4 8.0 2006 15 307 301 756 157 210 144 546 19.7 10.3 9.4 2007 15 481 321 963 158 297 163 666 20.8 10.2 10.6 2008 15 672 356 575 152 706 203 869 22.8 9.7 13.0 2009 15 989 358 766 143 682 215 084 22.4 9.0 13.5 2010 (p) 16 317 366 210 145 945 220 265 22.4 8.9 13.5 1 Births and deaths until 1979 are estimates.
p=prelimanary results
Total fertility rate
Total fertility rate by regions of Kazakhstan: Mangystau - 3,80, South Kazakhstan - 3,71, Kyzylorda - 3,42, Atyrau - 3,29, Jambyl - 3,20, Aqtobe - 2,70, Almaty (province) - 2,65, Almaty (city) - 2,65, City of Astana - 2,44, West Kazakhstan - 2,29, Aqmola - 2,19, East Kazakhstan - 2,07, Qaragandy - 2,04, Pavlodar - 1,98, North Kazakhstan - 1,72, Qostanay - 1,70, Republic of Kazakhstan - 2,65. Thus it can be seen that fertility rate is higher in more traditionalist and religious south and west, and lower in the north and east, where the percentage of Slavic and German population is still relatively high.[13]
According to the Kazakhstan Demographic and Health Survey in 1999, the TFR for Kazakhs was 2.5 and that for Russians was 1.38. TFR in 1989 for Kazakhs & Russians were 3.58 and 2.24 respectively.[14]
Ethnic groups
Main article: Ethnic demography of KazakhstanAccording to the 2009 census there are two dominant ethnical groups in Kazakhstan, they are ethnic Kazakhs (63.1%) and ethnic Russians (23.7%) with a wide array of other groups represented, including Ukrainians, Uzbeks, Germans, Chechens, Koreans, and Uyghurs - that is, virtually any group that has ever come under the Russian sphere of influence. This diverse demography is due to the country's central location and its historical use by Russia as a place to send colonists, dissidents, and minority groups from its other frontiers - one can almost not understand Kazakhstan without understanding population transfer in the Soviet Union. From the 1930s until the 1950s, both Russian opposition (and such Russians "accused" of being part of the opposition) and certain minorities (esp. Volga Germans, Poles, Ukrainians, Crimean Tatars, Kalmyks) had been interned in labor camps often merely due to their heritage or beliefs, mostly on collective orders by Joseph Stalin. This makes Kazakhstan one of the few places on Earth where normally-disparate Germanic, Indo-Iranian, Koreans, Chechen, and Turkic groups live together in a rural setting and not as a result of modern immigration. Most of the population speaks Russian; only half of ethnic Kazakhs speak Kazakh fluently, although it is enjoying a renaissance. Both Kazakh and Russian languages have official status.
After the fall of the Soviet Union, the German population of Kazakhstan proceeded to emigrate en masse during the 1990s [3], as Germany is willing to repatriate them. Also much of the smaller Greek minority took the chance to repatriate to Greece, so did many Russians move to Russia. Some groups have fewer good options for emigration but because of the economic situation are also leaving at rates comparable to the rest of the former East bloc.
Population of Kazakhstan according to ethnic group 1926–2009 Ethnic
groupcensus 19261 census 19392 census 19593 census 19704 census 19795 census 19896 census 19997 census 20097 Number % Number % Number % Number % Number % Number % Number % Number % Kazakhs 3,627,612 58.5 2,327,625 37.8 2,794,966 30.0 4,161,164 32.4 5,289,349 36.0 6,534,616 39.7 8,011,452 53.5 10,096,763 63.1 Russians 1,275,055 20.6 2,458,687 40.0 3,974,229 42.7 5,499,826 42.8 5,991,205 40.8 6,227,549 37.8 4,480,675 29.9 3,793,764 23.7 Uzbeks 129,407 2.1 120,655 2.0 136,570 1.5 207,514 1.6 263,295 1.8 332,017 2.0 370,765 2.5 456,997 2.9 Ukrainians 860,201 13.9 658,319 10.7 762,131 8.2 930,158 7.2 897,964 6.1 896,240 5.4 547,065 3.7 333,031 2.1 Uygurs 11,631 0.2 35,409 0.6 59,840 0.6 120,784 0.9 147,943 1.0 185,301 1.1 210,377 1.4 224,713 1.4 Tatars 79,758 1.3 108,127 1.8 191,802 2.1 281,849 2.2 312,626 2.1 327,982 2.0 249,052 1.7 204,229 1.3 Germans 51,094 0.8 92,571 1.5 659,800 7.1 839,649 6.5 900,207 6.1 957,518 5.8 353,462 2.4 178,409 2.1 Koreans 42 0.0 96,453 1.6 74,019 0.8 78,078 0.6 91,984 0.6 103,315 0.6 99,944 0.7 100,385 0.6 Turks 46 0.0 523 0.0 9,916 0.1 18,397 0.1 25,820 0.2 49,567 0.3 75,950 0.5 97,015 0.6 Azeris 20 0.0 12,996 0.2 38,362 0.4 56,166 0.4 73,345 0.5 90,083 0.5 78,325 0.5 85,292 0.5 Belorussians 25,584 0.4 31,614 0.5 107,463 1.2 197,592 1.5 181,491 1.2 182,601 1.1 111,924 0.7 66,476 0.4 Dungans 8,455 0.1 7,415 0.1 9,980 0.1 17,283 0.1 22,491 0.2 30,165 0.2 36,945 0.2 51,944 0.3 Kurds 2,387 0.0 6,109 0.1 12,299 0.1 17,692 0.1 25,425 0.2 32,764 0.2 38,325 0.2 Tajiks 7,599 0.1 11,229 0.2 8,075 0.1 7,166 0.1 19,293 0.1 25,514 0.2 25,673 0.2 36,277 0.2 Poles 3,742 0.1 54,809 0.9 53,102 0.6 61,355 0.5 61,136 0.4 59,956 0.4 47,302 0.3 34,057 0.2 Chechens 3 0.0 2,639 0.0 130,232 1.4 34,492 0.3 38,256 0.3 49,507 0.3 31,802 0.2 31,431 0.2 Kyrgyz 10,200 0.2 5,033 0.1 6,810 0.1 9,474 0.1 9,352 0.1 14,112 0.1 10,925 0.1 23,274 0.1 Others 108,016 1.7 124,611 2.0 286,441 3.1 315,347 2.5 340,834 2.3 372,996 2.3 206,879 1.4 157,215 1.0 Total 6,198,465 6,151,102 9,309,847 12,848,573 14,684,283 16,464,464 14,981,281 16,009,597 1 Excluding the Kara-Kalpak AO; source: [4]. 2 Source: [5]. 3 Source: [6]. 4 Source: [7]. 5 Source: [8]. 6 Source: [9]. 7 Source: [10] 
Religions
Religions of Kazakhstan
(National census 2009 preliminary results[15])Respondents' declarations Number
in thousandsShare
%Islam 11,237.9 70.19 Christianity 4,190.1 26.17 Judaism 5.3 .03 Buddhism 14.6 .09 Other religions 30.1 .19 No religious affiliation 450.5 2.81 No answer 81 .51 Kazakhstan 16,009.6 100 References
- ^ UK Foreign and Commonwealth Office, Kazakhstan, 2 Feb 2011.
- ^ Embassy of the Republic of Kazakhstan to the USA.
- ^ Ambassador Erlan A Idissov, Embassy of the Republic of Kazakhstan to the USA.
- ^ US State Department, Background note: Khazakhstan, 9 April 2009.
- ^ [1], Statistical Agency of the Republic of Kazakhstan (Russian)
- ^ a b Population dynamics and ethnic composition of Kazakhstan in the second half of the 20th century, Demoscope Weekly, No. 103-104, 3–16 March 2003 (Russian)
- ^ a b Statistical Yearbook of Kazakhstan, Almaty, various years since 1980 (Russian)
- ^ a b Population and social policy, Statistical Agency of the Republic of Kazakhstan (Russian)
- ^ Kazakhstan National Census 2009 preliminary results
- ^ CIA Factbook (Kazakhstan) Retrieved on May 2, 2008
- ^ http://unstats.un.org/unsd/demographic/products/dyb/dyb2.htm#2001 United nations. Demographic Yearbooks
- ^ Agency of Statistics of the Republic of Kazazkstan
- ^ [2]
- ^ Kazakhstan: Demographic and Health Survey, 1999 - Final Report, Chapter 4: Fertility
- ^ National census 2009 preliminary results
Bibliography
- Rasuly-Paleczek, Gabriele; Katschnig, Julia (2005), Central Asia on Display: Proceedings of the VIIth Conference of the European Society for Central Asian Studies, LIT Verlag Münster, ISBN 3825883094.
External links
For current data, use these sites.
- Population and social policy, Statistical Agency of the Republic of Kazakhstan (kaz
- World Bank Database
- CIA World Fact Book page on Kazakhstan
- US Census Bureau International Data Base
- countrystudies.us
- WESP population statistics
- Russians left behind in Central Asia
Demographics of Europe Sovereign
states- Albania
- Andorra
- Armenia
- Austria
- Azerbaijan
- Belarus
- Belgium
- Bosnia and Herzegovina
- Bulgaria
- Croatia
- Cyprus
- Czech Republic
- Denmark
- Estonia
- Finland
- France
- Georgia
- Germany
- Greece
- Hungary
- Iceland
- Ireland
- Italy
- Kazakhstan
- Latvia
- Liechtenstein
- Lithuania
- Luxembourg
- Macedonia
- Malta
- Moldova
- Monaco
- Montenegro
- Netherlands
- Norway
- Poland
- Portugal
- Romania
- Russia
- San Marino
- Serbia
- Slovakia
- Slovenia
- Spain
- Sweden
- Switzerland
- Turkey
- Ukraine
- United Kingdom
- (England
- Northern Ireland
- Scotland
- Wales)
- Vatican City
States with limited
recognition- Abkhazia
- Kosovo
- Nagorno-Karabakh
- Northern Cyprus
- South Ossetia
- Transnistria
Dependencies
and other territories- Åland
- Faroe Islands
- Gibraltar
- Guernsey
- Jan Mayen
- Jersey
- Isle of Man
- Svalbard
Other entities - European Union
Ethnic groups in Asia Sovereign
states- Afghanistan
- Armenia
- Azerbaijan
- Bahrain
- Bangladesh
- Bhutan
- Brunei
- Burma (Myanmar)
- Cambodia
- People's Republic of China
- Cyprus
- East Timor (Timor-Leste)
- Egypt
- Georgia
- India
- Indonesia
- Iran
- Iraq
- Israel
- Japan
- Jordan
- Kazakhstan
- North Korea
- South Korea
- Kuwait
- Kyrgyzstan
- Laos
- Lebanon
- Malaysia
- Maldives
- Mongolia
- Nepal
- Oman
- Pakistan
- Philippines
- Qatar
- Russia
- Saudi Arabia
- Singapore
- Sri Lanka
- Syria
- Tajikistan
- Thailand
- Turkey
- Turkmenistan
- United Arab Emirates
- Uzbekistan
- Vietnam
- Yemen
States with limited
recognition- Abkhazia
- Nagorno-Karabakh
- Northern Cyprus
- Palestine
- Republic of China (Taiwan)
- South Ossetia
Dependencies and
other territories- Christmas Island
- Cocos (Keeling) Islands
- Hong Kong
- Macau
Ethnic groups in Europe Sovereign
states- Albania
- Andorra
- Armenia
- Austria
- Azerbaijan
- Belarus
- Belgium
- Bosnia and Herzegovina
- Bulgaria
- Croatia
- Cyprus
- Czech Republic
- Denmark
- Estonia
- Finland
- France
- Georgia
- Germany
- Greece
- Hungary
- Iceland
- Ireland
- Italy
- Kazakhstan
- Latvia
- Liechtenstein
- Lithuania
- Luxembourg
- Macedonia
- Malta
- Moldova
- Monaco
- Montenegro
- Netherlands
- Norway
- Poland
- Portugal
- Romania
- Russia
- San Marino
- Serbia
- Slovakia
- Slovenia
- Spain
- Sweden
- Switzerland
- Turkey
- Ukraine
- United Kingdom
- (England
- Northern Ireland
- Scotland
- Wales)
States with limited
recognition- Abkhazia
- Kosovo
- Nagorno-Karabakh
- Northern Cyprus
- South Ossetia
- Transnistria
Dependencies
and other territories- Åland
- Faroe Islands
- Gibraltar
- Guernsey
- Jan Mayen
- Jersey
- Isle of Man
- Svalbard
Other entities  Kazakhstan topics
History PrehistoryEarly historyXiongnu Empire · Tele · Hunnic Empire · Rouran Khaganate · Göktürks · Western Turkic Khaganate · Eastern Turkic Khaganate · Kangar union · Kimek Khanate · Karluks · Oghuz Yabgu State · Xueyantuo Khaganate · Uyghur Kaganate · Kyrgyz Khaganate · Kara-Khanid Khanate · Khwarezmid Empire · Mongol Empire · Chagatai Khanate · Golden Horde · Nogai Horde · White HordeSince 1456Kazakh Khanate · List of Kazakh khans · Jüz · Russian Turkestan · Alash Autonomy · Kazakh ASSR · Kazakh SSR · Republic of Kazakhstan
Government and
politicsConstitution · President · Prime Minister · Parliament (Senate · Mazhilis) · Political Parties · Elections · Foreign Relations · Military · Human rights · LGBT rightsAdministrative
divisionsGeography Economy Demographics Religion Culture Coat of arms · National flag · National anthem · Alphabet · Cuisine · Education · Language · Media · Music · Sport · Wedding · Famous Kazakhs · KaznetWikiProject · Portal Categories:

Wikimedia Foundation. 2010.