- Demographics of Japan
-
The demographic features of the population of Japan include population density, ethnicity, education level, health of the populace, economic status, religious affiliations and other aspects of the population.
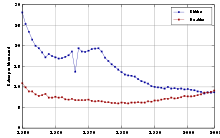 Birth and death rates of Japan since 1950
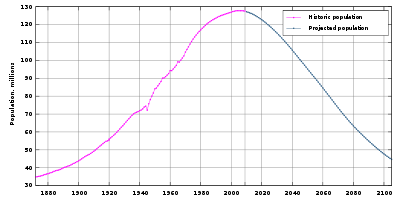
As of March 2009, Japan's population is 127,076,183,[1] making it the world's tenth most populated country. Its size can be attributed to fast growth rates experienced during the late 19th and early 20th centuries.
After having experienced net population loss over a number of years due to falling birth rates and almost no net immigration, and despite having one of the highest life expectancies in the world at 81.25 years of age as of 2006,[2] Japan's population rose for a second year in a row in 2009,[3] mainly because more Japanese returned to Japan than left.[citation needed]
The population of Japan in 2000, at New Year, was 127 million. Its population density was 336 people per square kilometer.
The population ranking of Japan dropped from 7th to 8th in 1990, from 8th to 9th in 1998, and from 9th to 10th since.
Population Census
Historical population of Japan Census Pop. %± 1990 123,611,167 — 1995 125,570,246 1.6% 2000 126,925,843 1.1% 2005 127,767,994 0.7% 2010 128,056,026 0.2% Est. 2011 127,760,000 -0.2% Source:Census of Japan[4] Japan collects census information every five years. The exercise is conducted by the Statistics Bureau of the Ministry of Internal Affairs and Communications. October 1, 2010 is Population Census Day.[5]
Urban distribution
Japan is an urban society with about only 5% of the labor force engaged in agriculture. Many farmers supplement their income with part-time jobs in nearby towns and cities. About 80 million of the urban population is heavily concentrated on the Pacific shore of Honshū. Metropolitan Tokyo-Yokohama, with 35,000,000 people, is the world's most populous city. Japan faces the same problems that confront urban industrialized societies throughout the world: over-crowded cities and congested highways.
Languages
Japanese society of Yamato people is linguistically homogeneous with small populations of Koreans (0.6 million), Chinese/Taiwanese (0.5 million), Filipino (305,972 some being Japanese Filipino; children of Japanese and Filipino parentage).[6] Brazilians (300,000, many of whom are ethnically Japanese). Japan has indigenous minority groups such as the Ainu and Ryukyuans and social minority groups like the burakumin.
Japanese citizenship is conferred jus sanguinis, and monolingual Japanese-speaking minorities often reside in Japan for generations under permanent residency status without acquiring citizenship in their country of birth, although legally they are allowed to do so. This is because Japanese law does not recognise dual citizenship, and so people becoming naturalised Japanese citizens must relinquish citizenship of other countries. Some ethnic Koreans and Chinese and their descendants (who may speak only Japanese and may never have even visited the country whose nationality they hold) do not wish to abandon this other citizenship. In addition, people taking Japanese citizenship must take a name using the Japanese characters hiragana, katakana, and/or kanji. Names using Western alphabet, Korean characters, Arabic characters, etc. are not acceptable as legal names. Chinese characters are usually legally acceptable as nearly all Chinese characters are recognized as valid by the Japanese government. Phonetic transliterations of non-Japanese names using katakana (eg. スミス "Sumisu" to mean "Smith") are also legally acceptable. However, some feel that becoming a Japanese citizen should mean that they have a Japanese name and that they should abandon their foreign name, and some do not wish to do this - although most 'special permanent resident' Koreans and Chinese already use Japanese names, so this is not such an important factor. Nonetheless, some 10,000 Zainichi Koreans naturalize every year. Approximately 98.6% of the population is pure Japanese (though technically this figure includes all naturalized people regardless of race) and 99% of the population speak Japanese as their first language. Non-ethnic Japanese in the past, and to an extent in the present, also live in small numbers in the Japanese archipelago.[7]
Birth rate
In February 2007, demographers and the Japanese government announced the first significant rise in the national birth rate in 40 years took place in 2006. The nation had 1.2 million births in 2000.[8]
Population density
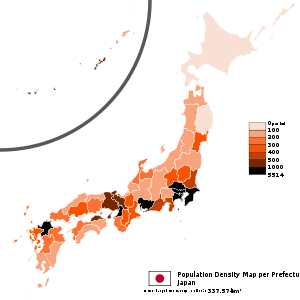 Japan population density Map per prefecture as of 2009 per square kilometer:0–100101–200201–300301–400401–500500–10001000–5514
Japan's population density is 336 persons per square kilometer according to the United Nations World Populations Prospects Report as of July 2005. It ranks 32nd in a list of countries by population density, ranking directly above India (336 per km²) and directly below Belgium (341 per km²). Between 1955 and 1989, land prices in the six largest cities increased 15,000% (+12% a year). Urban land prices generally increased 40% from 1980 to 1987; in the six largest cities, the price of land doubled over that period. For many families, this trend put housing in central cities out of reach.
The result was lengthy commutes for many workers; daily commutes of two hours each way are not uncommon in the Tokyo area. After a decade of declining land prices, residents have been moving back into central city areas (especially Tokyo's 23 wards), as evidenced by 2005 census figures. Despite the large amount of forested land in Japan, parks in cities are smaller and scarcer than in major West European or North American cities, which average 10 times the amount of parkland per inhabitant.[citation needed]
National and regional governments devote resources to making regional cities and rural areas more attractive by developing transportation networks, social services, industry, and educational institutions in attempts to decentralize settlement and improve the quality of life. Nevertheless, major cities, especially Tokyo, Yokohama and Chiba and, to a lesser extent, Kyoto, Osaka and Kobe, remain attractive to young people seeking education and jobs.[citation needed]
Migration
Internal migration
Between 6 million and 7 million people moved their residences each year during the 1980s. About 50% of these moves were within the same prefecture; the others were relocations from one prefecture to another. During Japan's economic development in the twentieth century, and especially during the 1950s and 1960s, migration was characterized by urbanization as people from rural areas in increasing numbers moved to the larger metropolitan areas in search of better jobs and education. Out-migration from rural prefectures continued in the late 1980s, but more slowly than in previous decades.
In the 1980s, government policy provided support for new urban development away from the large cities, particularly Tokyo, and assisted regional cities to attract young people to live and work there. Regional cities offered familiarity to those from nearby areas, lower costs of living, shorter commutes, and, in general, a more relaxed lifestyle than could be had in larger cities. Young people continued to move to large cities, however, to attend universities and find work, but some returned to regional cities (a pattern known as U-turn) or to their prefecture of origin (a pattern referred to as J-turn).
Government statistics show that in the 1980s significant numbers of people left the largest central cities (Tokyo and Osaka) to move to suburbs within their metropolitan areas. In 1988 more than 500,000 people left Tokyo, which experienced a net loss through migration of nearly 73,000 for the year. Osaka had a net loss of nearly 36,000 in the same year. However, the prefectures showing the highest net growth are located near the major urban centers, such as Saitama, Chiba, Ibaraki, and Kanagawa around Tokyo, and Hyogo, Nara, and Shiga near Osaka and Kyoto. This pattern suggests a process of suburbanization, people moving away from the cities for affordable housing but still commuting there for work and recreation, rather than a true decentralization. More people in Japan like to live near coastal areas because they are easier to travel around in than the mountainous interior.
Emigration
About 663,100 Japanese were living abroad, approximately 75,000 of whom had permanent foreign residency, more than six times the number who had that status in 1975. More than 200,000 Japanese went abroad in 1990 for extended periods of study, research, or business assignments. As the government and private corporations have stressed internationalization, greater numbers of individuals have been directly affected, decreasing Japan's historical insularity. Despite the benefits of experiencing life abroad, individuals who have lived outside of Japan for extended periods often faced problems of discrimination upon their return because others might no longer consider them fully Japanese.[citation needed] By the late 1980s, these problems, particularly the bullying of returnee children in schools, had become a major public issue both in Japan and in Japanese communities abroad.
Immigration
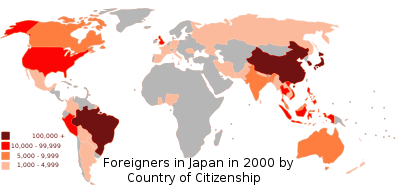
According to the Japanese immigration centre,[9] the number of foreign residents in Japan has steadily increased, and the number of foreign residents (excluding illegal immigrants and short-term visitors such as foreign nationals staying less than 90 days in Japan[10]) were more than 2.2 million people in 2008.[9]
In 2010, the number of foreigners in Japan was 2,134,151. There was 230,552 Brazilians who are mostly of Japanese descent, 687,156 Chinese and 565,989 Koreans. Koreans, Chinese and Brazilians account for about 69,5% of foreign residents in Japan.[11]
Among the immigrants, Japan accepts a steady flow of 15,000 new Japanese citizens by naturalization (帰化) per year.[12] Indeed, the concept of the ethnic groups by the Japanese statistics is different from the ethnicity census of North American or some Western European statistics. For example, the United Kingdom Census asks ethnic or racial background which composites the population of the United Kingdom, regardless of their nationalities.[13] The Japanese Statistics Bureau, however, does not have this question yet. Since the Japanese population census asks the people's nationality rather than their ethnic background, naturalized Japanese citizens and Japanese nationals with multi-ethnic background are considered to be ethnically Japanese in the population census of Japan.[9] Thus, in spite of the widespread belief that Japan is ethnically homogeneous, it is probably more accurate to describe it as a multiethnic society.[14]
In the 1990s and early 2000s, Japanese diplomats signed agreements with South Asian officials to obtain an estimated 50,000 temporary "guest workers" to work in Japan. Similar guest-worker agreements with Latin American countries, such as Brazil, Uruguay, Chile, Mexico and Peru have brought another 20,000 foreigners to Japan, including Latin Americans of Japanese descent who might culturally assimilate into the Japanese population.[citation needed]
Society
Lifestyle
Japanese people enjoy a high standard of living, and nearly 90% of the population consider themselves part of the middle class. However, many studies on happiness and satisfaction with life tend to find that Japanese people average relatively low levels of life satisfaction and happiness when compared to most of the highly developed world; the levels have remained consistent if not declining slightly over the last half century.[15][16][17][18] Japanese have been surveyed to be relatively lacking in financial satisfaction.[19] The suicide rates per 100,000 in Japan in 2004 were 36.5 for men and 12.8 for women, the second-highest in the OECD.[20]. While in 2010 estimated suicidal incidents were 32000 which means about 88 Japanese nationals committed suicide per day in 2010[21].
Minorities
Hisabetsu Buraku
Three native Japanese minority groups can be identified. The largest are the hisabetsu buraku or "discriminated communities," also known as the burakumin. These descendants of premodern outcast hereditary occupational groups, such as butchers, leatherworkers, funeral directors, and certain entertainers, may be considered a Japanese analog of India's Dalits. Discrimination against these occupational groups arose historically because of Buddhist prohibitions against killing and Shinto notions of pollution, as well as governmental attempts at social control.
During the Tokugawa period, such people were required to live in special buraku and, like the rest of the population, were bound by sumptuary laws based on the inheritance of social class. The Meiji government abolished most derogatory names applied to these discriminated communities in 1871, but the new laws had little effect on the social discrimination faced by the former outcasts and their descendants. The laws, however, did eliminate the economic monopoly they had over certain occupations. The buraku continue to be treated as social outcasts and some casual interactions with the majority caste was perceived taboo until the era after World War II.
Although members of these discriminated communities are physically indistinguishable from other Japanese, they often live in urban ghettoes or in the traditional special hamlets in rural areas. Some attempt to pass as ordinary Japanese, but the checks on family background that are often part of marriage arrangements and employment applications make this difficult. Estimates of their number range from 2 million to 4 million, or about 2% to 3% of the national population.
Non-Burakumin Japanese claimed that membership in these discriminated communities can be surmised from the location of the family home, occupation, dialect, or mannerisms and, despite legal equality, continued to discriminate against people they surmised to be members of this group. Past and current discrimination has resulted in lower educational attainment and socioeconomic status among hisabetsu buraku than among the majority of Japanese. Movements with objectives ranging from "liberation" to encouraging integration have tried to change this situation.
Ryukyuans
The second largest minority group among Japanese citizens is the Ryukyuan people. They are primarily distinguished from their use of several distinct Ryukyuan languages though use of Ryukyuan is dying out. The Ryukyuan people and language originated in the Ryukyu Islands, which are in Okinawa prefecture. Though similar to Japanese culture in many ways, the Ryukyuan culture has had a much larger influence from China than other parts of Japan, due to its geographical position in relation to the east coast of China and the island of Taiwan.[citation needed]
Ainu
The third largest minority group among Japanese citizens is the Ainu whose language is an isolate. Historically, the Ainu were an indigenous hunting and gathering population who occupied most of northern Honshū as late as the Nara period (A.D. 710–94). As Japanese settlement expanded, the Ainu were pushed northward, by the Tokugawa Shogunate, the Ainu were pushed into the island of Hokkaido.[22] Characterized as remnants of a primitive circumpolar culture, the fewer than 20,000 Ainu in 1990 were considered racially distinct and thus not fully Japanese. Disease and a low birth rate had severely diminished their numbers over the past two centuries, and intermarriage had brought about an almost completely mixed population.
Although no longer in daily use, the Ainu language is preserved in epics, songs, and stories transmitted orally over succeeding generations. Distinctive rhythmic music and dances and some Ainu festivals and crafts are preserved, but mainly in order to take advantage of tourism.
Foreign residents
 Transition of Numbers of Registered Foreigners in Japan from 5 Major CountriesSee also: Koreans in Japan, Chinese people in Japan, Filipinos in Japan, Americans in Japan, Mongolians in Japan, Indians in Japan, Iranians in Japan, Russians in Japan, Pakistanis in Japan, Bangladeshis in Japan, Turks in Japan, Vietnamese people in Japan, Indonesians in Japan, Japanese Peruvian, and Japanese Brazilian—
Error: Too many links specified (maximum is 15)In 2005, there were 1,555,505 foreign residents permanently residing in Japan, representing 1.22% of the Japanese population.[23] Foreign Army personnel, of which there have been up 430000 from the US and 40000 BCOF in the immediate post-war years, are not included in the Japanese statistics of foreigners, nor is such personnel subject to local immigration controls. Particularly the US bases and the culture transmitted through them had a significant influence on Japanese fashions.[24]
Most Koreans in Japan today have never been to the Korean Peninsula and do not speak Korean. A significant portion of these foreign residents are the descendants of Korean and Chinese forced laborers, a limited number of whom hold a special residence status, granted under the terms of the Normalisation Treaty (22. June 1965) between South Korea and Japan.[25] In many cases special residents, despite being born in Japan and only speaking Japanese, have chosen not to take advantage of Japan's mostly automatic granting of citizenship to special resident applicants.[26] Beginning in 1947 the Japanese government started a programme of ethnic cleansing of Koreans and Formosans, who were Japanese subjects. In particular, refugees from the massacres conducted by the Korean forces in what is termed the Jeju Uprising, were treated as "smugglers" and frequently forcibly returned to Korea. When the Treaty of San Francisco came into force all ethnic Koreans lost their Japanese citizenship and with it the right to welfare grants, to hold a government job of any kind or to attend Japanese schools.[24] In the following year the government contrived, with the help of the Red Cross, a scheme to "repatriate" Korean residents, who mainly were from the Southern Provinces, to their "home" of North Korea.[27] Between 1959 and 1984 93430 people used this route. 6737 were Japanese or Chinese dependents. Most of these departures - 78276 - occurred before 1962.[28]
All non-Japanese without special residential status (people whose residential roots go back to before WWII) are required by law to register with the government and carry alien registration cards. From the early 1980s, a civil disobedience movement encouraged refusal of the fingerprinting that accompanied registration every five years. Opponents of fingerprinting argued that it was discriminatory because the only Japanese who were fingerprinted were criminals. The courts upheld fingerprinting, but the law was changed so that fingerprinting was done once rather than with each renewal of the registration, which until a law reform in 1989 was usually required every six months for anybody from the age of 16. Those refusing fingerprinting were denied re-entry permits, thus depriving them from freedom of movement.
A large number of foreigners left Japan in 2011 during the Fukushima nuclear incident.[citation needed]
Koseki
Japanese citizens are recorded in koseki (family registry) and jūminhyō (resident registry) systems, while foreign residents are only recorded in a separate alien registration system.
Foreigner-reporting website and hotline
The Japanese Ministry of Justice maintains a website and hotline (English reference) for "receiving report on [sic] illegal stay foreigner." The criteria for reporting include "feeling anxious about a foreigner," and anonymous submissions are permitted. Japanese immigration authorities work in unison with police to investigate those reported, and human rights groups such as Amnesty International have argued that those reported do not receive proper legal protection. The Daiyo Kangoku system allows police to detain suspects without charges, access to legal counsel or telephone calls for up to 23 days. In October 2006, the foreigner reporting hotline's operating hours were extended to include Saturday, Sunday and national holidays.
Fingerprinting foreigners when entering Japan
As of November 20, 2007, all foreigners entering Japan must be biometrically registered (photograph and fingerprints) on arrival; this includes people living in Japan on visas as well as permanent residents, but excludes people with special permanent resident permission, diplomats, and those under 16.[30][31]
- Immigration Control 2006, the Immigration Bureau, the Ministry of Justice (Japan), 2006.
- 平成19年版「出入国管理」の発刊について (Publication of Immigration Control 2007), 法務省入国管理局, 2007-9-21.
Family and sex
According to a government survey, more than a quarter of unmarried men and women between the ages of 30 and 34 are virgins. 50% of men and women in Japan said they were not “going out with anybody”.[32]
Demographic statistics
The following demographic statistics are from the CIA World Factbook, unless otherwise indicated.
Population
Population in 47,062,743 households, 78.7% in urban areas (July 2000). High population density; 329.5 persons per square kilometer for total area; 1,523 persons per square kilometer for habitable land. More than 50% of population lives on 2% of land. (July 1993)
 Changes in the Population of Japan
Year Population (July est.) Growth rate (est.) 2010 126,804,433 −0.22% 2009 127,078,679 −0.17% 2008 127,288,416 −0.11% 2007 127,433,494 −0.02% 2006 127,463,611 +0.04% 2005 127,417,244 +0.07% 2004 127,333,002 +0.09% 2003 127,214,499 +0.19% 2002 126,974,628 N/A Source: CIA Factbooks 2000-2010.
Year Birth rate (est.): births/1000 pop. Death rate (est.): deaths/1000 pop. Net migration rate (est.): migrants/1000 pop. 2010 7.41 9.83 N/A 2009 7.64 9.54 N/A 2008 7.87 9.26 N/A 2007 8.10 8.98 0 2006 8.37 8.92 N/A 2005 9.47 8.95 N/A 2004 9.56 8.75 N/A 2003 9.61 8.55 N/A 2002 2001 2000 9.96 8.15 N/A 1930s,
first half31.7[33] Source: CIA Factbooks 2000–2010.
Age structure
Year 0–14 years:
(male)0–14 years:
(female)0–14 years:
(% total)15–64 years
(male):15–64 years
(female):15–64 years
(% total):65 years & over
(male):65 years & over
(female):65 years & over
(% total):2010 8,665,440 8,212,680 13.3% 40,969,829 40,291,648 64.1% 12,163,028 16,501,808 22.6% 2009 8,804,465 8,344,800 13.5% 41,187,425 40,533,876 64.3% 11,964,694 16,243, 419 22.2% 2007 9,024,344 8,553,700 13.8% 41,841,760 41,253,968 65.2% 11,312,492 15,447,230 21% Aging of Japan
Like other postindustrial countries, Japan faces the benefits as well as potential drawbacks associated with an aging population. While countries with young populations may wrestle with problems of crime, poverty, and social unrest, countries with older populations often enjoy higher standards of living. However, the demographic shift in Japan's age profile has triggered concerns about the nation's economic future and the viability of its welfare state.[34] In 1989, only 11.6% of the population was 65 years or older, but by 2007, that figure had risen to 21.2%, making Japan one of the "greyest" countries on Earth.[35]
Sex ratio
(2010 est.)
- at birth: 1.056 male(s)/female
- under 15 years: 1.06 male(s)/female
- 15-64 years: 1.02 male(s)/female
- 65 years and over: 0.74 male(s)/female
- total population: 0.95 male(s)/female
(2006 est.)
- at birth: 1.05 male(s)/female
- under 15 years: 1.05 male(s)/female
- 15–64 years: 1.01 male(s)/female
- 65 years and over: 0.73 male(s)/female
- total population: 0.95 male(s)/female
Infant mortality rate
(2010 est.)
- total: 2.79 deaths/1,000 live births
- male: 2.98 deaths/1,000 live births
- female: 2.58 deaths/1,000 live births
(2006 est.)
- total: 3.24 deaths/1, 000 live births
- male: 3.5 deaths/1, 000 live births
- female: 2.97 deaths/1, 000 live births
Life expectancy at birth
(2010 est.)
- total population: 82.17 years
- male: 78.87 years
- female: 85.66 years
(2006 est.)
- total population: 81.25 years
- male: 77.96 years
- female: 84.7 years
Total fertility rate
- 1.39 children born/woman (2010)[36]
- 1.37 children born/woman (2009)[37][38]
- 1.37 children born/woman (2008)[39]
- 1.34 children born/woman (2007)[40]
- 1.26 children born/woman (2005)[41]
HIV/AIDS — adult prevalence rate
- less than 0.1% (2003 est.)
HIV/AIDS — people living with HIV/AIDS
- 9,600 (2007 est.)
- 12, 000 (2003 est.)
HIV/AIDS — deaths
- fewer than 100 (2007 est.)
- 500 (2003 est.)
Nationality
- noun: Japanese person
- adjective: Japanese
Ethnic groups
98.5% Japanese and 1.5% other.[42] The concept of the ethnic groups by the Japanese statistics is different from the ethnicity census of North American, Australasian, Brazilian or some Western European statistics. For example, the United Kingdom Census asks ethnic or racial background which composites the population of the United Kingdom, regardless of their nationalities. The Japanese Statistics Bureau, however, does not have this question yet. Since the Japanese population census asks the people's nationality rather than their ethnic background, naturalized Japanese citizens and Japanese nationals with multi-ethnic background are considered to be ethnically Japanese in the population census of Japan.[9] Thus, in spite of the widespread belief that Japan is ethnically homogeneous, it is probably more accurate to describe it as a multiethnic society.[43]
Foreign citizens
More than 2.5 million (possibly higher because of the illegal immigrants), 14.9% up in five years. North and South Koreans 1 million, Chinese 0.6 million, Filipinos 0.5 million, Brazilians 250,000 and Peruvians 200,000. Other nationalities (examples): Americans, Canadians, Australians, British, Indonesians, Thais, Africans, Iranians, Russians, Turks, Indians and others.
Marital status
- Over 15: Married Male 61.8%, Female 58.2%. Never married Male 31.8%, Female 23.7%.
- 25 – 29: Never married Male 69.3%, Female 54.0%.
- 30 – 34: Never married Male 42.9%, Female 26.6% (July 2000).
Religion
Shintō and Buddhism are Japan's two major religions. They have co-existed for several centuries and have even complemented each other to a certain degree. Most Japanese people generally do not exclusively identify themselves as adherents of only one religion, but rather incorporate various elements in a syncretic fashion.[44] There are small Christian and Muslim minorities.
Net migration rate
- 0 migrant(s)/1, 000 population (2006 est.)
Language
See also
- Demographics of Japan before Meiji Restoration
- Demographics of Imperial Japan
- Ethnic issues in Japan
- Elderly people in Japan
- Japanese people
- Aging of Japan
- Suicide in Japan
- Shimojō, Nagano, a village whose birthrate is increasing.
References
- ^ Internal Affairs and Communications Ministry, August 11, 2009 cited in The Daily Yomiuri, August 13, 2009
- ^ CIA - The World Factbook - Rank Order - Life expectancy at birth
- ^ According to data provided by the Internal Affairs and Communications Ministry, August 11, 2009, cited in The Daily Yomiuri, August 14, 2009
- ^ Japan Statistics Bureau - Population Census
- ^ "Population Census 2010". Ministry of Internal Affairs and Communications. 2010. http://www.stat.go.jp/data/kokusei/2010/special/english/index.htm.
- ^ Embassy taps help of Pinoy groups in Japan. Japan. March 12, 2011. http://www.abs-cbnnews.com/global-filipino/03/12/11/embassy-taps-help-pinoy-groups-japan/.
- ^ John Lie, Multiethnic Japan (Cambridge, Mass.: Harvard University Press, 2001) ISBN 0-674-01358-1
- ^ http://www.mhlw.go.jp/topics/bukyoku/seisaku/syousika/1022-1.html
- ^ a b c d 平成20年末現在における外国人登録者統計について(Number of Foreign residents in Japan)
- ^ Japan Immigration,Alien Registration,One-Stop Solution for Corporates and individuals for Immigration procedures
- ^ http://www.japantoday.com/category/national/view/no-of-foreign-residents-in-japan-falls-for-2nd-straight-year-in-2010
- ^ 帰化許可申請者数等の推移
- ^ "United Kingdom population by ethnic group". United Kingdom Census 2001. Office for National Statistics. 2001-04-01. http://www.statistics.gov.uk/StatBase/Expodata/Spreadsheets/D6588.xls. Retrieved 2009-09-10.
- ^ John Lie Multiethnic Japan (Cambridge, Mass.: Harvard University Press, 2001)
- ^ Ranks of Happiness in Nations in the 1990s
- ^ nation
- ^ NationMaster - Life satisfaction (most recent) by country
- ^ A Global Projection of Subjective Well-being: A Challenge to Positive Psychology?
- ^ NationMaster - Financial satisfaction (most recent) by country
- ^ Mental Health, WHO 2003
- ^ BBC News: Suicides cost Japan economy $32bn
- ^ Shinichiro, Takakura (1960). The Ainu of Northen Japan: A Study in Conquest and Acculturation. Independence Square: The American Philosphical Society. pp. 24–25.
- ^ Statistical Data in Japan
- ^ a b Morris-Suzuki, Tessa; Borderline Japan: foreigners and frontier controls in the post-war era; Cambridge 2010; ISBN 978-0-521-86460-2, Ch. 1: "Border Politics," Ch. 8: "A point of no return"
- ^ Morris-Suzuki (2010), p. 230
- ^ HAN: "Koreans in Japan: Past and Present"
- ^ Agreement signed in Calcutta, brokered by the ICRC. Morris-Suzuki (2010), p. 208
- ^ detailed in: Morris-Suzuki, Tessa; Exodus to North Korea: shadows from Japan's cold war; Lanham, Md. 2006; ISBN 978-0-7425-5441-2
- ^ Japan Statistics Bureau, accessed 8 December 2007
- ^ Chris Hogg Japan ups checks for foreigners, BBC News, 20 November 2007.
- ^ The Immigration Bureau introduced new immigration procedures on November 20th, 2007., Immigration Bureau, Ministry of Justice (Japan).
- ^ Love in 2- // The New York Times, July 21, 2009
- ^ Ruth Benedict: Chrysantheme und Schwert. Formen der japanischen Kultur., translated by Jobst-Mathias Spannagel. page 223. Suhrkamp Verlag. edition suhrkamp. January 2008. First edition published 2006. Original edition published 1946. ISBN 978-3-518-12014-9
- ^ Hashimoto, Ryutaro (attributed). General Principles Concerning Measures for the Aging Society. Ministry of Foreign Affairs of Japan. Retrieved 2011-3-5.
- ^ McCurry, Justin (17 April 2007). "Japan's age-old problem". The Guardian (UK). http://www.guardian.co.uk/world/2007/apr/17/japan.justinmccurry. Retrieved 2 January 2011.
- ^ http://www.japantoday.com/search?q=japan+fertility+2010
- ^ Japan's 2009 birthrate unchanged at 1.37. Japan Today via Kyodo News. 02 June 2010. Retrieved 2011-3-5.
- ^ http://www.japantoday.com/search?q=japan+birthrate+2009
- ^ http://www.japantoday.com/search?q=japan+fertility+2008
- ^ http://www.japantoday.com/search?q=japan+fertility++2007
- ^ http://www.japantoday.com/search?q=japan+fertility+1.26+in+2005
- ^ CIA Factbook: Japan
- ^ John Lie Multiethnic Japan (Cambridge, Mass.: Harvard University Press, 2001)
- ^ Edwin O. Reischauer The Japanese Today: Change and Continuity; Cambridge, Massachusetts: Belknap Press of Harvard University Press (1988), pg. 215.
 This article incorporates public domain material from websites or documents of the Library of Congress Country Studies. — Japan
- United Nations World Population Prospects (2004 revision). Data is for 2005.
External links
- Japan Population Census 2010
- The Dilemma Posed by Japan's Population Decline, discussion paper by Julian Chapple in the electronic journal of contemporary japanese studies, 18 October 2004.
- The Exodus to North Korea Museum (commemorates the story of the 93,340 people who migrated from Japan to North Korea in the period 1959-1984)
- Another Tsunami Warning: Caring for Japan’s Elderly, Brief on what the future of Japan looks like for an increasingly aging population, and if this demographic transition is limited to Japan alone.
- Morita, Kiriro and Saskia Sassen. "The New Illegal Immigration in Japan, 1980-1992." International Migration Review, Vol. 28, No. 1 (Spring, 1994), pp. 153-163
Immigration to Japan Americas Asia Bangladeshis · Burmese · Chinese · Filipinos · Indians · Indonesians · Iranians · Koreans · Mongolians · Nepalis · Pakistanis · Taiwanese · VietnameseOthers See also Dekasegi · Ethnic issues in Japan · Gaijin · Japanese nationality law · Foreign-born Japanese · FushūgakuDemographics of Asia Sovereign
states- Afghanistan
- Armenia
- Azerbaijan
- Bahrain
- Bangladesh
- Bhutan
- Brunei
- Burma (Myanmar)
- Cambodia
- People's Republic of China
- Cyprus
- East Timor (Timor-Leste)
- Egypt
- Georgia
- India
- Indonesia
- Iran
- Iraq
- Israel
- Japan
- Jordan
- Kazakhstan
- North Korea
- South Korea
- Kuwait
- Kyrgyzstan
- Laos
- Lebanon
- Malaysia
- Maldives
- Mongolia
- Nepal
- Oman
- Pakistan
- Philippines
- Qatar
- Russia
- Saudi Arabia
- Singapore
- Sri Lanka
- Syria
- Tajikistan
- Thailand
- Turkey
- Turkmenistan
- United Arab Emirates
- Uzbekistan
- Vietnam
- Yemen
States with limited
recognitionDependencies and
other territories- Christmas Island
- Cocos (Keeling) Islands
- Hong Kong
- Macau
Categories:


Wikimedia Foundation. 2010.