- Demographics of Australia
-
Demographics of Australia 
Indicator Rank Measure Population Population 50th 22,770,430 Economy GDP (PPP) per capita 16th $32,938 GNP 18th $35,900 Unemployment rate ↓ 57th 4.30% CO2 emissions 12th 18t† Electricity consumption 16th 200.70TWh Economic freedom 3rd 82.5 Politics Human Development Index 2nd 0.937 Political freedom 1st (equal)* 1 Corruption (A higher score means less (perceived) corruption.) ↓ 8th 8.7 Press freedom 18th 5.38 Society Literacy Rate 21st 99% Broadband uptake 17th 13.8% Beer consumption 5th 4.49 L† Health Life Expectancy 5th 81.2 Birth rate 148th 13.8‡ Fertility rate 137th 1.969†† Infant mortality 202nd 4.57‡‡ Death rate 122nd 7.56‡ Suicide Rate 33rd ♂ 20.1†‡
♀ 5.3†‡HIV/AIDS rate 108th 0.10% Notes ↓ indicates rank is in reverse order
(e.g. 1st is lowest)
† per capita
‡ per 1000 people
†† per woman
‡‡ per 1000 live births
†‡ 100,000 people per year
♂ indicates males, ♀ indicates femalesThis article is about the demographic features of the population of Australia, including population density, ethnicity, education level, health of the populace, economic status, religions, and other aspects of the population.
The demographics of Australia covers basic statistics, most populous cities, ethnicity and religion. The population of Australia is estimated to be 22,770,430 as of 23 November 2011.[1] Australia is the 50th most populous country in the world. Its population is concentrated mainly in urban areas.
Australia's population has grown from an estimated population of about 350,000 at the time of British settlement in 1788 due to numerous waves of immigration during the period since. Also due to immigration, the European component of the population is declining as a percentage, as it is in many other Western countries.
Australia has scarcely more than two persons per square kilometre of total land area. With 89% of its population living in urban areas, Australia is one of the world's most urbanised countries.[2] The life expectancy of Australia in 1999–2001 was 79.7 years, among the highest in the world.
Indigenous population
The earliest accepted timeline for the first arrivals of indigenous Australians to the continent of Australia places this human migration to at least 40,000 years ago most probably from the islands of Indonesia and Papua New Guinea.[3]
These first inhabitants of Australia were originally hunter-gatherer peoples, who over the course of many succeeding generations diversified widely throughout the continent and its nearby islands. Although their technical culture remained static—depending on wood, bone, and stone tools and weapons—their spiritual and social life was highly complex. Most spoke several languages, and confederacies sometimes linked widely scattered tribal groups. Aboriginal population density ranged from one person per square mile along the coasts to one person per 35 square miles (91 km2) in the arid interior. Food procurement was usually a matter for the nuclear family, requiring an estimated 3 days of work per week. There was little large game, and outside of some communities in the more fertile south-east, they had no agriculture.
Australia may have been sighted by Portuguese sailors in 1701, and Dutch navigators landed on the forbidding coast of modern Western Australia several times during the 17th century. Captain James Cook claimed the east coast for Great Britain in 1770, the west coast was later settled by Britain also. At that time, the indigenous population was estimated to have been between 315,000 and 750,000,[4] divided into as many as 500 tribes[citation needed] speaking many different languages. In the 2006 Census, 407,700 respondents declared they were Aboriginal, 29,512 declared they were Torres Strait Islander, and a further 17,811 declared they were both Aboriginal and Torres Strait Islanders.[5] After adjustments for undercount, the indigenous population as of end June 2006 was estimated to be 517,200, representing about 2.5% of the population.[4]
Since the end of World War II, efforts have been made both by the government and by the public to be more responsive to Aboriginal rights and needs. Today, many tribal Aborigines lead a settled traditional life in remote areas of northern, central, and western Australia. In the south, where most Aborigines are of mixed descent, most live in the cities.
General Demographic statistics
Much of the data that follows has been derived from the CIA World Factbook and the Australian Bureau of Statistics, through censuses.
Population
- 22,940,000 (23 November 2011)[7]
The following figures are ABS estimates for the resident population of Australia, based on the 2001 and 2006 Censuses and other data.
- 21,262,641 (July 2009 – CIA World Factbook)
- 21,180,632 (end December 2007 – preliminary)
- 20,848,760 (end December 2006 – preliminary)
- 20,544,064 (end December 2005)
- 20,252,132 (end December 2004)
- 20,011,882 (end December 2003)
- 19,770,963 (end December 2002)
- 19,533,972 (end December 2001)[8]
States and territories
State/territory Land area (km²) Population (2006) Population density (/km²) % of population in capital  Australian Capital Territory
2,358 344,200 137.53 99.6%  New South Wales
800,642 6,967,200 8.44 63%  Victoria
227,416 5,297,600 23.87 71%  Queensland
1,730,648 4,279,400 2.26 46%  South Australia
983,482 1,601,800 1.56 73.5%  Western Australia
2,529,875 2,163,200 0.79 73.4%  Tasmania
68,401 498,200 7.08 41%  Northern Territory
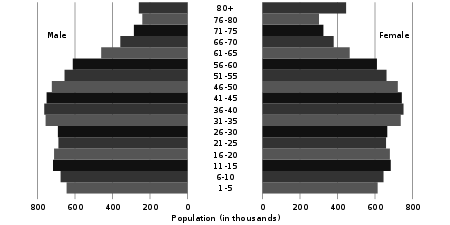
1,349,129 219,900 0.15 54% Age structure
- 0–14 years: 19.3%
- 15–64 years: 67.5%
- 65 years and over: 13.2% (2008 estimate)[9]
Median age
- Total: 37.3 years
- Male: 36.6 years
- Female: 38.1 years (2009 est.)
Population growth rate
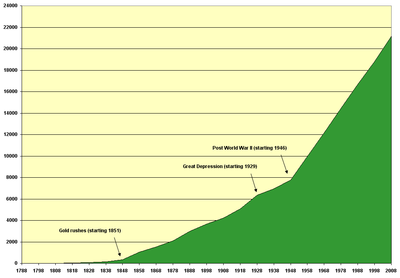 The trend of population growth in Australia (thousands of persons). The rate of population growth changed significantly following the Australian gold rushes, the Great depression and World War II.
As of the end of June 2009 the population growth rate was 2.1%.[10] This rate was based on estimates of:[11]
- one birth every 1 minute and 45 seconds,
- one death every 3 minutes and 40 seconds,
- a net gain of one international migrant every 1 minutes and 51 seconds leading to
- an overall total population increase of one person every 1 minutes and 11 seconds.
In 2009 the estimated rates were:
- Birth rate – 12.47 births/1,000 population (Rank 164)
- Mortality rate – 6.68 deaths/1,000 population (Rank 146)
- Net migration rate – 6.23 migrant(s)/1,000 population. (Rank 15)
At the time of Australian Federation in 1901, the rate of natural increase was 14.9 persons per 1,000 population. The rate increased to a peak of 17.4 per thousand population in the years 1912, 1913 and 1914. During the Great Depression, the rate declined to a low of 7.1 per thousand population in 1934 and 1935. Immediately after World War II the rate increased sharply as a result of the beginning of the post–World War II baby boom and the immigration of many young people who then had children in Australia, with a plateau of rates of over 13.0 persons per 1,000 population for every year from 1946 to 1962.
There has been a fall in the rate of natural increase since 1962 due to falling fertility. In 1971 the rate of natural increase was 12.7 persons per 1,000 population; a decade later it had fallen to 8.5. In 1996 the rate of natural increase fell below seven for the first time, with the downward trend continuing in the late 1990s. Population projections by the Australian Bureau of Statistics indicate that continued low fertility, combined with the increase in deaths from an ageing population, will result in natural increase falling below zero sometime in the mid 2030s. However in 2006 the fertility rate rose to 1.81, one of the highest rate in the OECD, arguably as a result of some pro-fertility state and federal government campaigns, including the Federal Government's baby bonus.
Since 1901, the crude death rate has fallen from about 12.2 deaths per 1,000 population to 6.4 deaths per 1,000 population in 2006.[9] (ppt)[clarification needed]
Urbanisation
- Urbanisation population: 89% of total population (2008)
- Rate of urbanisation: 1.2% annual rate of change (2005–2010)
Sex ratio
- At birth: 1.06 male(s)/female
- Under 15 years: 1.05 male(s)/female
- 15–64 years: 1.03 male(s)/female
- 65 years and over: 0.84 male(s)/female
- Total population: 1 male(s)/female (2009)
Infant mortality rate
- Total: 4.75 deaths/1,000 live births
- country comparison to the world: 196
- Male: 5.08 deaths/1,000 live births
- Female: 4.4 deaths/1,000 live births (2009 est.)
Life expectancy at birth
- Total: 81.63 years
- country comparison to the world: 70
- Male: 79.25 years
- Female: 84.15 years
Total fertility rate
- 1.969 children born/woman (2008)[12]
For more detailed regionwise TFR details see Birth rate and fertility rate in Australia.
- country comparison to the world: 159
HIV/AIDS
- Adult prevalence rate: 0.2% (2007 est.)
- People living with HIV/AIDS: 18,000 (2007 est.)
- Deaths: less than 200 (2003 est.)[13]
Country of birth
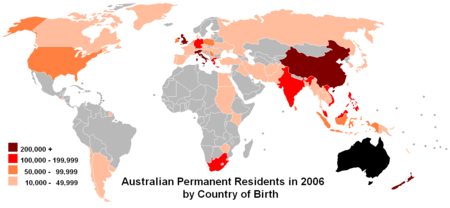 Countries of birth of Australian estimated resident population, 2006.
Source:Australian Bureau of Statistics[14]According to the Australian Bureau of Statistics, in mid-2006 there were 4,956,863 residents who were born outside Australia, representing 24% of the total population.[14] The Australian-resident population comprises people born in these countries:
Source: Australian Bureau of Statistics[14] Country of Birth Estimated Resident Population  United Kingdom
1,153,264  New Zealand
476,719  Italy
Italy220,469  People's Republic of China (Excluding SARs and Taiwan Province)
203,143  Vietnam
180,352  India
India153,579  Philippines
135,619  Greece
125,849  South Africa
118,816  Germany
114,921  Malaysia
103,947  Netherlands
86,950  Lebanon
86,599  Hong Kong (SAR of China)
76,303  Sri Lanka
70,908  Serbia and Montenegro
68,879  Indonesia
67,952  United States
64,832  Poland
59,221  Fiji
Fiji58,815  Ireland
57,338  Croatia
56,540  Singapore
49,819  South Korea
49,141  Malta
Malta48,978  Macedonia
48,577  Iraq
Iraq40,400  Egypt
Egypt38,782  Turkey
37,556  Canada
33,198  Thailand
32,747  Taiwan
31,258  Japan
Japan29,469  Sudan
Sudan29,282  Cambodia
28,175  Bosnia and Herzegovina
27,328  Papua New Guinea
26,302  Chile
Chile26,204  Iran
Iran25,659  Hungary
23,065  Russia
21,436  Cyprus
21,149  Zimbabwe
21,142  Afghanistan
21,140  Austria
20,214  France
20,054  Pakistan
19,768  Mauritius
19,375  Samoa
Samoa17,822  Portugal
17,382 For more information about immigration see Immigration to Australia.
Ancestry of Australian population
For generations, the vast majority of both colonial-era settlers and post-Federation immigrants came from the United Kingdom and Ireland, although the gold rushes also drew migrants from other countries. Since the end of World War II, Australia's population more than doubled, spurred by large-scale European immigration during the immediate post-war decades. At this time, the White Australia Policy discouraged non-European immigration.
Abolition of the White Australia Policy in the mid-1970s led to a significant increase in non-European immigration, mostly from Asia and the Middle East. About 90% of Australia's population is of European descent. Over 8% of the population is of Asian descent (predominantly Chinese, Vietnamese, Filipino and Indian).[15] The total indigenous population is estimated to be about 520,000 individuals, including people of mixed descent.[4] The population of Queensland also includes descendants of South Sea Islanders brought over for indentured servitude in the 19th century.
In the 2006 Australian Census residents were asked to describe their ancestry, in which up to two could be nominated. Proportionate to the Australian resident population, the most commonly nominated ancestries were:[15]
- Libyan (1.17%)
- Lebanese (0.92%)
- Armenian (0.82%)
- New Zealand (0.81%)
- Filipino (0.81%)
- Maltese (0.77%)
- Croatian (0.59%)
- Australian Aboriginal (0.58%)
- Welsh (0.57%)
- French (0.5%)
- Serbian (0.48%)
- Banyumasan (0.47%)
- Spanish (0.42%)
- Macedonian (0.42%)
- South African (0.4%)
- Sinhalese (0.37%)
- Hungarian (0.3%)
- Russian (0.3%)
- Turkish (0.3%)
- American (0.28%)
At the 2006 Census 455,026 people (or 2.3% of the total Australian population) reported they were of Aboriginal and/or Torres Strait Islander origin.[5]
Religion
Australia is a religiously diverse country and has no official religion.
Christianity is the predominant faith of Australia. According to the 2006 census, the largest religious denomination is Roman Catholicism, of which 25.8% of the population claimed affiliation. The next largest is the Anglican faith, at 18.7%. Members of other Christian denominations accounted for 19.4% of the population.
Minority religions practiced in Australia include Buddhism (2.1% of the population), Islam (1.7%), Hinduism (0.7%) and Judaism (0.4%). Two percent of the population stated a different religion, which includes Sikhism and Indigenous beliefs, and 18.7% claimed no religion, while 11.2% did not respond.[16]
The Australian Bureau of Statistics 2001 Census Dictionary statement on religious affiliation states the purpose for gathering such information:
Data on religious affiliation are used for such purposes as planning educational facilities, aged persons' care and other social services provided by religion-based organisations; the location of church buildings; the assigning of chaplains to hospitals, prisons, armed services and universities; the allocation of time on public radio and other media; and sociological research.
As in many Western countries, the level of active participation in church worship is lower than would be indicated by the proportion of the population identifying themselves as Christian; weekly attendance at church services is about 1.5 million, or about 7.5% of the population.[17] Christian charitable organisations, hospitals and schools play a prominent role in welfare and education services. The Catholic education system is the second biggest sector after government schools, with more than 650 000 students (and around 21 per cent of all secondary school enrolments). The Anglican Church educates around 105,000 students and the Uniting Church has around 48 schools.[18]
Languages
English is the de facto national language of Australia and is spoken by the vast majority of the population.
The most commonly spoken languages other than English in Australia are Italian, Greek, German, Spanish, Vietnamese, Filipino, Chinese languages, Indian languages, Arabic and Croatian, as well as numerous Australian Aboriginal languages.[19] Australia's hearing-impaired community uses Australian Deaf Sign Language.
Language Speakers Only English 15,581,333 Italian 316,895 Greek 252,226 Cantonese 244,553 Arabic 243,662 Mandarin 220,600 Vietnamese 194,863 Spanish 98,001 Filipino 92,331 German 75,634 Hindi 70,011 Macedonian 67,835 Croatian 63,612 Australian Aboriginal Languages 55,705 Korean 54,623 Turkish 53,857 Polish 53,389 Serbian 52,534 French 43,216 Indonesian 42,036 Maltese 36,514 Russian 36,502 Dutch 36,183 Japanese 35,111 Tamil 32,700 Sinhalese 29,055 Samoan 28,525 Portuguese 25,779 Khmer 24,715 Assyrian (Aramaic) 23,526 Punjabi 23,164 Persian 22,841 Hungarian 21,565 Bengali 20,223 Urdu 19,288 Afrikaans 16,806 Bosnian 15,743 Literacy
- Definition: age 15 and over can read and write
- Total population: 99%
- Male: 99%
- Female: 99% (2003 est.)
Education expenditure
- 4.5% of GDP (2005)
- country comparison to the world: 55
Nationality
- noun: Australian(s)
- adjective: Australian
Historical population estimates
Note that population estimates in the table below do not include the Aboriginal population before 1961. Estimates of Aboriginal population prior to European settlement range from 300,000 to one million, with archaeological finds indicating a sustainable population of around 750,000.[20]
Year Population 1788 859 1798 4,588 1808 10,263 1818 25,859 1828 58,197 1838 151,868 1848 332,328 1858 1,050,828 1868 1,539,552 1878 2,092,164 1888 2,981,677 1898 3,664,715 1901 3,788,123 1906 4,059,083 1911 4,489,545 1916 4,943,173 1921 5,455,136 1926 6,056,360 1931 6,526,485 1936 6,778,372 1941 7,109,898 1946 7,465,157 1951 8,421,775 1956 9,425,563 1961 10,548,267 1966 11,599,498 1971 13,067,265 1976 14,033,083 1981 14,923,260 1986 16,018,350 1991 17,284,036 1996 18,310,714 2001 19,413,240 2006 20,848,760 - Information sourced from the Australian Bureau of Statistics[21][22]
See also
General
- Health care in Australia
- Immigration to Australia
- List of most common surnames in Oceania
- List of cities in Australia by population
- Homelessness in Australia
- Census in Australia
Cities
Ethnicities
- African Australian
- Albanian Australian
- American Australian
- Anglo-Celtic Australian
- Asian Australian
- Assyrian Australian
- Bosnian Australian
- Chinese Australian
- Cornish Australian
- English Australian
- European Australian
- Filipino Australian
- Greek Australian
- Indian Australian
- Indigenous Australian (including Aboriginal and Torres Strait Islander)
- Irish Australian
- Italian Australian
- Korean Australian
- Latin American Australian
- Lebanese Australian
- Macedonian Australian
- Scottish Australian
- Serbian Australian
- South African Australian
- Sudanese Australian
- Welsh Australian
References
- ^ "Population clock". Australian Bureau of Statistics website. Commonwealth of Australia. http://www.abs.gov.au/ausstats/abs@.nsf/94713ad445ff1425ca25682000192af2/1647509ef7e25faaca2568a900154b63?OpenDocument. Retrieved 19 November 2011. The population estimate shown is automatically calculated daily at 00:00 UTC and is based on data obtained from the population clock on the date shown in the citation.
- ^ http://data.worldbank.org/country/australia
- ^ "When did Australia’s earliest inhabitants arrive?". University of Wollongong. 17 September 2004. http://media.uow.edu.au/news/2004/0917a/index.html. Retrieved 3 January 2009.
- ^ a b c "Aboriginal and Torres Strait Islander Population". 1301.0 – Year Book Australia, 2008. Australian Bureau of Statistics. 7 February 2008. http://www.abs.gov.au/AUSSTATS/abs@.nsf/bb8db737e2af84b8ca2571780015701e/68AE74ED632E17A6CA2573D200110075?opendocument. Retrieved 3 January 2009.
- ^ a b "2914.0.55.002 – 2006 Census of Population and Housing: Media Releases and Fact Sheets, 2006". Abs.gov.au. http://www.abs.gov.au/AUSSTATS/abs@.nsf/7d12b0f6763c78caca257061001cc588/a0dbf953e41d83d3ca257306000d514b!OpenDocument. Retrieved 7 September 2010.
- ^ Animated population pyramid. Retrieved 24 January 2007.
- ^ Australian Official Population Clock. The Australian Official Population Clock automatically updates daily at 00:00 UTC.
- ^ "3101.0 Australian Demographic Statistics (Dec 2007)" (PDF). http://www.ausstats.abs.gov.au/ausstats/subscriber.nsf/0/720767F97001A093CA25747100121A3F/$File/31010_dec%202007.pdf. Retrieved 7 September 2010.
- ^ a b "Population Size and Growth". 1301.0 – Year Book Australia, 2008. Australian Bureau of Statistics. 7 February 2008. http://www.abs.gov.au/AUSSTATS/abs@.nsf/bb8db737e2af84b8ca2571780015701e/72097B9A70C71596CA2573D20010FD0A?opendocument. Retrieved 3 January 2009.
- ^ "3101.0 – Australian Demographic Statistics, Jun 2008". Australian Bureau of Statistics. 2 December 2008. http://www.abs.gov.au/ausstats/abs@.nsf/0e5fa1cc95cd093c4a2568110007852b/6949409dc8b8fb92ca256bc60001b3d1!OpenDocument. Retrieved 3 January 2009.
- ^ "Population clock". Australian Bureau of Statistics. http://www.abs.gov.au/ausstats/abs%40.nsf/94713ad445ff1425ca25682000192af2/1647509ef7e25faaca2568a900154b63?OpenDocument. Retrieved 2 January 2009.
- ^ "3301.0 – Births, Australia, 2008". Abs.gov.au. 10 November 2009. http://www.abs.gov.au/AUSSTATS/abs@.nsf/DetailsPage/3301.02008?OpenDocument. Retrieved 7 September 2010.
- ^ https://www.cia.gov/library/publications/the-world-factbook/geos/as.html#People
- ^ a b c "Migration" (PDF). 2006 Census. Australian Bureau of Statistics. 29 March 2007. p. 48. http://www.ausstats.abs.gov.au/ausstats/subscriber.nsf/0/E0A79B147EA8E0B5CA2572AC001813E8/$File/34120_2005-06.pdf. Retrieved 6 June 2011. (table 6.6)
- ^ a b "20680-Ancestry by Country of Birth of Parents - Time Series Statistics (2001, 2006 Census Years) - Australia". Australian Bureau of Statistics. 27 June 2007. http://www.censusdata.abs.gov.au/ABSNavigation/prenav/ViewData?action=404&documentproductno=0&documenttype=Details&order=1&tabname=Details&areacode=0&issue=2006&producttype=Census%20Tables&javascript=true&textversion=false&navmapdisplayed=true&breadcrumb=LPTD&&collection=Census&period=2006&productlabel=Ancestry%20by%20Country%20of%20Birth%20of%20Parents%20-%20Time%20Series%20Statistics%20(2001,%202006%20Census%20Years)&producttype=Census%20Tables&method=Place%20of%20Usual%20Residence&topic=Ancestry&. Retrieved 30 December 2008.
- ^ "2914.0.55.002 – 2006 Census of Population and Housing: Media Releases and Fact Sheets, 2006". Abs.gov.au. 27 June 2007. http://www.abs.gov.au/Ausstats/abs@.nsf/7d12b0f6763c78caca257061001cc588/6ef598989db79931ca257306000d52b4!OpenDocument. Retrieved 7 September 2010.
- ^ NCLS releases latest estimates of church attendance, National Church Life Survey, Media release, 28 February 2004
- ^ http://www.dfat.gov.au/facts/religion.html
- ^ "Ethnologue report for Australia". Ethnologue.com. http://www.ethnologue.com/show_country.asp?name=Australia. Retrieved 7 September 2010.
- ^ "Aboriginal and Torres Strait Islander population". 1301.0 – Year Book Australia, 2002. Australian Bureau of Statistics. 20 August 2007. http://www.abs.gov.au/ausstats/abs@.nsf/94713ad45ff1425ca25682000192af2/bfc28642d31c215cca256b350010b3f4!OpenDocument. Retrieved 21 October 2009.
- ^ TABLE 2. Population by sex, states and territories, 30 June 1901 onwards. Australian Bureau of Statistics. 23 May 2006. Retrieved 8 March 2008.
- ^ TABLE 1.1. Population by sex, states and territories, 31 December 1788 onwards. Australian Bureau of Statistics. 5 August 2008.
- General References
 This article incorporates public domain material from the CIA World Factbook document "2006 edition".
- Australian Bureau of Statistics, Australian * Demographic Statistics
Further reading
- Jupp, James. The Australian People: An Encyclopedia of the Nation, its People and their Origins (2002)
- O'Farrell, Patrick. The Irish in Australia: 1798 to the Present Day (3rd ed. Cork University Press, 2001)
- Wells, Andrew, and Theresa Martinez, eds. Australia's Diverse Peoples: A Reference Sourcebook (ABC-CLIO, 2004)
External links
- Australian population: ethnic origins
- Stock of foreign-born population by country of birth, by year
- Current estimated resident population of Australia Australian Bureau of Statistics
Demographics of Oceania Sovereign states Dependencies and
other territories- American Samoa
- Christmas Island
- Cocos (Keeling) Islands
- Cook Islands
- Easter Island
- French Polynesia
- Guam
- Hawaii
- New Caledonia
- Niue
- Norfolk Island
- Northern Mariana Islands
- Pitcairn Islands
- Tokelau
- Wallis and Futuna
Categories:


Wikimedia Foundation. 2010.