- Demographics of Oceania
-
Oceania
Geopolitical OceaniaDemonym Oceanic; Oceanian Area 8,506,427 km2 (3,284,350 sq mi) Population 34,648,283 Countries Dependencies 25- American Samoa
- Ashmore and Cartier Islands
- Baker Island
- Clipperton Island
- Cook Islands
- Coral Sea Islands
- Easter Island
- French Polynesia
- Guam
- Hawaii
- Howland Island
- Jarvis Island
- Johnston Atoll
- Juan Fernández Islands
- Kingman Reef
- Midway Atoll
- New Caledonia
- Niue
- Norfolk Island
- Northern Mariana Islands
- Palmyra Atoll
- Pitcairn Islands
- Tokelau
- Wake Island
- Wallis and Futuna
Languages Time Zones UTC+8 (Australian Western Standard Time) to UTC-6 (Easter Island) (West to East) Largest Cities Sydney
Melbourne
Brisbane
Perth
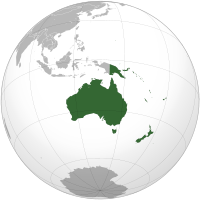
AucklandOceania is a region centered on the islands of the tropical Pacific Ocean.[1] Conceptions of what constitutes Oceania vary, with it being defined in various ways, often geopolitically or geographically. In the geopolitical conception used by the United Nations, International Olympic Committee, and many atlases, the Oceanic region includes Australia and the nations of the Pacific from Papua New Guinea east, but not the Malay Archipelago or Indonesian New Guinea.[2][3][4]. The term is sometimes used more specifically to denote Australasia as a geographic continent,[5][6] or biogeographically as a synonym for either the Australasian ecozone (Wallacea and Australasia) or the Pacific ecozone (Melanesia, Polynesia, and Micronesia apart either from New Zealand[7] or from mainland New Guinea[8]).
Although Christmas Island and the Cocos (Keeling) Islands belong to the Commonwealth of Australia and are inhabited, they are nearer Indonesia than the Australian mainland, and are commonly associated with Asia instead of Oceania.
Contents
Demographics by territory
The demographic table below shows all inhabited states and territories of Oceania. The information in this chart comes from the CIA World Factbook[9] or the United States Department of State[10]m[›], unless noted otherwise or not available (NA); where sources differ, references are included.

Pos Country Population (July 2010 estimate) Area (km2) Population density (/km2) Urban population Life expectancy Literacy Rate Official language(s) Top religion(s) Ethnic groups 1  Australia
21,262,641 7,682,300 2.768 89% 81.63 99% English 78.5% [11] Christian 64.6%, none 18.7% White 92%, Asian 7%, Aborigine and other <1% 2  Papua New Guinea
5,940,775 462,840 12.835 12% 65.75 57.3% Tok Pisin 75%[12], English 1–2%, Hiri Motu <2%a[›] Christian 96% New Guinea Papuan 84%, New Guinea Melanesian 15%, other 1%[13] 3  New Zealand
4,213,418 270,534 15.574 87% 80.36 99% English 91.2%, Maori 3.9% Christian 55.6%, None 34.7% European 56.8%, Asian 8%, Maori 7.4%, Pacific Islander 4.6%, mixed 9.7%, other 13.5% 4  Fiji
Fiji944,720 18,274 51.697 18% 70.73 93.7% English, Fijian, Hindi Christian 64.5%, Hindu 27.9%, Muslim 6.3% Fijian 57.3%, Indian 37.6%, Rotuman 1.2%, other 3.9% 5  Solomon Islands
595,613 28,896 20.612 52% 73.69 76.6%[14] English 1–2%b[›] Christian 95% Melanesian 94.5%, Polynesian 3%, Micronesian 1.2%, other 1.3% –  French Polynesia (France)
287,032 4,167 68.882 52% 76.71 98% French 61.1%, Polynesian 31.4% Protestant 54%, Roman Catholic 30%, other 10%, no religion 6% Polynesian 78%, Chinese 12%, local French 6%, metropolitan French 4% –  New Caledonia (France)
227,436 18,575 12.244 65% 74.98 96.8% French Roman Catholic 60%, Protestant 30%, other 10% Melanesian 44.1%, European 34.1%, Wallisian & Futunian 9%, Tahitian 2.6%, Indonesian 2.5%, Vietnamese 1.4%, Ni-Vanuatu 1.1%, other 5.2% 6  Vanuatu
221,552 12,189 18.176 25% 64.33 74% English 23.1%, French 1.9% Christian 82%, indigenous beliefs 5.6%, other 10.9%, none 1% Ni-Vanuatu 98.5%, other 1.5% 7  Samoa
Samoa192,001 2,831 67.821 23% 72.13 99.7% Samoan Christian 98.9% Samoan 92.6%, Euronesians 7%, Europeans 0.4% –  Guam (United States)
180,865 1,478 122.371 93% 78.18 99% English 38.3%, Chamorro 22.2%[15] Roman Catholic 85% Chamorro 37.1%, Filipino 26.3%, other Pacific islander 11.3%, white 6.9%, other 8.6%, mixed 9.8% 8  Tonga
Tonga122,580 747 164.096 25% 71.03 98.9% Tongan, English Christian Tongan 98% 9  Federated States of Micronesia
107,154 702 152.641 22% 71.23 89% English Roman Catholic 50%, Protestant 47%, others 3% Chuukese 48.8%, Pohnpeian 24.2%, Kosraean 6.2%, Yapese 5.2%, Yap outer islands 4.5%, Asian 1.8%, Polynesian 1.5%, other 7.8% 10  Kiribati
99,482 811 122.666 44% 64.03 92% English, Gilbertese (de facto) Roman Catholic 55%, Protestant 36% Micronesian 98.8% –  American Samoa (United States)
66,432 199 872.005 92% 73.97 97% English, Samoanc[›][16] Christian Congregationalist 50%, Roman Catholic 20%, Protestant and other 30% native Pacific islander 91.6%, Asian 2.8%, white 1.1%, mixed 4.2%, other 0.3% 11  Marshall Islands
65,859 181 363.862 71% 71.48 93.7% Marshallese 98.2%, English Protestant 54.8%, other Christian 40.6% Marshallese 92.1%, mixed Marshallese 5.9%, other 2% –  Northern Mariana Islands (United States)
48,317 464 104.131 91% 76.9 97% English[17] Christian Asian 56.3%, Pacific islander 36.3%, White 1.8%, other 0.8%, mixed 4.8% 12  Palau
Palau20,879 459 45.488 81% 71.51 92% Paluan 64.7%d[›], English Roman Catholic 41.6%, Protestant 23.3% Palauan 69.9%, Filipino 15.3%, Chinese 4.9%, other Asian 2.4%, white 1.9%, Carolinian 1.4%, other Micronesian 1.1%, other 3.2% –  Wallis and Futuna (France)
15,343 142 108.049 0% 78.83 50%e[›] Wallisian 58.9%, Futunian 30.1%, French 10.8% Roman Catholic 99% Polynesian –  Cook Islands (New Zealand)
11,488 236 48.678 74% 74.47 95% Maori, English Cook Islands Christian Church 55.9%, other Christian 30.5% Cook Island Maori 87.7%, part Cook Island Maori 5.8%, other 6.5% 13  Tuvalu
10,472 26 401.615 49% 64.39 93%[18] Tuvalu, English Church of Tuvalu (Congregationalist) 97% Polynesian 96%, Micronesian 4% 14  Nauru
Nauru9,267 21 441.286 100% 64.99 99%[19] Nauruanf[›] Nauru Congregational Church 35.4%, Roman Catholic 33.2%, Nauru Independent Church (Protestant)[20] 10.4% Nauruan 58%, other Pacific Islander 26%, Chinese 8%, European 8% –  Norfolk Island (Australia)
2,155 36 59.861 NA NA NAg[›] English, Norfukh[›] Anglican 31.8%, other Christian 30,9%, none 19.9% European, Tahitian, Australian, New Zealander, Polynesian –  Tokelau (New Zealand)
1,400 12 116.667 0% 69[21] NA Tokelauan, English Congregational Christian Church 70%, Roman Catholic 28%i[›] Polynesian –  Niue (New Zealand)
1,354 260 5.208 39% 69.5[22] NAj[›] Niuean, English Ekalesia Niue (Protestant) 61.1%, other Christian 11%, Latter Day Saints 8.8% Niuean 78.2%, Pacific islander 10.2%, European 4.5%, mixed 3.9%, Asian 0.2%, unspecified 3% –  Pitcairn Islands (United Kingdom)
48 47 1.021 NA NA NAk[›] English, Pitkern Seventh-Day Adventist 100% European, Tahitianl[›] – Total 34,648,283 8,506,427 4.073 71% 77.87 91% – Total minus mainland Australia 13,385,642 824,127 16.242 43% 71.89 78% See also
- Y-DNA haplogroups in Oceanian populations
Notes
^ a: Papua New Guinea has over 860 non-official languages, comprising approximately ten percent of all languages on Earth[23].
^ b: Melanesian pidgin is lingua franca in much of the country, but English remains the official language[24].
^ c: Samoan and English were declared the official languages of American Samoa in June, 2010, via a constitutional amendment to the 1967 Revised Constitution of American Samoa[16].
^ d: Palaun is the official language in all islands except Sonsoral (Sonsoralese and English are official), Tobi (Tobi and English are official), and Angaur (Angaur, Japanese, and English are official).
^ e: Based on a 1969 estimate.
^ f: English, while not an official language, is widely understood, spoken, and used for most government and commercial purposes[25].
^ g: Norfuk was made the second official language of Norfolk Island in 2005[26].
^ h: While no valid literacy data is available, Norfolk Island is assumed to have an adult literacy rate roughly at a par with Australia's literacy rate of 99%[27].
^ i: On Atafu, all Congregational Christian Church of Samoa; on Nukunonu, all Roman Catholic; on Fakaofo, both denominations, with the Congregational Christian Church predominant.
^ j: While no valid literacy data is available, Niue is assumed to have an adult literacy rate of almost 100%[28].
^ k: The Foreign and Commonwealth Office does not hold any statistical information on the literacy rate of the Pitcairn population[29]..
^ l: The residents of the Pitcairn Islands are descendants of the HMS Bounty mutineers[30] and their Tahitian wives.
^ m: Much of the information on these two websites is taken from the censuses of other countries, and are not based on independent US government research. The remaining figures are based on estimates, and have been used only where census information from the nation in question is incomplete, unclear, or nonexistent.
References
- ^ For a history of the term, see Douglas & Ballard (2008) Foreign bodies: Oceania and the science of race 1750–1940
- ^ "United Nations Statistics Division – Countries of Oceania". Millenniumindicators.un.org. http://millenniumindicators.un.org/unsd/methods/m49/m49regin.htm#oceania. Retrieved 2009-04-17.
- ^ Atlas of Canada Web Master (2004-08-17). "The Atlas of Canada – The World – Continents". Atlas.nrcan.gc.ca. http://atlas.nrcan.gc.ca/site/english/maps/reference/international/world/referencemap_image_view. Retrieved 2009-04-17.
- ^ Current IOC members.
- ^ "Encarta Mexico "Oceanía"". Mx.encarta.msn.com. Archived from the original on 2009-11-01. http://www.webcitation.org/query?id=1257053672622272. Retrieved 2009-04-17.
- ^ Lewis, Martin W.; Kären E. Wigen (1997). The Myth of Continents: a Critique of Metageography. Berkeley: University of California Press. p. 32. ISBN 0-520-20742-4, ISBN 0-520-20743-2. "Interestingly enough, the answer [from a scholar who sought to calculate the number of continents] conformed almost precisely to the conventional list: North America, South America, Europe, Asia, Oceania (Australia plus New Zealand), Africa, and Antarctica."
- ^ Udvardy. 1975. A classification of the biogeographical provinces of the world
- ^ Steadman. 2006. Extinction & biogeography of tropical Pacific birds
- ^ CIA World Factbook
- ^ A-Z List of Country and Other Area Pages. State.gov (2006-04-04). Retrieved on 2010-11-12.
- ^ Australia, CIA World Factbook
- ^ Tok Pisin. Hawaii.edu. Retrieved on 2010-11-12.
- ^ Papua New Guinea. Worldstatesmen.org. Retrieved on 2010-11-12.
- ^ Human Development Report 2009 – Adult literacy rate (% aged 15 and above). Hdrstats.undp.org. Retrieved on 2010-11-12.
- ^ Languages of Guam. Ns.gov.gu. Retrieved on 2010-11-12.
- ^ a b Final Draft of 2010 Amendments to the 1967 Revised Constitution of American Samoa. Approved by the 2010 Constitutional Convention, June 21 – July 3, 2010
- ^ DOI Office of Insular Affairs (OIA) – Commonwealth of the Northern Mariana Islands. Doi.gov. Retrieved on 2010-11-12.
- ^ Tuvalu. Talktalk.co.uk. Retrieved on 2010-11-12.
- ^ Nauru. Talktalk.co.uk. Retrieved on 2010-11-12.
- ^ Nauru. Travelblog.org. Retrieved on 2010-11-12.
- ^ Pacific – Tokelau Information Bulletin – NZ Ministry of Foreign Affairs and Trade. Mfat.govt.nz (2010-09-27). Retrieved on 2010-11-12.
- ^ Niue. Globaleducation.edna.edu.au (2009-04-02). Retrieved on 2010-11-12.
- ^ Papua New Guinea, CIA World Factbook
- ^ Solomon Islands, CIA World Factbook
- ^ Nauru, CIA World Factbook
- ^ "Norfuk declared official language in Norfolk Island - report". Radio New Zealand International. April 20, 2005. http://www.rnzi.com/pages/news.php?op=read&id=16223. Retrieved September 27, 2011.
- ^ Norfolk Island History and Facts in Brief. Erwin.bernhardt.net.nz. Retrieved on 2010-11-12.
- ^ Niue: Report: Part II: Analytic Sections: cont. 1. Unesco.org. Retrieved on 2010-11-12.
- ^ House of Commons Hansard Written Answers for 05 Jan 2010 (pt 0051). Publications.parliament.uk. Retrieved on 2010-11-12.
- ^ Pitcairn Islands, CIA World Factbook
Demographics of Oceania Sovereign states Dependencies and
other territories- American Samoa
- Christmas Island
- Cocos (Keeling) Islands
- Cook Islands
- Easter Island
- French Polynesia
- Guam
- Hawaii
- New Caledonia
- Niue
- Norfolk Island
- Northern Mariana Islands
- Pitcairn Islands
- Tokelau
- Wallis and Futuna
- Africa
- Antarctica
- Asia
- Europe
- North America
- Oceania
- South America
Categories:


Wikimedia Foundation. 2010.