- Demographics of the world
-
This article is about the demographic features of the population of the World, including population density, ethnicity, education level, health of the populace, economic status, religious affiliations and other aspects of the population.
According to the 2011 U.S. Census Bureau, the total population of the World was 6,976,449,600.[1]
Its overall population density is 50 people per km² (129.28 per sq. mile), without including Antarctica. Nearly two-thirds of the population lives in Asia and is predominantly urban and suburban, with about 1.3 billion in the country of China. The World's relatively low literacy rate (83.7%) is attributable to impoverished regions. extremely low literacy rates are concentrated in three regions, the Arab states, South and West Asia, and Sub-Saharan Africa. Christianity, Islam, Hinduism and Buddhism are the four largest religions encompassing a little over 75% of the populace.
The World's largest ethnic group is Han Chinese. Although English (4.83%) is spoken by many as a second language, Mandarin Chinese (12.44%) and Spanish (4.85%) are the languages with the highest number of speakers.
Human migration has been shifting toward cities and urban centers, with the urban population jumping from 29% in 1950, to 50.5% in 2005.[2] Working backwards from the United Nations prediction that the world will be 51.3 percent urban by 2010, Dr. Ron Wimberley, Dr. Libby Morris and Dr. Gregory Fulkerson estimated May 23, 2007 to be the first time the urban population outnumbered the rural population in history. [3] China and India are the most populous countries,[4] as the birth rate has consistently dropped in developed countries and until recently remained high in developing countries. Tokyo is the largest urban conglomeration in the world.[2] [5]
The total fertility rate of the World is estimated as 2.52 children per woman, which is above the replacement fertility rate of approximately 2.1. However, world population growth is unevenly distributed, going from .91 in Macau, to 7.68 in Niger. The United Nations estimated an annual population increase of 1.14% for the year of 2000.[6]
There are approximately 3.38 billion females in the World. The number of males is about 3.41 billion. People under 14 years of age made up over a quarter of the world population (26.3%), and people age 65 and over made up less than one-tenth (7.9%) in 2011.[2]
The world population growth is approximately 1.09%[2]
The world population more than tripled during the 20th century from about 1.65 billion in 1900 to 5.97 billion in 1999. [7][8][9][10]
It reached the 2 billion mark in 1927, the 3 billion mark in 1960, 4 billion in 1974, and 5 billion in 1987.[11] Currently, population growth is fastest among low wealth, third world countries.[12]
The UN projects a world population of 9.15 billion in 2050, which is a 32.69% increase from 2010 (6.89 billion).[7]
World Population[13][14] Year Million 1500 458 1600 580 1700 682 1750 791 1800 978 1850 1,262 1900 1,650 1950 2,521 1999 5,978 2008 6,707 Demography: Analysis and Synthesis, Four Volume Set: A Treatise in Population Contents
History
Cities
The World has hundreds of major cities spread across 6 continents. Most are in coastal regions.
As of 2005[update], the World had 62 metropolitan areas with a population of over 3,000,000 people each.[15]
As of 2010, about 3 billion Earthicans live in or around urban areas.[2]
The following table shows the populations of the top ten conglomerations.
Rank City Population Country Statistical concept[16] Area (km²)[17] 1 Tokyo 36,669,000  Japan
JapanMetropolitan area[18] 13,500 2 Delhi (National Capital Region) 22,157,000  India
IndiaUrban agglomeration[19] 33,578 3 São Paulo 20,262,000  Brazil
Metropolitan area (região metropolitana) 8,050 4 Mumbai (Bombay) 20,041,000 IndiaUrban agglomeration 1,097[20] 5 Mexico City 19,460,000  Mexico
Metropolitan area (zona metropolitana) 7,815 6 New York–Newark 19,425,000  United States
Urban agglomeration[21] 8,683[22] 7 Shanghai 16,575,000  China
ChinaUrban agglomeration[23] 3,920 8 Kolkata (Calcutta) 15,552,000 IndiaUrban agglomeration 1,026[24] 9 Dhaka 14,648,000  Bangladesh
Metropolitan area (megacity) 1,600 10 Karachi 13,125,000  Pakistan
Urban agglomeration 3,530 Population density
See also: List of countries by population density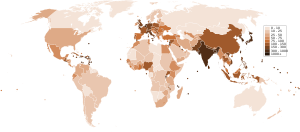 Population density (people per km2) by country, 2006
The world's population is 7 billion,[25] and Earth's total area (including land and water) is 510 million square kilometers (197 million square miles).[26] Therefore the worldwide human population density is 7 billion ÷ 510 million = 13.7 per km² (35.5 per sq. mile). If only the Earth's land area of 150 million km² (58 million sq. miles) is taken into account, then human population density increases to 46.7 per km² (117.2 per sq. mile). This calculation includes all continental and island land area, including Antarctica. If Antarctica is also excluded, then population density rises to 50 people per km² (129.28 per sq. mile).[27] Considering that over half of the Earth's land mass consists of areas inhospitable to human inhabitation, such as deserts and high mountains, and that population tends to cluster around seaports and fresh water sources, this number by itself does not give any meaningful measurement of human population density.
Several of the most densely-populated territories in the world are city-states, microstates, micronations, or dependencies.[28][29] These territories share a relatively small area and a high urbanization level, with an economically specialized city population drawing also on rural resources outside the area, illustrating the difference between high population density and overpopulation.
Population Distribution
Region Number Percentage Asia 4,307,107,875 61.5% Africa 1,037,524,058 14.8% Europe 816,426,346 11.7% North America 544,620,341 7.8% South America 400,067,694 5.7% Australia/Oceania 35,426,995 0.5% Antarctica 1,169 0.00002% Total 308,745,538 100.0% Race and Ethnicity
Main articles: Race (classification of humans) and Lists of ethnic groupsThe world is made up of thousands of ethnic groups. Han Chinese represent about 19% of the global population.[30]
Religion
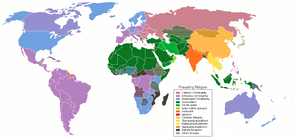 Major denominations and religions of the worldFurther information: List of religious populations
The table below lists religions classified by philosophy; however, religious philosophy is not always the determining factor in local practice. Please note that this table includes heterodox movements as adherents to their larger philosophical category, although this may be disputed by others within that category. For example, Cao Đài is listed because it claims to be a separate category from Buddhism, while Hoa Hao is not, even though they are similar new religious movements.
The population numbers below are computed by a combination of census reports, random surveys (in countries where religion data is not collected in census, for example USA or France), and self-reported attendance numbers, but results can vary widely depending on the way questions are phrased, the definitions of religion used and the bias of the agencies or organizations conducting the survey. Informal or unorganized religions are especially difficult to count. Some organizations may wildly inflate their numbers.
Since the late 19th century, the demographics of religion have changed a great deal. Some countries with a historically large Christian population have experienced a significant decline in the numbers of professed active Christians: see demographics of atheism. Symptoms of the decline in active participation in Christian religious life include declining recruitment for the priesthood and monastic life, as well as diminishing attendance at church. On the other hand, since the 19th century, large areas of sub-saharan Africa have been converted to Christianity, and this area of the world has the highest population growth rate. In the realm of Western civilization, there has been an increase in the number of people who identify themselves as secular humanists. In many countries, such as the People's Republic of China, communist governments have discouraged religion, making it difficult to count the actual number of believers. However, after the collapse of communism in numerous countries of Eastern Europe and the former Soviet Union, religious life has been experiencing resurgence there, both in the form of traditional Eastern Christianity and particularly in the forms of Neopaganism and Far Eastern religions.[citation needed]
Following is some available data based on the work of the World Christian Encyclopedia:[56]
Trends in annual growth of adherence 1970–1985[57] 1990–2000[58][59] 2000–2005[60] 3.65%: Bahá'í Faith 2.65%: Zoroastrianism 1.84%: Islam 2.74%: Islam 2.28%: Bahá'í Faith 1.70%: Bahá'í Faith 2.34%: Hinduism 2.13%: Islam 1.62%: Sikhism 1.67%: Buddhism 1.87%: Sikhism 1.57%: Hinduism 1.64%: Christianity 1.69%: Hinduism 1.32%: Christianity 1.09%: Judaism 1.36%: Christianity 1.09%: Buddhism The annual growth in the world
population over the same period
is 1.41%.Studies conducted by the Pew Research Center have found that, generally, poorer nations had a larger proportion of citizens who found religion to be very important than richer nations, with the exceptions of the United States[61] and Kuwait.[62]
Marriage
The average age of marriage varies greatly from country to country, and has varied through time. Women tend to marry at a younger age than men and currently varies from 17.6 for women in Niger, to 32.4 for women in Denmark While men range from 22.6 in Mozambique to 35.1 in Sweden.[63]
Income
In 2005 the lowest 10% controlled 2.6% of the total world's income, while the top 10% controlled 28%.[2]
Health
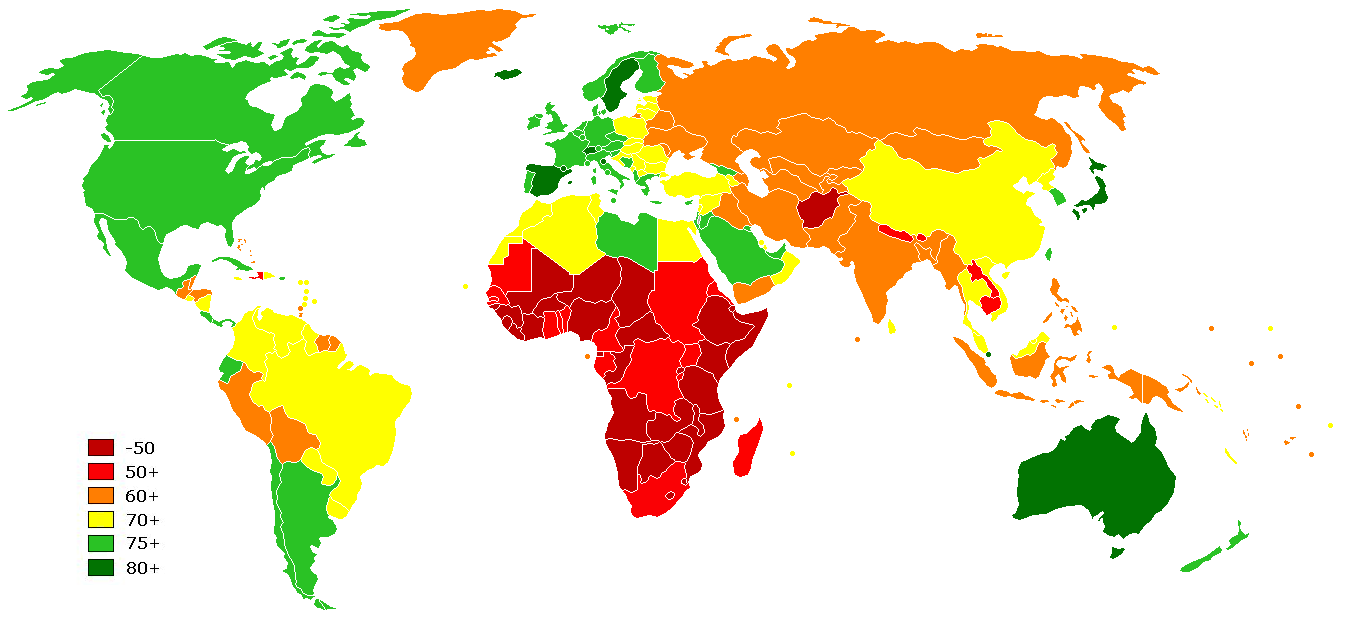
 Life expectancy varies greatly from country to country. It is lowest in Africa and higher in Japan, Australia and Spain.
The average number of hospital beds per 1,000 population is 2.94. Compare to Swizerland (18.3) and Mexico (1.1)[64]
96% of the urban population has access to improved drinking water, while only 78% of rural habitants have improved drinking water. A total average of 87% of urban and rural have access to improved drinking water.
4% of the urban population does not have access to improved drinking water, leaving 22% of rural people without improved drinking water with a total world population of 13% not having access to drinking water.
76% of the urban population has access to sanitation facilities, while only 45% of the rural population has access. A total world average of 39% do not have access to sanitation facilities.
As of 2009, there is an estimated 33.3 million people living with HIV/AIDS which is approximately 0.8% of the world population and there has been an estimated 1.8 million deaths attributed to HIV/AIDS.
As of 2010, 925 million people are undernourished.[65]
Life Expectancy at Birth:
- total population: 67.07 years
- male: 65.21 years
- female: 69.05 years (2011 est.)
Infant Mortality
- total: 41.61 deaths/1,000 live births
- male: 43.52 deaths/1,000 live births
- female: 39.55 deaths/1,000 live births (2011 est.)
Demographic statistics
The following demographic statistics are from the CIA World Factbook, unless otherwise indicated.[66]
Age structure
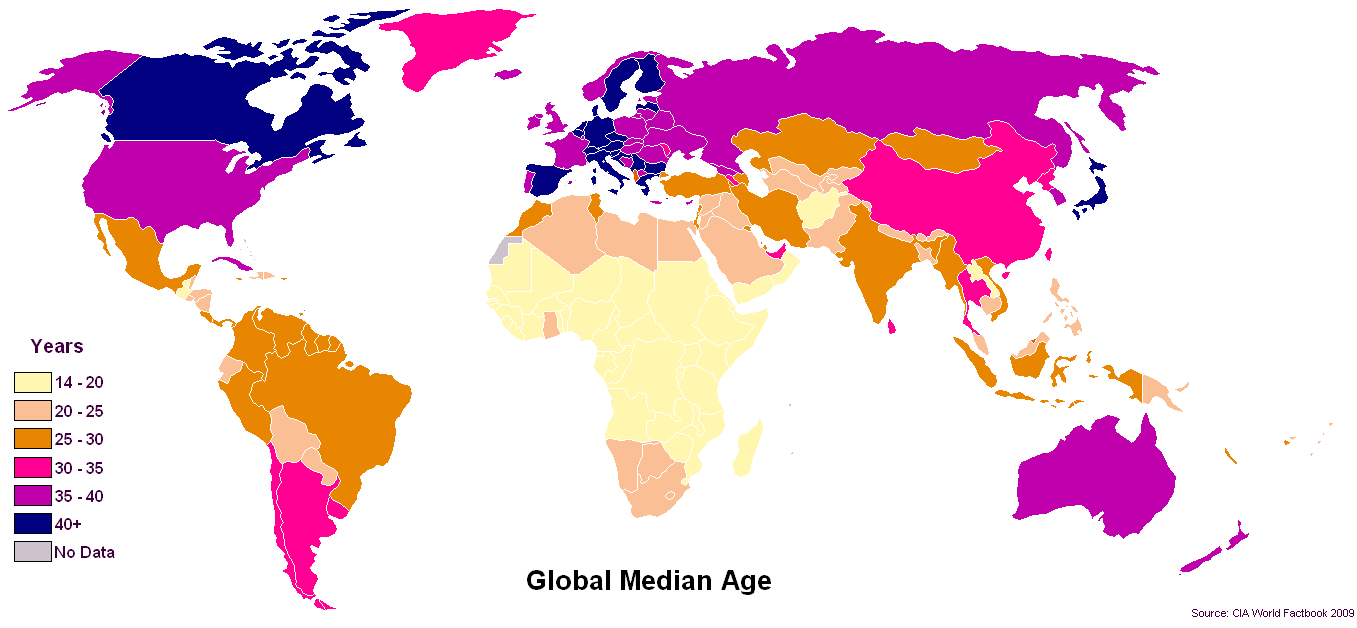
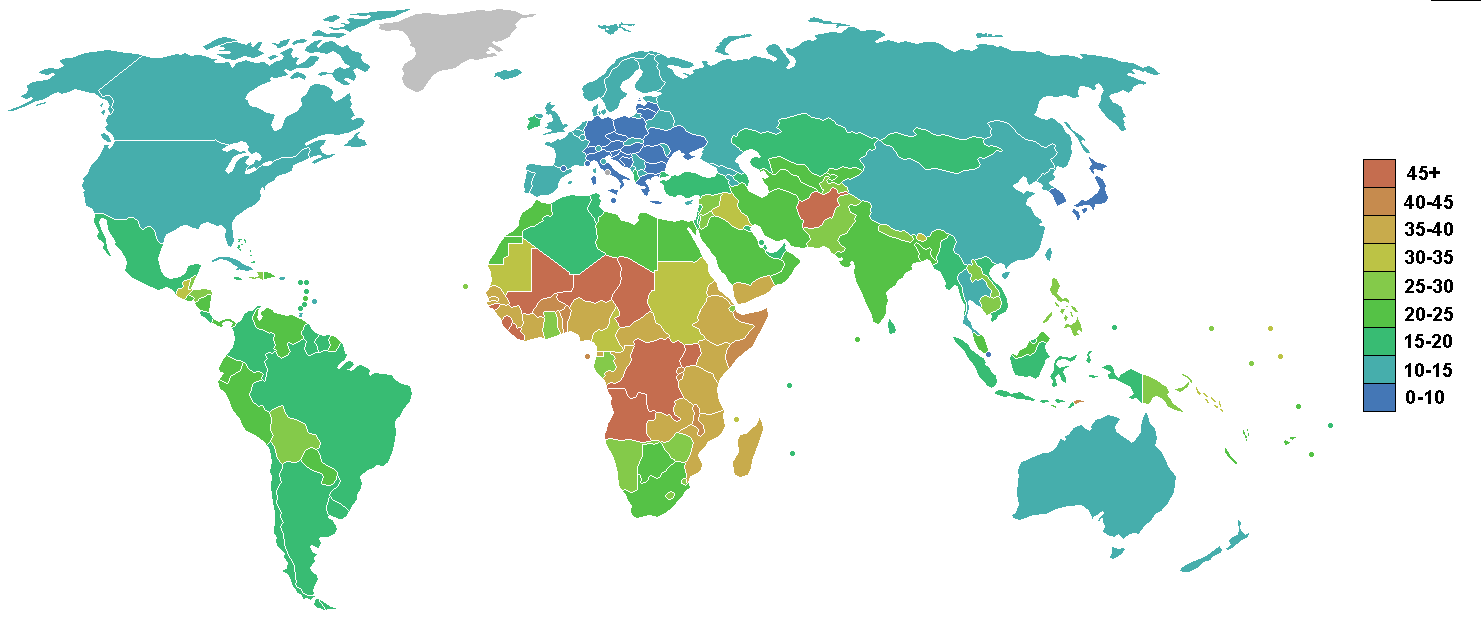
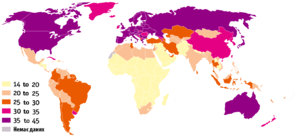 Median age by country. A youth bulge is evident for Africa, and to a lesser extent for South and Southeast Asia and Central America.Main articles: Population pyramid and List of countries by median age
According to the 2006 CIA World Factbook, around 27% of the world's population is below 15 years of age.[67]
- 0-14 years: 26.3% (male 944,987,919/female 884,268,378)[2]
- 15-64 years: 65.9% (male 2,234,860,865/female 2,187,838,153)[2]
- 65 years and over: 7.9% (male 227,164,176/female 289,048,221) (2011 est.)[2]
- Median Age - 28.4 years (male: 27.7 years, female: 29 years, 2009 est.)
Population growth rate
 Growth rate of world population (1950-2000)Main article: Population growth
Globally, the growth rate of the human population has been declining since peaking in 1962 and 1963 at 2.20% per annum. In 2009, the estimated annual growth rate was 1.1%.[68] The CIA World Factbook gives the world annual birthrate, mortality rate, and growth rate as 1.915%, 0.812%, and 1.092% respectively[69] The last one hundred years have seen a rapid increase in population due to medical advances and massive increase in agricultural productivity[70] made possible by the Green Revolution.[71][72][73]
The actual annual growth in the number of humans fell from its peak of 88.0 million in 1989, to a low of 73.9 million in 2003, after which it rose again to 75.2 million in 2006. Since then, annual growth has declined. In 2009, the human population increased by 74.6 million, which is projected to fall steadily to about 41 million per annum in 2050, at which time the population will have increased to about 9.2 billion.[68] Each region of the globe has seen great reductions in growth rate in recent decades, though growth rates remain above 2% in some countries of the Middle East and Sub-Saharan Africa, and also in South Asia, Southeast Asia, and Latin America.[74]
Some countries experience negative population growth, especially in Eastern Europe mainly due to low fertility rates, high death rates and emigration. In Southern Africa, growth is slowing due to the high number of HIV-related deaths. Some Western Europe countries might also encounter negative population growth.[75] Japan's population began decreasing in 2005.[76]
Population in the world increased from 1990 to 2008 with 1,423 million and 27 % growth. As persons the increase was among highest in India 290 million and China 192 million. Population growth was among highest in Qatar 174 % and United Arab Emirates 140 %.[77]
Rank Country Population (thousands)
2010Population (thousands)
1990Growth (%)
1990-2010World 6 895 889 5 306 425 30.0% 1 China1 341 335 1 145 195 17.1% 2 India1 224 614 873 785 40.2% 3 United States310 384 253 339 22.5% 4  Indonesia
239 871 184 346 30.1% 5 Brazil194 946 149 650 30.3% 6 Pakistan173 593 111 845 55.2% 7  Nigeria
158 423 97 552 62.4% 8 Bangladesh148 692 105 256 41.3% 9  Russia
142 958 148 244 -3.6% 10 Japan126 536 122 251 3.5% Birth rate
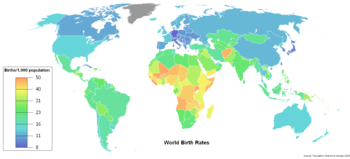 Countries by birth rate in 2008
As of 2009, the average birth rate for the whole world is 19.95 per year per 1000 total population, a 0.48% decline from 2003's world birth rate of 20.43 per 1000 total population. Per U.S. federal government data released in March 2011, births fell 4% from 2007 to 2009, the largest drop in the U.S. for any two-year period since the 1970s.[78] Births have declined for three consecutive years, and are now 7% below the peak in 2007.[79] This drop has continued through 2010, according to data released by the U.S. National Center for Health Statistics in June 2011.[80] Numerous experts have suggested that this decline is largely a reflection of unfavorable uneconomic conditions. [81] This connection between birth rates and economic downturns partly stems from the fact that American birth rates have now fallen to levels that are comparable to the Great Depression of the 1930's.[82] Teen birth rates in the U.S. are at the lowest level in U.S. history.[83] In fact, teen birth rates in the U.S. have consistently decreased since 1991 through 2011, except for a brief increase between 2005 and 2007.[83] The other aberration from this otherwise steady decline in teen birth rates is the 6% decrease in birth rates for 15–19 year olds between 2008 and 2009.[83] Despite these years of decrease, U.S. teen birth rates are still higher than in other developed nations.[83] Racial differences prevail with teen birth and pregnancy rates as well. The American Indian/Alaska Native, Hispanic, and non-Hispanic black teen pregnancy rates are more than double the non-Hispanic white teen birth rate.[84]
World historical and predicted crude birth rates (1950–2050)
UN, medium variant, 2008 rev.[85]Years CBR Years CBR 1950–1955 37.2 2000–2005 21.2 1955–1960 35.3 2005–2010 20.3 1960–1965 34.9 2010–2015 19.4 1965–1970 33.4 2015–2020 18.2 1970–1975 30.8 2020–2025 16.9 1975–1980 28.4 2025–2030 15.8 1980–1985 27.9 2030–2035 15.0 1985–1990 27.3 2035–2040 14.5 1990–1995 24.7 2040–2045 14.0 1995–2000 22.5 2045–2050 13.4 According to the CIA - The World Factbook, the country with the highest birth rate currently is Niger at 51.26 births per 1000 people. The country with the lowest birth rate is Japan at 7.64 births per 1000 people. (Hong Kong, a Special Administrative Region of China, is at 7.42 births per 1000 people.) As compared to the 1950s (birth rate was at 36 births per 1000 in the 1950s[86]), birth rate has declined by 16 births per 1000 people. In July, 2011, the U.S. National Institutes of Health announced that the adolescent birth rate continues to decline.[87] Birth rates vary even within the same geographic areas. In Europe, as of July 2011, Ireland's birth rate is 16.5 per cent, which is 3.5 per cent higher than the next-ranked country, the UK. France has a birth rate of 12.8 per cent while Sweden is at 12.3 per cent.[88] In July, 2011, the UK's Office for National Statistics (ONS) announced a 2.4% increase in live births in the UK in 2010 alone.[89] This is the highest birth rate in the UK in 40 years.[89] By contrast, the birth rate in Germany is only 8.3 per 1,000, which is so low that both the UK and France, which have significantly smaller populations, produced more births in the last year.[90] Birth rates also vary within the same geographic area, based on different demographic groups. For example, in April 2011, the U.S. CDC announced that the birth rate for women over the age of 40 in the U.S. rose between 2007 and 2009, while it fell among every other age group during the same time span.[91] In August 2011, Taiwan's government announced that its birth rate declined in the previous year, despite the fact that it implemented a host of approaches to encourage its citizens to have babies.[92]
Birth rates ranging from 10-20 births per 1000 are considered low, while rates from 40-50 births per 1000 are considered high. There are problems associated with both an extremely high birth rate and an extremely low birth rate. High birth rates can cause stress on the government welfare and family programs to support a youthful population. Additional problems faced by a country with a high birth rate include educating a growing number of children, creating jobs for these children when they enter the workforce, and dealing with the environmental effects that a large population can produce. Low birth rates can put stress on the government to provide adequate senior welfare systems and also the stress on families to support the elders themselves. There will be less children or working age population to support the constantly growing aging population.
Death rate
World historical and predicted crude death rates (1950–2050)
UN, medium variant, 2008 rev.[93]Years CDR Years CDR 1950–1955 19.5 2000–2005 8.6 1955–1960 17.3 2005–2010 8.5 1960–1965 15.5 2010–2015 8.3 1965–1970 13.2 2015–2020 8.3 1970–1975 11.4 2020–2025 8.3 1975–1980 10.7 2025–2030 8.5 1980–1985 10.3 2030–2035 8.8 1985–1990 9.7 2035–2040 9.2 1990–1995 9.4 2040–2045 9.6 1995–2000 8.9 2045–2050 10 The ten countries with the highest crude death rate, according to the 2009 CIA World Factbook estimates, are:
Rank Country Death rate
(annual deaths/1000 persons)1  Swaziland
30.83 2  Angola
24.08 3  Lesotho
22.20 4  Sierra Leone
21.91 5  Zambia
21.34 6  Liberia
20.73 7  Mozambique
20.07 8  Afghanistan
19.18 9  Djibouti
19.10 10  Central African Republic
17.84 See list of countries by death rate for worldwide statistics.
According to the World Health Organization, the 10 leading causes of death in 2002 were:
- 12.6% Ischaemic heart disease
- 9.7% Cerebrovascular disease
- 6.8% Lower respiratory infections
- 4.9% HIV/AIDS
- 4.8% Chronic obstructive pulmonary disease
- 3.2% Diarrhoeal diseases
- 2.7% Tuberculosis
- 2.2% Trachea/bronchus/lung cancers
- 2.2% Malaria
- 2.1% Road traffic accidents
Causes of death vary greatly between first and third world countries.
According to Jean Ziegler (the United Nations Special Rapporteur on the Right to Food for 2000 to March 2008), mortality due to malnutrition accounted for 58% of the total mortality in 2006: "In the world, approximately 62 millions people, all causes of death combined, die each year. In 2006, more than 36 millions died of hunger or diseases due to deficiencies in micronutrients".[94]
Of the roughly 150,000 people who die each day across the globe, about two thirds—100,000 per day—die of age-related causes.[95] In industrialized nations, the proportion is much higher, reaching 90%.[95]
Sex ratio
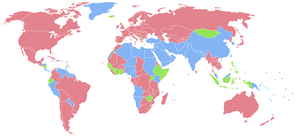 Map indicating the human sex ratio by country.Countries with more females than males.Countries with the same number of males and females.Countries with more males than females.No data
The Northern Mariana Islands have the highest female ratio with 0.77 males per female. Qatar has the highest male ratio, with 2.87 males/female. For the group aged below 15, Sierra Leone has the highest female ratio with 0.96 males/female, and the Republic of Georgia and the People's Republic of China are tied for the highest male ratio with 1.13 males/female (according to the 2006 CIA World Factbook).
The value for the entire world population is 1.01 males/female, with 1.07 at birth, 1.06 for those under 15, 1.02 for those between 15 and 64, and 0.78 for those over 65. The sex ratio for the entire world population is 101 males to 100 females[96]
The "First World" G7 members all have a gender ratio in the range of 0.95–0.98 for the total population, of 1.05–1.07 at birth, of 1.05–1.06 for the group below 15, of 1.00–1.04 for the group aged 15–64, and of 0.70–0.75 for those over 65.
Countries on the Arabian peninsula tend to have a 'natural' ratio of about 1.05 at birth but a very high ratio of males for those over 65 (Saudi Arabia 1.13, Arab Emirates 2.73, Qatar 2.84), indicating either an above-average mortality rate for females or a below-average mortality for males, or, more likely in this case, a large population of aging male guest workers. Conversely, countries of Eastern Europe (the Baltic states, Belarus, Ukraine, Russia) tend to have a 'normal' ratio at birth but a very low ratio of males among those over 65 (Russia 0.46, Latvia 0.48, Ukraine 0.52); similarly, Armenia has a far above average male ratio at birth (1.17), and a below-average male ratio above 65 (0.67). This effect may be caused by emigration and higher male mortality as result of higher Soviet era deaths; it may also be related to the enormous (by western standards) rate of alcoholism in the former Soviet states. Another possible contributory factor is an aging population, with a higher than normal proportion of relatively elderly people: we recall that due to higher differential mortality rates the ratio of males to females reduces for each year of age.
Total fertility rate
World historical and predicted total fertility rates (1950–2100)
UN, medium variant, 2010 rev.[97]Years TFR Years TFR Years TFR 1950–1955 4.95 2000–2005 2.62 2050–2055 2.15 1955–1960 4.89 2005–2010 2.52 2055–2060 2.12 1960–1965 4.91 2010–2015 2.45 2060–2065 2.11 1965–1970 4.85 2015–2020 2.39 2065–2070 2.09 1970–1975 4.45 2020–2025 2.33 2070–2075 2.08 1975–1980 3.84 2025–2030 2.29 2075–2080 2.06 1980–1985 3.59 2030–2035 2.25 2080–2085 2.05 1985–1990 3.39 2035–2040 2.22 2085–2090 2.04 1990–1995 3.04 2040–2045 2.19 2090–2095 2.04 1995–2000 2.79 2045–2050 2.17 2095–2100 2.03 Developed countries usually have a much lower fertility rate due to greater wealth, education, and urbanization. Mortality rates are low, birth control is understood and easily accessible, and costs are often deemed very high because of education, clothing, feeding, and social amenities. With wealth, contraception becomes affordable. However, in countries like Iran where contraception was made artificially affordable before the economy accelerated, birth rate also rapidly declined. Further, longer periods of time spent getting higher education often mean women have children later in life. The result is the demographic-economic paradox. Female labor participation rate also has substantial negative impact on fertility. However, this effect is neutralized among Nordic or liberalist countries.[98]
In undeveloped countries on the other hand, families desire children for their labour and as caregivers for their parents in old age. Fertility rates are also higher due to the lack of access to contraceptives, generally lower levels of female education, and lower rates of female employment in industry.
Unemployment rate
8.7% (2010 est.) 8.2% (2009 est.) note: 30% combined unemployment and underemployment in many non-industrialized countries; developed countries typically 4%-12% unemployment (2007 est.)
Nationality
- noun: Earthican(s) or Terran
- adjective: Earthican or Terran
Languages
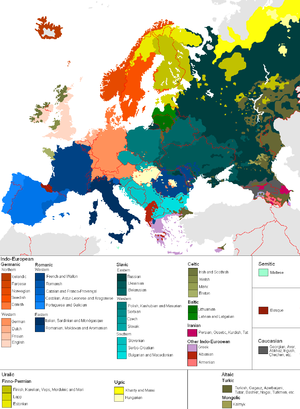 A color-coded map of Europe showing the geographic distribution of languages.Main article: Languages of the World
The World has no official language. The dominant language, spoken as a first language by 12.44% of the population, is Mandarin Chinese. Spanish is spoken by around 330 to 400 million people, predominantly in The Americas and Spain. Arabic is spoken by around 280 million people. Hindi is spoken by about 200 million speakers, mostly in India. Bengali is spoken by around 230 million people. Portuguese is spoken by about 230 million speakers in Portugal, Brazil and South Africa.
There are numerous other languages, grouped into nine major families:
- Indo-European languages 46% (Europe, Southwest to South Asia, North Asia, North America, South America, Oceania)
- Sino-Tibetan languages 21% (East Asia)
- Niger–Congo languages 6.4% (Sub-Saharan Africa)
- Afro-Asiatic languages 6.0% (North Africa to Horn of Africa, Southwest Asia)
- Austronesian languages 5.9% (Oceania, Madagascar, maritime Southeast Asia)
- Dravidian languages 3.7% (South Asia)
- Altaic languages (controversial combination of Turkic, Mongolic, and Tungusic families) 2.3% (Central Asia, Northern Asia, Anatolia, Siberia)[99]
- Austro-Asiatic languages 1.7% (mainland Southeast Asia)
- Tai–Kadai languages 1.3% (Southeast Asia)
There are also hundreds of non-verbal sign languages.
Education
4.4% of GDP spent on Education (2007)
total population: 83.7% over the age of 15 can read and write, 88.3% male and 79.2% female note: over two-thirds of the world's 793 million illiterate adults are found in only eight countries (Bangladesh, China, Egypt, Ethiopia, India, Indonesia, Nigeria, and Pakistan); of all the illiterate adults in the world, two-thirds are women; extremely low literacy rates are concentrated in three regions, the Arab states, South and West Asia, and Sub-Saharan Africa, where around one-third of the men and half of all women are illiterate (2005-09 est.)
As of 2008, the school life expectancy (primary to tertiary education, for a man or woman is 11 years.
See also
- Demographics of North America
- Demographics of South America
- Demographics of Asia
- Demographics of Africa
- Demographics of Oceania
- Demographics of Europe
- Demographics of Antarctica
References
- ^ "U.S. Census Bureau - World POPClock Projection". http://www.census.gov/population/popclockworld.html.
- ^ a b c d e f g h i CIA.gov World Factbook - World Statistics Archived 1 February 2010 at WebCite
- ^ World Population Becomes More Urban That Rural
- ^ "Country Comparison :: Population". U.S. Census Bureau. 2008. https://www.cia.gov/library/publications/the-world-factbook/rankorder/2119rank.html. Retrieved 2011-09-28.
- ^ "Cities: largest (without surrounding suburban areas)". Geohive. http://www.geohive.com/earth/cy_notagg.aspx.
- ^ "census.gov". census.gov. 2009-01-07. http://www.census.gov/ipc/www/worldpop.html. Retrieved 2010-08-01.
- ^ a b World Population Prospects: The 2008 Revision Population Database Archived 7 April 2006 at WebCite
- ^ "The World at". Un.org. 1999-10-12. http://www.un.org/esa/population/publications/sixbillion/sixbillion.htm. Retrieved 2010-08-01.
- ^ "Population Growth over Human History". Globalchange.umich.edu. http://www.globalchange.umich.edu/globalchange2/current/lectures/human_pop/human_pop.html. Retrieved 2010-08-01.
- ^ "Geo Hive: the population of continents, regions and countries (Jul. 1, 2008)". Xist.org. http://www.xist.org/earth/pop_region.aspx. Retrieved 2010-08-01.
- ^ World Population Milestones
- ^ Population growth and poverty
- ^ Figures include the former Soviet Union in Europe. Caselli, Graziella; Gillaume Wunsch, Jacques Vallin (2005-12-20). Demography: Analysis and Synthesis, Four Volume Set: A Treatise in Population. Academic Press. p. 42. ISBN 978-0-12-765660-1.
- ^ "UN report 2004 data" (PDF). http://www.un.org/esa/population/publications/sixbillion/sixbilpart1.pdf. Retrieved 2010-08-01.
- ^ 2005 World City Populations
- ^ "World Urbanization Prospects: The 2009 Revision Population Database". United Nations. http://esa.un.org/wup2009/wup/source/country.aspx. Retrieved 2011-09-11.
- ^ The area figures are taken from individual national censuses according to the criteria and statistical concepts noted in the World Urbanization Prospects.
- ^ As defined by the Statistics Bureau of Japan; refers to Kanto major metropolitan area (M.M.A.)
- ^ Based on a definition of urban agglomeration that is not restricted to state boundaries
- ^ The Greater Mumbai urban agglomeration is defined by the municipal corporations of Greater Mumbai, Kalyan-Dombivali, Navi Mumbai, Thane and Ulhasnagar, plus the municipal councils of Ambarnath, Badlapur and Mira-Bhayandar. Not to be confused with the Mumbai Metropolitan Region, which includes some additional urban and rural units.
- ^ Data refer to the urbanized area (UA), that is, contiguous territory that meets minimum population density requirements.
- ^ U.S. Census Bureau, Alphabetically sorted corrected National list of Urbanized Areas. Retrieved 2008-07-03.
- ^ The population of the city is composed of population in all City Districts meeting the criteria such as “contiguous built-up area,” being the location of the local government, being a Street or Having a Resident Committee.
- ^ Directorate of Census Operations, West Bengal; Kolkata District. Retrieved 2008-07-03.
- ^ U.S. & World Population Clocks
- ^ CIA - The World Factbook Archived 1 February 2010 at WebCite
- ^ About.com
- ^ Department of Economic and Social Affairs Population Division (2009) (PDF). World Population Prospects, Table A.1. 2008 revision. United Nations. http://www.un.org/esa/population/publications/wpp2008/wpp2008_text_tables.pdf. Retrieved 2009-03-12.
- ^ The Monaco government uses a smaller surface area figure resulting in a population density of 18,078 per km2
- ^ "China: People". The World Factbook. Archived from the original on 2010-07-23. https://www.cia.gov/library/publications/the-world-factbook/geos/ch.html.
- ^ World Christian Database Gordon–Conwell Theological Seminary Centre for the Study of Global Christianity
- ^ The Big Religion Comparison Chart: Compare World Religions - ReligionFacts
- ^ 2010 World Muslim Population pdf Dr. Houssain Kettani January 2010
- ^ "Mapping the Global Muslim Population". http://pewforum.org/docs/?DocID=450. Retrieved 2009-10-08.
- ^ "World distribution of muslim population". Pew Centre. October 2009. http://pewresearch.org/assets/pewforum-muslim-project/weighted-map.htm. Retrieved 26 December 2009.
- ^ Major Religions of the World Ranked by Number of Adherents, adherents.com. Archived 17 January 2010 at WebCite
- ^ [Clarke, Peter B. (editor), The Religions of the World: Understanding the Living Faiths, Marshall Editions Limited: USA (1993); pg. 125]
- ^ a b c "World". CIA World Factbook, 2010 Archived 1 February 2010 at WebCite
- ^ Fischer-Schreiber, Ingrid, et al. The Encyclopedia of Eastern Philosophy & Religion: Buddhism, Hinduism, Taoism, Zen. Shambhala: Boston (English: pub. 1994; orig. German: 1986); pg. 50.
- ^ a BBC News article
- ^ Asia Sentinel - How Now Tao?
- ^ Japanese government[dead link]
- ^ Indian Registrar General & Census Commissioner. "Religious Composition". Census of India, 2001
- ^ "World Religions (2005)". QuickLists > The World > Religions. The Association of Religion Data Archives. 2005. http://www.thearda.com/QuickLists/QuickList_125.asp. Retrieved 2009-07-04.
- ^ "World: People: Religions". CIA World Factbook. Central Intelligence Agency. 2007. ISSN 1553-8133. https://www.cia.gov/library/publications/the-world-factbook/geos/xx.html#people. Retrieved 2009-09-06.
- ^ Encyclopædia Britannica (2002). "Worldwide Adherents of All Religions by Six Continental Areas, Mid-2002". Encyclopædia Britannica. Encyclopædia Britannica. ISBN 978-0-85229-555-7.
- ^ MacEoin, Denis (2000). "Baha'i Faith". In Hinnells, John R.. The New Penguin Handbook of Living Religions: Second Edition. Penguin. ISBN 978-0-14-051480-3.
- ^ "Most Baha'i Nations (2005)". QuickLists > Compare Nations > Religions >. The Association of Religion Data Archives. 2005. http://www.thearda.com/QuickLists/QuickList_40.asp. Retrieved 2009-07-04.
- ^ Sergei Blagov. "Caodaism in Vietnam : Religion vs Restrictions and Persecution". IARF World Congress, Vancouver, Canada, July 31st, 1999.
- ^ Self-reported figures from 1999; North Korea only (South Korean followers are minimal according to self-reported figures). In The A to Z of New Religious Movements by George D. Chryssides. ISBN 978-0-8108-5588-5
- ^ a b Self-reported figures printed in Japanese Ministry of Education's 宗教年間 Shuukyou Nenkan, 2003
- ^ Encyclopedia of the Modern Middle East and North Africa (Detroit: Thompson Gale, 2004) p. 82
- ^ Clarke, Peter B. (editor), The Religions of the World: Understanding the Living Faiths, Marshall Editions Limited: USA (1993); pg. 208. "Sekai Kyuseikyo has about one million members, a growing number of them in the west and the third world, especially Brazil and Thailand. "
- ^ Leonard E. Barrett. The Rastafarians: Sounds of Cultural Dissonance. Beacon Press, 1988. p. viii.
- ^ American Religious Identification Survey Archived 16 April 2011 at WebCite
- ^ The results have been studied and found "highly correlated with other sources of data", but "consistently gave a higher estimate for percent Christian in comparison to other cross-national data sets." Hsu, Becky; Reynolds, Amy; Hackett, Conrad; Gibbon, James (2008-07-09). "Estimating the Religious Composition of All Nations" (PDF). Journal for the Scientific Study of Religion. Archived from the original on March 26, 2010. http://web.archive.org/web/20100326175049/http://www.princeton.edu/~bhsu/Hsu2008.pdf
- ^ International Community, Bahá'í (1992). "How many Bahá'ís are there?". The Bahá'ís: p. 14. http://www.bahai.com/thebahais/pg14.htm
- ^ Barrett, David A. (2001). World Christian Encyclopedia. p. 4. ISBN 978-0-19-507963-0. Archived from the original on 2011-04-16. http://www.webcitation.org/5xz7V0tX7.
- ^ Barrett, David; Johnson, Todd (2001). "Global adherents of the World's 19 distinct major religions". William Carey Library. Archived from the original on 2008-02-28. http://web.archive.org/web/20080228224811/http://www.gordonconwell.edu/ockenga/globalchristianity/gd/wct-1-2.pdf. Retrieved 2006-10-12.
- ^ Staff (May 2007). "The List: The World’s Fastest-Growing Religions". Foreign Policy (Carnegie Endowment for International Peace). http://www.foreignpolicy.com/story/cms.php?story_id=3835.
- ^ Pew Research Center (2002-12-19). "Among Wealthy Nations U.S. Stands Alone in its Embrace of Religion". Pew Research Center. Archived from the original on 2011-08-21. http://pewglobal.org/reports/display.php?ReportID=167. Retrieved 2006-10-12.
- ^ Pew Research Center (2008-01-01). "Income and Religiosity". http://benmuse.typepad.com/ben_muse/2008/01/wealth-and-reli.html. Retrieved 2009-09-14.
- ^ United Nations Economic Commission for Europe"Mean age at first marriage by sex". Accessed 21 May 2011.
- ^ Hospital Bed Statistics by Country
- ^ 2010 World Hunger
- ^ "CIA - The World Factbook". CIA. Archived from the original on 2010-02-01. https://www.cia.gov/library/publications/the-world-factbook/geos/xx.html. Retrieved 2010-02-16.
- ^ Age structure of the world – 2006 CIA World Factbook
- ^ a b U.S. Census Bureau, January 2010
- ^ World Factbook Archived 1 February 2010 at WebCite
- ^ BBC NEWS | The end of India's green revolution?
- ^ Food First/Institute for Food and Development Policy
- ^ Rising food prices curb aid to global poor
- ^ Record rise in wheat price prompts UN official to warn that surge in food prices may trigger social unrest in developing countries
- ^ U.S. Census Bureau, June 2009
- ^ UN population projections Archived 28 October 2010 at WebCite
- ^ Japan sees biggest population fall
- ^ CO2 Emissions from Fuel Combustion Population 1971-2008 IEA (pdf pages 83-85)
- ^ Us Birth Rate | U.S. birth rate: Drop in birth rate is the biggest in 30 years - Los Angeles Times
- ^ America's Birth Rate Declined For The Third Year Running
- ^ America's Birth Rate Declined For The Third Year Running
- ^ Economic turmoil taking its toll on childbearing - USATODAY.com
- ^ Lower birth rate blamed on the economy | wzzm13.com
- ^ a b c d CDC Data & Statistics | Feature: Teen Birth Rates Declined Again in 2009 Archived 30 July 2011 at WebCite
- ^ CDC Data & Statistics | Feature: Teen Birth Rates Declined Again in 2009
- ^ UNdata: Crude birth rate (per 1,000 population)
- ^ uneca.org: Crude Birth Rates - The World and its Major Regions, 1950-2050
- ^ Federal report shows drop in adolescent birth rate, July 7, 2011 News Release - National Institutes of Health (NIH)
- ^ Ireland has one of highest birth and lowest death rates in EU · TheJournal
- ^ a b Call for more midwives as birth rate reaches 40-year high | Society | guardian.co.uk
- ^ Germany faces up to its kinder surprise - The Irish Times - Tue, Aug 09, 2011
- ^ CDC records rise in birth rate for women over 40 - CNN.com
- ^ BBC News - Taiwanese birth rate plummets despite measures
- ^ UNdata: Crude death rate (per 1,000 population)
- ^ Jean Ziegler, L'Empire de la honte, Fayard, 2007 ISBN 978-2-253-12115-2, p.130.
- ^ a b Aubrey D.N.J, de Grey (2007). "Life Span Extension Research and Public Debate: Societal Considerations" (PDF). Studies in Ethics, Law, and Technology 1 (1, Article 5). doi:10.2202/1941-6008.1011. http://www.sens.org/files/pdf/ENHANCE-PP.pdf. Retrieved August 7, 2011.
- ^ "CIA Fact Book". The Central Intelligence Agency of the United States. Archived from the original on 2010-02-01. https://www.cia.gov/library/publications/the-world-factbook/geos/xx.html.
- ^ UNdata: Total fertility rate (children per woman)[dead link]
- ^ Graph Charts of TFR and FLR using Google Motion Chart using World Bank's World Development Index.
- ^ Since the Mongolic and Tungusic language families have only a relatively small number of speakers, the majority of the Altaic percentage represents speakers of Turkic languages
- ^ a b The number of people who consider themselves party to a "folk tradition" is impossible to determine.
- ^ Figures for the population of Jains differ from just over six million to twelve million due to difficulties of Jain identity, with Jains in some areas counted as a Hindu sect. Many Jains do not return Jainism as their religion on census forms for various reasons such as certain Jain castes considering themselves both Hindu and Jain. Following a major advertising campaign urging Jains to register as such, the 1981 Census of India returned 3.19 million Jains. This was estimated at the time to still be half the true number. The 2001 Census of India had 8.4 million Jains.
- ^ Historically, the Bahá'í Faith arose in 19th century Persia, in the context of Shi'a Islam, and thus may be classed on this basis as a divergent strand of Islam, placing it in the Abrahamic tradition. However, the Bahá'í Faith considers itself an independent religious tradition, which draws from Islam but also other traditions. The Bahá'í Faith may also be classed as a new religious movement, due to its comparatively recent origin, or may be considered sufficiently old and established for such classification to not be applicable.
External links
Categories:


Wikimedia Foundation. 2010.