- List of countries by carbon dioxide emissions
-
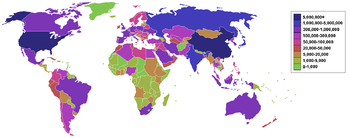 Countries by carbon dioxide emissions via the burning of fossil fuels (blue the highest).
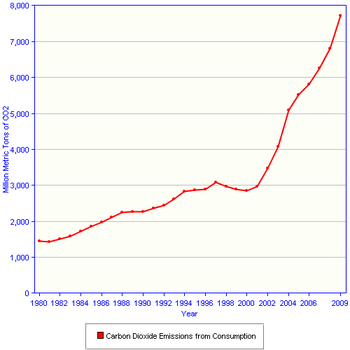 China CO2 emission in millions of metric tons from 1980 to 2009.
This is a list of sovereign states and territories by carbon dioxide emissions due to human activity. The data presented below corresponds to emissions in 2008. The data was collected by the CDIAC for the United Nations. The data only considers carbon dioxide emissions from the burning of fossil fuels and cement manufacture, but not emissions from land use such as deforestation. The top 10 countries in the world emit 67.07% of the world total.[1][2][3][4][5][6] Other powerful, more potent greenhouse gases are not included in this data, including methane.
Some dependencies and territories whose independence has not been generally recognized are also included as they are in the source data. Certain entities are mentioned here for purposes of comparison. These are indicated in italics and are not counted in the ordering of sovereign states. (See also: carbon cycle) On 6 October 2010, the International Energy Agency released its own data set (calculated using slightly different methods than CDIAC) for 2008 emissions that listed about 140 countries.[7]
Contents
List of countries by 2008 emissions
Rank Country Annual CO2 emissions[8][9]
(in thousands of metric tonnes)Percentage of global total World 29,888,121 100% 1  China[10]
7,031,916 23.33% 2  United States
5,461,014 18.11% -  European Union (27)
4,177,817.86[11] 14.04% 3  India
India1,742,698 5.78% 4  Russia
1,708,653 5.67% 5  Japan
Japan1,208,163 4.01% 6  Germany
786,660 2.61% 7  Canada
544,091 1.80% 8  Iran
Iran538,404 1.79% 9  United Kingdom
522,856 1.73% 10  South Korea
509,170 1.69% 11  Mexico
475,834 1.58% 12  Italy[12]
445,119 1.48% 13  South Africa
435,878 1.45% 14  Saudi Arabia
433,557 1.44% 15  Indonesia
406,029 1.35% 16  Australia
399,219 1.32% 17  Brazil
393,220 1.30% 18  France[13]
376,986 1.25% 19  Spain
Spain329,286 1.09% 20  Ukraine
323,532 1.07% 21  Poland
316,066 1.05% 22  Thailand
285,733 0.95% 23  Turkey
283,980 0.94% 24  Taiwan
258,599[14] 0.86% 25  Kazakhstan
236,954 0.79% 26  Egypt
Egypt210,321 0.70% 27  Malaysia
208,267 0.69% 28  Argentina
192,378 0.64% 29  Netherlands
173,750 0.58% 30  Venezuela
169,533 0.56% 31  Pakistan
163,178 0.54% 32  United Arab Emirates
155,066 0.51% 33  Vietnam
127,384 0.42% 34  Uzbekistan
124,905 0.41% 35  Czech Republic
116,996 0.39% 36  Algeria
111,304 0.37% 37  Belgium
104,880 0.35% 38  Iraq
Iraq102,936 0.34% 39  Greece
97,814 0.32% 40  Nigeria
95,756 0.32% 41  Romania
94,660 0.31% 42  Philippines
83,157 0.28% 43  North Korea
78,371 0.26% 44  Kuwait
76,743 0.25% 45  Chile
Chile73,109 0.24% 46  Syria
Syria71,598 0.24% 47  Qatar
Qatar68,478 0.23% 48  Austria
67,726 0.22% 49  Colombia
67,700 0.22% 50  Belarus
62,816 0.21% 51  Libya
Libya58,331 0.19% 52  Finland
56,512 0.19% 53  Portugal
56,310 0.19% 54  Hungary
54,638 0.18% 55  Bulgaria
50,539 0.17% 56  Norway
49,920 0.17% 57  Serbia
49,934 0.17% 58  Trinidad and Tobago
49,772 0.17% 59  Sweden
49,050 0.16% 60  Morocco
47,906 0.16% 61  Turkmenistan
47,840 0.16% 62  Azerbaijan
47,139 0.16% 63  Bangladesh
46,527 0.15% 64  Denmark
46,025 0.15% 65  Oman
Oman45,749 0.15% 66  Ireland
43,604 0.14% 67  Peru
Peru40,535 0.13% 68  Switzerland
40,392 0.13% 69  Hong Kong
38,573 0.13% 70  Israel
37,664 0.12% 71  Slovakia
37,557 0.12% 72  New Zealand
33,095 0.11% 73  Singapore
32,295 0.11% 74  Cuba
Cuba31,419 0.10% 75  Bosnia and Herzegovina
31,276 0.10% 76  Ecuador
26,826 0.09% 77  Tunisia
25,013 0.08% 78  Angola
24,371 0.08% 79  Yemen
Yemen23,384 0.08% 80  Croatia
23,304 0.08% 81  Bahrain
22,479 0.07% 82  Dominican Republic
21,617 0.07% 83  Jordan
21,382 0.07% 84  Estonia
18,291 0.06% 85  Slovenia
17,158 0.06% 86  Lebanon
17,099 0.06% 87  Lithuania
15,130 0.05% 88  Sudan
Sudan14,052 0.05% 89  Bolivia
12,835 0.04% 90  Myanmar
12,776 0.04% 91  Jamaica
12,204 0.04% 92  Guatemala
11,914 0.04% 93  Macedonia
11,815 0.04% 94  Sri Lanka
11,764 0.04% 95  Mongolia
10,895 0.04% 96  Brunei
10,594 0.04% 97  Luxembourg
10,502 0.03% 98  Kenya
Kenya10,392 0.03% 99  Zimbabwe
9,076 0.03% 100  Honduras
8,672 0.03% 101  Ghana
Ghana8,592 0.03% 102  Cyprus
8,328 0.03% 103  Uruguay
8,328 0.03% 104  Costa Rica
8,016 0.03% 105  Latvia
7,591 0.03% 106  Ethiopia
7,107 0.02% 107  Côte d'Ivoire
7,015 0.02% 108  Panama
6,912 0.02% 109  Tanzania
6,465 0.02% 110  Netherlands Antilles
6,219 0.02% 111  Kyrgyzstan
6,208 0.02% 112  El Salvador
6,113 0.02% 113  Armenia
5,548 0.02% 114  Cameroon
5,302 0.02% 115  Georgia
5,203 0.02% 116  Senegal
4,976 0.02% 117  Botswana
4,840 0.02% 118  Equatorial Guinea
4,815 0.02% 119  Moldova
4,774 0.02% 120  Cambodia
4,602 0.02% 121  Nicaragua
4,331 0.01% 123  Albania
4,117 0.01% 124  Paraguay
4,118 0.01% 125  Benin
Benin4,067 0.01% 126  Namibia
3,968 0.01% 127  Mauritius
3,953 0.01% 128  Uganda
3,748 0.01% 129  Nepal
Nepal3,542 0.01% 130  New Caledonia
3,150 0.01% 131  Tajikistan
3,146 0.01% 132  Democratic Republic of the Congo
2,816 0.01% 133 Réunion2,816 0.01% 134  Malta
Malta2,560 0.01% 135  Gabon
Gabon2,472 0.01% 136  Suriname
2,439 0.01% 137  Haiti
Haiti2,435 0.01% 138  Mozambique
2,314 0.01% 139  Aruba
Aruba2,288 0.01% 140  Iceland
2,230 0.01% 141 Guadeloupe2,200 0.01% 142  Bahamas
2,156 0.01% 143  Papua New Guinea
2,109 0.01% 144  Palestinian territories
2,057 0.01% 145  Mauritania
1,999 0.01% 146  Montenegro
1,951 0.01% 147  Republic of the Congo
1,936 0.01% 148 Martinique1,918 0.01% 149  Madagascar
1,911 0.01% 150  Zambia
1,889 0.01% 151  Burkina Faso
1,856 0.01% 152  Laos
Laos1,533 0.01% 153  Guyana
1,525 0.01% 154  Togo
Togo1,419 < 0.01% 155  Guinea
1,393 < 0.01% 156  Barbados
1,353 < 0.01% 157  Macau
Macau1,335 < 0.01% 158  Sierra Leone
1,335 < 0.01% 159  Fiji
Fiji1,254 < 0.01% 160  Malawi
1,228 < 0.01% 161  Swaziland
1,093 < 0.01% 162  Maldives
920 < 0.01% 163 French Guiana913 < 0.01% 164  French Polynesia
891 < 0.01% 165  Niger
Niger851 < 0.01% 166  Afghanistan
814 < 0.01% 167  Bhutan
733 < 0.01% 168  Faroe Islands
708 < 0.01% 169  Rwanda
704 < 0.01% 170  Seychelles
682 < 0.01% 171  Somalia
649 < 0.01% 172  Liberia
609 < 0.01% 173  Mali
Mali594 < 0.01% 174  Greenland
576 < 0.01% 175  Cayman Islands
557 < 0.01% 176  Andorra
539 < 0.01% 177  Djibouti
524 < 0.01% 178  Chad
Chad495 < 0.01% 179  Antigua and Barbuda
447 < 0.01% 180  Belize
425 < 0.01% 181  Gibraltar
422 < 0.01% 182  Eritrea
414 < 0.01% 183  Gambia
411 < 0.01% 184  Saint Lucia
396 < 0.01% 185  Bermuda
389 < 0.01% 186  Cape Verde
308 < 0.01% 187  Guinea-Bissau
282 < 0.01% 188  Central African Republic
260 < 0.01% 189  Saint Kitts and Nevis
249 < 0.01% 190  Grenada
246 < 0.01% 191  Sahrawi Arab Democratic Republic
238 < 0.01% 192  Palau
Palau213 < 0.01% 193  Saint Vincent and the Grenadines
202 < 0.01% 194  Solomon Islands
198 < 0.01% 195  Timor-Leste
191 < 0.01% 196  Burundi
180 < 0.01% 197  Tonga
Tonga176 < 0.01% 198  Samoa
Samoa161 < 0.01% 199  Turks and Caicos Islands
158 < 0.01% 200  Nauru
Nauru143 < 0.01% 201  Dominica
128 < 0.01% 202  São Tomé and Príncipe
128 < 0.01% 203  Comoros
125 < 0.01% 204  British Virgin Islands
103 < 0.01% 205  Marshall Islands
99 < 0.01% 206  Vanuatu
92 < 0.01% 207  Montserrat
77 < 0.01% 208  Cook Islands
70 < 0.01% 209 Saint Pierre and Miquelon66 < 0.01% 210  Federated States of Micronesia
62 < 0.01% 211  Anguilla
59 < 0.01% 212  Falkland Islands
59 < 0.01% 213  Kiribati
29 < 0.01% 214 Wallis and Futuna22 < 0.01% 215  Saint Helena, Ascension and Tristan da Cunha
11 < 0.01% 216  Niue
Niue4 < 0.01% See also
- Asian brown cloud
- Avoiding Dangerous Climate Change
- Avoiding Mass Extinctions Engine (AMEE)
- Carbon cycle
- Climate change
- Comparisons of life-cycle greenhouse gas emissions
- Emission standard
- Environmental impact of aviation
- Global warming
- Greenhouse gas emissions by the United States
- Kyoto Protocol
- List of countries by carbon dioxide emissions per capita
- List of countries by electricity production from renewable source
- List of countries by greenhouse gas emissions
- List of countries by greenhouse gas emissions per capita
- List of countries by ratio of GDP to carbon dioxide emissions
- World energy resources and consumption
- List of U.S. states by carbon dioxide emissions
- C90 List of countries producing 90% of carbon
USGS - Volcano Hazards Program Information - http://volcanoes.usgs.gov/hazards/gas/index.php "Volcanoes release more than 130 million tonnes of CO2 into the atmosphere every year."
Notes and references
- ^ "China now no. 1 in CO2 emissions; USA in second position". Netherlands Environmental Assessment Agency. http://www.mnp.nl/en/dossiers/Climatechange/moreinfo/Chinanowno1inCO2emissionsUSAinsecondposition.html. Retrieved 2007-06-22.
- ^ "China Overtakes U.S. as No. 1 Emitter of Carbon Dioxide". Sci-Tech Today. 2006-06-21. http://www.sci-tech-today.com/news/China-No--1-Emitter-of-Carbon-Dioxide/story.xhtml?story_id=111006822NEU.
- ^ "Greenhouse Gas Emissions Rise in China". NPR. 2008-03-14. http://www.npr.org/templates/story/story.php?storyId=88251868.
- ^ "China CO2 Emissions Growing Faster Than Anticipated". National Geographic. 2008-03-18. http://news.nationalgeographic.com/news/2008/03/080318-china-warming.html.
- ^ "Forecasting the Path of China’s CO2 Emissions Using Province Level Information". Department of Agricultural & Resource Economics, UCB. CUDARE Working Paper 97. 2008-03-14. http://repositories.cdlib.org/cgi/viewcontent.cgi?article=1050&context=are_ucb.
- ^ "China Passes U.S., Leads World in Power Sector Carbon Emissions - CGD". Center for Global Development. 2008-08-27. http://www.cgdev.org/content/article/detail/16578/.
- ^ CO2 Emissions from Fuel Combustion - Highlights, International Energy Agency website, retrieved 2010-10-06.
- ^ United Nations Statistics Division, Millennium Development Goals indicators: Carbon dioxide emissions (CO2), thousand metric tonnes of CO2 (collected by CDIAC)
- ^ Human-produced, direct emissions of carbon dioxide only. Excludes other greenhouse gases; land-use, land-use-change and forestry (LULUCF); and natural background flows of CO2 (See also: Carbon cycle)
- ^ excluding Taiwan, Macau and Hong Kong
- ^ UNFCCC Greenhouse Gas Inventory Data - Detailed data by Party
- ^ including San Marino
- ^ Including Monaco
- ^ CDIAC: Fossil-Fuel CO2 Emissions by Nation
External links
The contents of this article comes from the latest figures from the millennium indicators as of 2009-07-14:
- United Nation Statistics Division
- GHG data from UNFCCC - United Nations Framework Convention on Climate Change GHG emissions data
- Breathing Earth - A visual real-time simulation that uses this CO2 emissions data
- Global CO2 Emissions - Global CO2 emissions graphic
- Google - public data "CO2 emissions (kt)"
- Google - public data "CO2 emissions (metric tons per capita)"
Metallurgy Minerals Emissions Other Lists by country · List of international rankings · List of top international rankings by country Categories:- Carbon dioxide
- Lists of countries
- Greenhouse gas emissions
- Climate change-related lists
- International rankings


Wikimedia Foundation. 2010.