- Attribution of recent climate change
-
Attribution of recent climate change is the effort to scientifically ascertain mechanisms responsible for recent changes observed in the Earth's climate. The effort has focused on changes observed during the period of instrumental temperature record, when records are most reliable; particularly on the last 50 years, when human activity has grown fastest and observations of the troposphere have become available. The dominant mechanisms (to which recent climate change has been attributed) are the result of human activity. They are:[1]- increasing atmospheric concentrations of greenhouse gases
- global changes to land surface, such as deforestation
- increasing atmospheric concentrations of aerosols.
There are also natural mechanisms for variation including climate oscillations, changes in solar activity, variations in the Earth's orbit, and volcanic activity.
Attribution of recent change to anthropogenic forcing is based on the following facts:
- The observed change is not consistent with natural variability.
- Known natural forcings would, if anything, be negative over this period.
- Known anthropogenic forcings are consistent with the observed response.
- The pattern of the observed change is consistent with the anthropogenic forcing.
Recent reports from the Intergovernmental Panel on Climate Change (IPCC) have concluded that:
- "Most of the observed increase in globally averaged temperatures since the mid-20th century is very likely due to the observed increase in anthropogenic greenhouse gas concentrations";[2] It is extremely unlikely (<5%) that the global pattern of warming during the past half century can be explained without external forcing (i.e., it is inconsistent with being the result of internal variability), and very unlikely that it is due to known natural external causes alone. The warming occurred in both the ocean and the atmosphere and took place at a time when natural external forcing factors would likely have produced cooling.[3]
- "From new estimates of the combined anthropogenic forcing due to greenhouse gases, aerosols, and land surface changes, it is extremely likely that human activities have exerted a substantial net warming influence on climate since 1750."[4]
- "It is virtually certain that anthropogenic aerosols produce a net negative radiative forcing (cooling influence) with a greater magnitude in the Northern Hemisphere than in the Southern Hemisphere.[5]
The panel defines "very likely," "extremely likely," and "virtually certain" as indicating probabilities greater than 90%, 95%, and 99%, respectively.[6] The IPCC's attribution of recent global warming to human activities is a view shared by most scientists,[7][8]:2 and is also supported by a number of scientific organizations (see scientific opinion on climate change).
Contents
Background
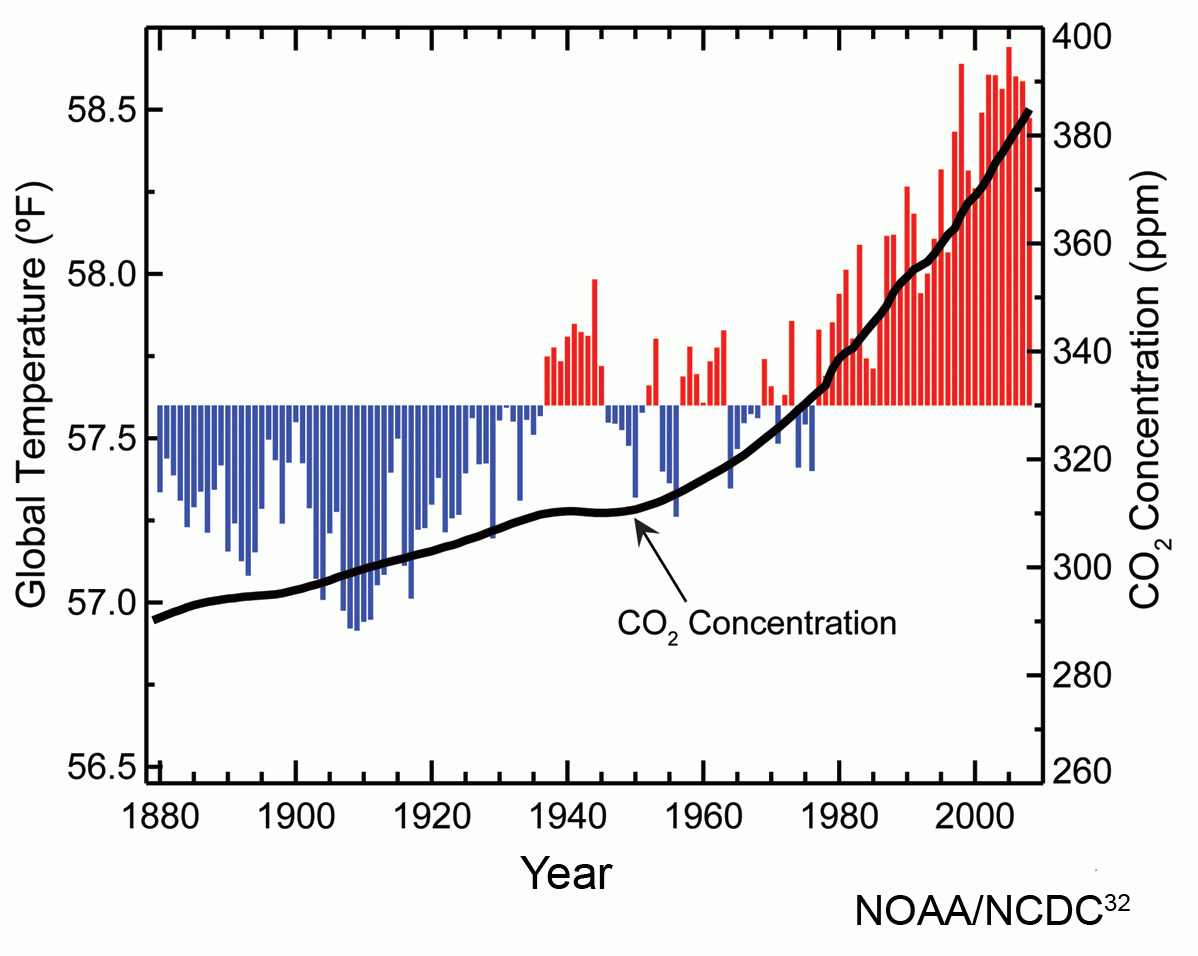
Main article: climate change#Causes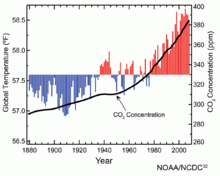 Atmospheric CO2 concentrations and global annual average temperatures over the years 1880 to 2009.
This section introduces some concepts in climate science that are used in the following sections:
Factors affecting Earth's climate can be broken down into feedbacks and forcings.[8]:7 A forcing is something that is imposed externally on the climate system. External forcings include natural phenomena such as volcanic eruptions and variations in the sun's output.[9] Human activities can also impose forcings, for example, through changing the composition of the atmosphere.
Radiative forcing is a measure of how various factors alter the energy balance of the Earth's atmosphere.[10] A positive radiative forcing will tend to increase the energy of the Earth-atmosphere system, leading to a warming of the system. Between the start of the Industrial Revolution in 1750, and the year 2005, the increase in the atmospheric concentration of carbon dioxide (chemical formula: CO2) lead to a positive radiative forcing, averaged over the Earth's surface area, of about 1.66 watts per square metre (abbreviated W m-2). [11]
Climate feedbacks can either amplify or dampen the response of the climate to a given forcing.[8]:7 There are many feedback mechanisms in the climate system that can either amplify (a positive feedback) or diminish (a negative feedback) the effects of a change in climate forcing.
Aspects of the climate system will show variation in response to changes in forcings.[12] In the absence of forcings imposed on it, the climate system will still show internal variability. This internal variability is a result of complex interactions between components of the climate system, such as the coupling between the atmosphere and ocean.[13] An example of internal variability is the El Niño-Southern Oscillation.
Key attributions
Greenhouse gases
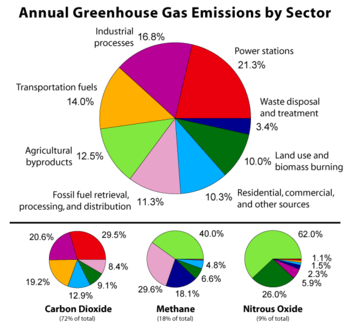 Emission Database for Global Atmospheric Research version 3.2, fast track 2000 project
Scientific consensus has identified carbon dioxide as the dominant greenhouse gas forcing. (The dominant greenhouse gas overall is water vapor. Water vapor, however, has a very short atmospheric lifetime (about 10 days) and is very nearly in a dynamic equilibrium in the atmosphere, so it is not a forcing gas in the context of global warming.[14]) Methane and nitrous oxide are also major forcing contributors to the greenhouse effect. The Kyoto Protocol lists these together with hydrofluorocarbons (HFCs), perfluorocarbons (PFCs), and sulphur hexafluoride (SF6),[15] which are entirely artificial (i.e. anthropogenic) gases which also contribute to radiative forcing in the atmosphere. The chart at right attributes anthropogenic greenhouse gas emissions to eight main economic sectors, of which the largest contributors are power stations (many of which burn coal or other fossil fuels), industrial processes (among which cement production is a dominant contributor[16]), transportation fuels (generally fossil fuels), and agricultural by-products (mainly methane from enteric fermentation and nitrous oxide from fertilizer use).
Land use
Climate change is attributed to land use for two main reasons. While 66% of anthropogenic CO2 emissions over the last 250 years have resulted from burning fossil fuels, 33% have resulted from changes in land use, primarily deforestation.[17] Deforestation both reduces the amount of carbon dioxide absorbed by deforested regions and releases greenhouse gases directly, together with aerosols, through biomass burning that frequently accompanies it. A second reason that climate change has been attributed to land use is that the terrestrial albedo is often altered by use, which leads to radiative forcing. This effect is more significant locally than globally.[18]
Livestock and land use
Worldwide, livestock production occupies 70% of all land used for agriculture, or 30% of the ice-free land surface of the Earth.[19] More than 18% of anthropogenic greenhouse gas emissions are attributed to livestock and livestock-related activities such as deforestation and increasingly fuel-intensive farming practices.[19] Specific attributions to the livestock sector include:
- 9% of global anthropogenic carbon dioxide emissions
- 35–40% of global anthropogenic methane emissions (chiefly due to enteric fermentation and manure)
- 64% of global anthropogenic nitrous oxide emissions, chiefly due to fertilizer use.[19]
Aerosols
With virtual certainty, scientific consensus has attributed various forms of climate change, chiefly cooling effects, to aerosols, which are small particles or droplets suspended in the atmosphere.[20] Key sources to which anthropogenic aerosols are attributed[21] include:
- biomass burning such as slash and burn deforestation. Aerosols produced are primarily black carbon.
- industrial air pollution, which produces soot and airborne sulfates, nitrates, and ammonium
- dust produced by land use effects such as desertification
Attribution of 20th century climate change
IPCC Assessment reports: First (1990) 1992 sup. Second (1995) Third (2001) Fourth (2007) Fifth (2014) UNFCCC | WMO | UNEP  One global climate model's reconstruction of temperature change during the 20th century as the result of five studied forcing factors and the amount of temperature change attributed to each.
Over the past 150 years human activities have released increasing quantities of greenhouse gases into the atmosphere. This has led to increases in mean global temperature, or global warming. Other human effects are relevant—for example, sulphate aerosols are believed to have a cooling effect. Natural factors also contribute. According to the historical temperature record of the last century, the Earth's near-surface air temperature has risen around 0.74 ± 0.18 °Celsius (1.3 ± 0.32 °Fahrenheit).
A historically important question in climate change research has regarded the relative importance of human activity and non-anthropogenic causes during the period of instrumental record. In the 1995 Second Assessment Report (SAR), the IPCC made the widely quoted statement that "The balance of evidence suggests a discernible human influence on global climate". The phrase "balance of evidence" suggested the (English) common-law standard of proof required in civil as opposed to criminal courts: not as high as "beyond reasonable doubt". In 2001 the Third Assessment Report (TAR) refined this, saying "There is new and stronger evidence that most of the warming observed over the last 50 years is attributable to human activities".[22] The 2007 Fourth Assessment Report (AR4) strengthened this finding:
- "Anthropogenic warming of the climate system is widespread and can be detected in temperature observations taken at the surface, in the free atmosphere and in the oceans. Evidence of the effect of external influences, both anthropogenic and natural, on the climate system has continued to accumulate since the TAR."[23])
Over the past five decades there has been a global warming of approximately 0.65 °C (1.17 °F) at the Earth's surface (see historical temperature record). Among the possible factors that could produce changes in global mean temperature are internal variability of the climate system, external forcing, an increase in concentration of greenhouse gases, or any combination of these. Current studies indicate that the increase in greenhouse gases, most notably CO2, is mostly responsible for the observed warming. Evidence for this conclusion includes:
- Estimates of internal variability from climate models, and reconstructions of past temperatures, indicate that the warming is unlikely to be entirely natural.
- Climate models forced by natural factors and increased greenhouse gases and aerosols reproduce the observed global temperature changes; those forced by natural factors alone do not.[24]
- "Fingerprint" methods indicate that the pattern of change is closer to that expected from greenhouse gas-forced change than from natural change.[25]
- The plateau in warming from the 1940s to 1960s can be attributed largely to sulphate aerosol cooling.[26]
Detection vs. attribution
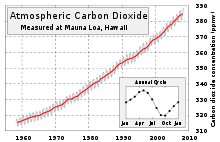 This graph is known as the "Keeling Curve" and it shows the long-term increase of atmospheric carbon dioxide (CO2) concentrations from 1958-2008. Monthly CO2 measurements display seasonal oscillations in an upward trend; each year's maximum occurs during the Northern Hemisphere's late spring, and declines during its growing season as plants remove some atmospheric CO2.
Detection and attribution of climate signals, as well as its common-sense meaning, has a more precise definition within the climate change literature, as expressed by the IPCC.[27]
Detection of a signal requires demonstrating that an observed change is statistically significantly different from that which can be explained by natural internal variability.
Attribution requires demonstrating that a signal is:
- unlikely to be due entirely to internal variability;
- consistent with the estimated responses to the given combination of anthropogenic and natural forcing
- not consistent with alternative, physically plausible explanations of recent climate change that exclude important elements of the given combination of forcings.
Detection does not imply attribution, and is easier to show than attribution. Unequivocal attribution would require controlled experiments with multiple copies of the climate system, which is not possible. Therefore, attribution, as described above, can only be done within some margin of error. For example, the IPCC's Fourth Assessment Report says "it is extremely likely that human activities have exerted a substantial net warming influence on climate since 1750," where "extremely likely" indicates a probability greater than 95%.[28]
Following the publication of the Third Assessment Report (TAR) in 2001, "detection and attribution" of climate change has remained an active area of research. Some important results include:
- A review of detection and attribution studies by the International Ad Hoc Detection and Attribution Group[29] found that "natural drivers such as solar variability and volcanic activity are at most partially responsible for the large-scale temperature changes observed over the past century, and that a large fraction of the warming over the last 50 yr can be attributed to greenhouse gas increases. Thus, the recent research supports and strengthens the IPCC Third Assessment Report conclusion that 'most of the global warming over the past 50 years is likely due to the increase in greenhouse gases.'"
- Multiple independent reconstructions of the temperature record of the past 1000 years confirm that the late 20th century is probably the warmest period in that time
- Two papers in the journal Science in August 2005[30][31] resolve the problem, evident at the time of the TAR, of tropospheric temperature trends. The UAH version of the record contained errors, and there is evidence of spurious cooling trends in the radiosonde record, particularly in the tropics. See satellite temperature measurements for details; and the 2006 US CCSP report.[32]
- Barnett and colleagues say that the observed warming of the oceans "cannot be explained by natural internal climate variability or solar and volcanic forcing, but is well simulated by two anthropogenically forced climate models," concluding that "it is of human origin, a conclusion robust to observational sampling and model differences"[33]
Scientific literature and opinion
Main article: Scientific opinion on climate changeThere are a number of examples of published and informal support for the consensus view. The IPCC's Assessment Reports have informed the United Nations Framework Convention on Climate Change,[34] and each assessment has considered the role of human activities on the climate.[35] The IPCC's First Assessment Report, published in 1990, was unable to distinguish a human influence on the climate. The later Second Assessment Report, published in 1996, concluded that human influences had had a "discernable" effect on the climate. More evidence of human-induced climate change was found in the third and fourth Assessment Reports, published in 2001 and 2007, respectively.
The IPCC's conclusions are consistent with those of several reports produced by the US National Research Council.[7][36][37] A report published in 2009 by the U.S. Global Change Research Program concluded that "[global] warming is unequivocal and primarily human-induced."[38] A number of scientific organizations have issued statements that support the consensus view. Two examples include:
- a joint statement made in 2005 by the national science academies of the G8, and Brazil, China and India;[39]
- a joint statement made in 2008 by the Network of African Science Academies.[40]
Individual papers
- An essay in Science surveyed 928 abstracts related to climate change, and concluded that most journal reports accepted the consensus.[41] This is discussed further in scientific opinion on climate change.
- A 2002 paper in the Journal of Geophysical Research says "Our analysis suggests that the early twentieth century warming can best be explained by a combination of warming due to increases in greenhouse gases and natural forcing, some cooling due to other anthropogenic forcings, and a substantial, but not implausible, contribution from internal variability. In the second half of the century we find that the warming is largely caused by changes in greenhouse gases, with changes in sulphates and, perhaps, volcanic aerosol offsetting approximately one third of the warming."[42][43]
- In 1996, in a paper in Nature titled "A search for human influences on the thermal structure of the atmosphere", Benjamin D. Santer et al. wrote: "The observed spatial patterns of temperature change in the free atmosphere from 1963 to 1987 are similar to those predicted by state-of-the-art climate models incorporating various combinations of changes in carbon dioxide, anthropogenic sulphate aerosol and stratospheric ozone concentrations. The degree of pattern similarity between models and observations increases through this period. It is likely that this trend is partially due to human activities, although many uncertainties remain, particularly relating to estimates of natural variability."
A small minority of scientists do disagree with the consensus: see list of scientists opposing global warming consensus. For example Willie Soon and Richard Lindzen[44] say that there is insufficient proof for anthropogenic attribution. Generally this position requires new physical mechanisms to explain the observed warming.[45]
Difficulties in attribution
At the time of the IPCC Fourth Assessment Report, attribution was possible for a number of observed changes in the climate (see effects of global warming). However, attribution was found to be more difficult when assessing changes over smaller regions (less than continental scale) and over short time periods (less than 50 years).[46] Over larger regions, averaging reduces natural variability of the climate, making detection and attribution easier.
Solar activity
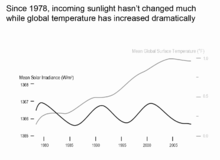
The role of the sun in recent climate change has been looked at by climate scientists. Since 1978, output from the Sun has been precisely measured by satellites.[8]:6 These measurements indicate that the Sun's output has not increased since 1978, so the warming during the past 30 years cannot be attributed to an increase in solar energy reaching the Earth (see the graph opposite). In the three decades since 1978, the combination of solar and volcanic activity probably had a slight cooling influence on the climate.[47]
Climate models have been used to examine the role of the sun in recent climate change.[48] Models are unable to reproduce the rapid warming observed in recent decades when they only take into account variations in solar output and volcanic activity. Models are, however, able to simulate the observed 20th century changes in temperature when they include all of the most important external forcings, including human influences and natural forcings. As has already been stated, Hegerl et al. (2007) concluded that greenhouse gas forcing had "very likely" caused most of the observed global warming since the mid-20th century. In making this conclusion, Hegerl et al. (2007) allowed for the possibility that climate models had been underestimated the effect of solar forcing.[49]
The role of solar activity in climate change has also been calculated over longer time periods using "proxy" datasets, such as tree rings.[50] Models indicate that solar and volcanic forcings can explain periods of relative warmth and cold between A.D. 1000 and 1900, but human-induced forcings are needed to reproduce the late-20th century warming.[51]
Another line of evidence against the sun having caused recent climate change comes from looking at how temperatures at different levels in the Earth's atmosphere have changed.[52] Models and observations show that greenhouse warming results in warming of the lower atmosphere (called the troposphere) but cooling of the upper atmosphere (called the stratosphere).[53] Depletion of the ozone layer by chemical refrigerants has also resulted in a strong cooling effect in the stratosphere. If the sun was responsible for observed warming, warming of both the troposphere and stratosphere would be expected.[54]
Non-consensus views
See also: extraterrestrial atmospheresHabibullo Abdussamatov (2004), head of space research at St. Petersburg's Pulkovo Astronomical Observatory in Russia, has argued that the sun is responsible for recently observed climate change.[55] Journalists for news sources canada.com (Solomon, 2007b),[56] National Geographic News (Ravillious, 2007),[57] and LiveScience (Than, 2007)[58] reported on the story of warming on Mars. In these articles, Abdussamatov was quoted. He stated that warming on Mars was evidence that global warming on Earth was being caused by changes in the sun.
Ravillious (2007)[57] quoted two scientists who disagreed with Abdussamatov: Amato Evan, a climate scientist at the University of Wisconsin-Madison, in the US, and Colin Wilson, a planetary physicist at Oxford University in the UK. According to Wilson, "Wobbles in the orbit of Mars are the main cause of its climate change in the current era" (see also orbital forcing).[59] Than (2007) quoted Charles Long, a climate physicist at Pacific Northwest National Laboratories in the US, who disagreed with Abdussamatov.[58]
Than (2007) pointed to the view of Benny Peiser, a social anthropologist at Liverpool John Moores University in the UK.[58]
In his newsletter, Peiser had cited a blog which had commented on warming observed on several planetary bodies in the Solar system. These included Neptune's moon Triton,[60] Jupiter,[61] Pluto[62] and Mars. In an e-mail interview with Than (2007), Peiser stated that:
“I think it is an intriguing coincidence that warming trends have been observed on a number of very diverse planetary bodies in our solar system, (...) Perhaps this is just a fluke.”
Than (2007) provided alternative explanations of why warming had occurred on Triton, Pluto, Jupiter and Mars.
The US Environmental Protection Agency (US EPA, 2009) responded to public comments on climate change attribution..[63] A number of commenters had argued that recent climate change could be attributed to changes in solar irradiance. According to the US EPA (2009), this attribution was not supported by the bulk of the scientific literature. Citing the work of the IPCC (2007), the US EPA pointed to the low contribution of solar irradiance to radiative forcing since the start of the Industrial Revolution in 1750. Over this time period (1750 to 2005),[64]
the estimated contribution of solar irradiance to radiative forcing was 5% the value of the combined radiative forcing due to increases in the atmospheric concentrations of carbon dioxide, methane and nitrous oxide.
Earlier climate changes
 Fluctuations in temperature and atmospheric concentration of CO2 over the past 649,000 years.
Factors other than increased CO2 concentrations can initiate warming or cooling episodes (see, e.g., orbital forcing). The ice core record shows that on some occasions temperature starts rising hundreds of years before CO2 increases.[clarification needed][65][66] Such results confirm that the relationship between CO2 and climate can go in both directions: changes in CO2 concentrations affect climate, while changes in climate can affect CO2 concentrations. One proposed mechanism for this effect is increased release of sequestered CO2 from oceans as circulation patterns shift, perhaps abruptly, in response to climate change.[67][68]
A more speculative and polemical inference sometimes drawn is that the causal relationship between temperature rises and global CO2 concentrations is only one-way, so that historical increases in CO2 have been nothing more than the product of independently rising temperatures.[69] However, a strictly "one-way" view of the relationship between CO2 and temperature contradicts basic results in physics, specifically the fact that the absorption and emission of infrared radiation by CO2 increases as its atmospheric concentration increases.[70][71]
First principles as well as empirical observation suggest that positive feedbacks from CO2 concentrations amplify warming initially caused by other factors:
Close analysis of the relationship between the two curves [i.e., temperature and CO2] shows that, within the uncertainties of matching their timescales, the temperature led by a few centuries. This is expected, since it was changes in the Earth’s orbital parameters (including the shape of its orbit around the Sun, and the tilt of Earth’s axis) that caused the small initial temperature rise. This then raised atmospheric CO2 levels, in part by outgassing from the oceans, causing the temperature to rise further. By amplifying each other’s response, this "positive feedback" can turn a small initial perturbation into a large climate change. There is therefore no surprise that the temperature and CO2 rose in parallel, with the temperature initially in advance. In the current case, the situation is different, because human actions are raising the CO2 level, and we are starting to observe the temperature response.[72]
Present CO2 levels greatly exceed the range found in the ice core data. Isotopic analysis of atmospheric CO2 confirms that fossil fuel burning is the source of most of the CO2 increase, unlike during prior interglacial periods.[73] As noted above, models that include increased CO2 levels when simulating recent climate match the observed data far better than those that do not.[74]
See also
- Aviation and climate change
- Climate attribution
Notes
- ^ IPCC AR4 WG1 2007[page needed]
- ^ IPCC AR4 WG1 2007, Summary for Policymakers, p. ?[page needed]
- ^ IPCC AR4 WG1 2007, Chapter 9, p. ?[page needed]
- ^ IPCC AR4 WG1 2007[page needed]
- ^ IPCC AR4 WG1 2007[page needed]
- ^ IPCC AR4 WG1 2007[page needed]
- ^ a b Committee on the Science of Climate Change, US National Research Council (2001). "Summary". Climate Change Science: An Analysis of Some Key Questions. National Academy Press, Washington, D.C., USA. pp. 1–3. ISBN 0-309-07574-2. http://www.nap.edu/openbook.php?record_id=10139&page=1. Retrieved 2011-05-20. "The IPCC’s conclusion that most of the observed warming of the last 50 years is likely to have been due to the increase in greenhouse gas concentrations accurately reflects the current thinking of the scientific community on this issue" (page 3).
- ^ a b c d US National Research Council (2008) (PDF). Understanding and responding to climate change: Highlights of National Academies Reports, 2008 edition. 500 Fifth St. N.W., Washington, D.C. 20001: National Academy of Sciences. http://americasclimatechoices.org/climate_change_2008_final.pdf. Retrieved 2011-05-20. "Most scientists agree that the warming in recent decades has been caused primarily by human activities that have increased the amount of greenhouse gases in the atmosphere [...]" (page 2).
- ^ IPCC AR4 WG1 2007, FAQ 1.1, What Factors Determine Earth’s Climate?.
- ^ IPCC AR4 WG1 2007, FAQ 2.1, How do Human Activities Contribute to Climate Change and How do They Compare with Natural Influences?.
- ^ IPCC AR4 WG1 2007, Summary for Policymakers, Figure SPM.2.
- ^ Committee on the Science of Climate Change, US National Research Council (2001). "2. Natural Climatic Variations". Climate Change Science: An Analysis of Some Key Questions. Washington, D.C., USA: National Academy Press. p. 8. ISBN 0-309-07574-2. http://www.nap.edu/openbook.php?record_id=10139&page=8. Retrieved 2011-05-20.
- ^ IPCC TAR WG1 2007, Technical Summary, Box 1: What drives changes in climate?.[verification needed]
- ^ Schmidt, Gavin A. (2005-04-06). "Water vapour: feedback or forcing?". RealClimate. http://www.realclimate.org/index.php?p=142. Retrieved 2008-04-07.
- ^ "The Kyoto Protocol". UNFCCC. http://unfccc.int/resource/docs/convkp/kpeng.html.
- ^ IPCC AR4 WG1 2007, Technical Summary p. ?.[page needed]
- ^ IPCC AR4 WG1 2007, Technical Summary p. ?.[page needed]
- ^ IPCC AR4 WG1 2007, Technical Summary p. ?.[page needed]
- ^ a b c Food and Agriculture Organization of the United Nations. Henning Steinfeld .... (2006) (PDF). Livestock's Long Shadow. Food and Agricultural Organization of the U.N.. ISBN 9251055718. http://www.virtualcentre.org/en/library/key_pub/longshad/A0701E00.pdf.
- ^ edited by Susan Solomon ... (2007) (PDF). Working Group I: The Physical Basis for Climate Change (Front matter). IPCC. ISBN 978-0-521-88009-1. http://www.ipcc.ch/pdf/assessment-report/ar4/wg1/ar4-wg1-frontmatter.pdf.[verification needed]
- ^ Geerts, B.. "Aerosols and Climate". http://www-das.uwyo.edu/~geerts/cwx/notes/chap02/aerosol&climate.html.[verification needed]
- ^ IPCC TAR WG1 2001, Summary for Policymakers.[page needed]
- ^ IPCC AR4 WG1 2007, Technical Summary, p. ?.[page needed]
- ^ IPCC TAR WG1 2001, Summary for Policymakers.[page needed]
- ^ IPCC TAR WG1 2001 Section 12.4.3, Optimal Fingerprint Methods.
- ^ IPCC TAR WG1 2001 Figure 4, Simulated annual global mean surface temperatures.
- ^ IPCC TAR WG1 2001, Section 12.1.1: The Meaning of Detection and Attribution.
- ^ IPCC AR4 WG1 2007[page needed]
- ^ Barnett, T. (May 2005). "Detecting and Attributing External Influences on the Climate System: A Review of Recent Advances" (PDF). Journal of Climate 18 (9): 1291–1314. Bibcode 2005JCli...18.1291.. doi:10.1175/JCLI3329.1. http://www.llnl.gov/tid/lof/documents/pdf/315840.pdf.
- ^ Schmidt, Gavin A. (2007-08-11). "Et Tu LT?". RealClimate.org. http://www.realclimate.org/index.php?p=170.
- ^ Schmidt, Gavin A. (2007-08-11). "The tropical lapse rate quandary". RealClimate.org. http://www.realclimate.org/index.php?p=179.
- ^ Wigley, Tom M. L. (2006-05-02) (PDF). Temperature Trends in the Lower Atmosphere — Understanding and Reconciling Differences (Executive Summary). NOAA. http://www.climatescience.gov/Library/sap/sap1-1/finalreport/sap1-1-final-execsum.pdf.
- ^ Barnett TP, Pierce DW, Achutarao KM, et al. (July 2005). "Penetration of human-induced warming into the world's oceans". Science 309 (5732): 284–7. Bibcode 2005Sci...309..284B. doi:10.1126/science.1112418. PMID 15933161.
- ^ Houghton 2002.
- ^ IPCC AR4 WG1 2007, Section 9.1.3: The Basis from which We Begin.
- ^ Committee on Surface Temperature Reconstructions for the Last 2,000 Years, US National Research Council (2006). "Overview". Surface Temperature Reconstructions for the Last 2,000 Years. National Academy Press, Washington, D.C., USA. pp. 21–22. ISBN 0-309-66144-7. http://books.nap.edu/openbook.php?record_id=11676&page=21. Retrieved 2011-05-20.
- ^ Panel on Advancing the Science of Climate Change; US National Research Council (2010). "Summary". Advancing the Science of Climate Change. National Academy Press, Washington, D.C., USA. p. 3. ISBN 978-0-309-14588-6. http://books.nap.edu/openbook.php?record_id=12782&page=3. Retrieved 2011-05-20.
- ^ Karl & others 2009, Excutive Summary, p. 12.
- ^ "Joint science academies’ statement: Global response to climate change". UK Royal Society website. 7 June 2005. http://royalsociety.org/Joint-science-academies-statement-Global-response-to-climate-change/. Retrieved 2011-05-20.
- ^ "Joint statement by NASAC to the G8 on sustainability, energy efficiency and climate change". UK Royal Society website. 1 June 2007. http://royalsociety.org/Joint-statement-by-NASAC-to-the-G8-on-sustainability-energy-efficiency-and-climate-change/. Retrieved 2011-05-20.
- ^ Oreskes N (December 2004). "Beyond the ivory tower. The scientific consensus on climate change". Science 306 (5702): 1686. doi:10.1126/science.1103618. PMID 15576594.
- ^ Tett SFB; et al. (2002). "Estimation of natural and anthropogenic contributions to twentieth century temperature change". J. Geophys. Res. 107 (D16): 4306. Bibcode 2002JGRD..107.4306T. doi:10.1029/2000JD000028. http://www.agu.org/pubs/crossref/2002/2000JD000028.shtml.
- ^ William Connolley (27 May 2003). "Estimation of natural and anthropogenic contributions to twentieth century temperature change". sci.environment. (Web link).
- ^ Lindzen RS (August 1997). "Can increasing carbon dioxide cause climate change?". Proceedings of the National Academy of Sciences of the United States of America 94 (16): 8335–42. Bibcode 1997PNAS...94.8335L. doi:10.1073/pnas.94.16.8335. PMC 33750. PMID 11607742. http://www.pnas.org/cgi/pmidlookup?view=long&pmid=11607742.
- ^ for example: Soon, W.; Posmentier, E.; Baliunas, S. (2000). "Climate hypersensitivity to solar forcing?". Annales Geophysicae 18 (5): 583. Bibcode 2000AnGeo..18..583S. doi:10.1007/s00585-000-0583-z.
- ^ IPCC AR4 WG1 2007, Chapter 9: Understanding and Attributing Climate Change, Executive Summary.
- ^ Global Climate Change, in Karl & others 2009, pp. 15-16.
- ^ IPCC AR4 WG1 2007, Frequently Asked Question 9.2: Can the Warming of the 20th century be Explained by Natural Variability?.
- ^ IPCC AR4 WG1 2007, Chapter 9: Understanding and Attributing Climate Change, Executive Summary.
- ^ Simmon, R. and D. Herring (November 2009). "Notes for slide number 5 titled "Over 100 years of total solar irradiance data," in presentation, "Human contributions to global climate change"". Presentation library on the U.S. National Oceanic and Atmospheric Administration's Climate Services website. http://www.climate.gov/#understandingClimate/presentationLibrary. Retrieved 2011-06-23.
- ^ Committee on Surface Temperature Reconstructions for the Last 2,000 Years, US National Research Council (2006). "10. Climate Forcings and Climate Models". Surface Temperature Reconstructions for the Last 2,000 Years. Washington, D.C., USA: National Academy Press. p. 109. ISBN 0-309-66144-7. http://books.nap.edu/openbook.php?record_id=11676&page=109. Retrieved 2011-06-23.
- ^ Simmon, R. and D. Herring (November 2009). "Notes for slide number 7, titled "Satellite evidence also suggests greenhouse gas warming," in presentation, "Human contributions to global climate change"". Presentation library on the U.S. National Oceanic and Atmospheric Administration's Climate Services website. http://www.climate.gov/#understandingClimate/presentationLibrary. Retrieved 2011-06-23.
- ^ IPCC AR4 WG1 2007, Frequently Asked Question 9.2: Can the Warming of the 20th century be Explained by Natural Variability?.
- ^ Karl & others 2009, p. 20.
- ^ Abdussamatov, Habibullo I. (June 2004). "About the long-term coordinated variations of the activity, radius, total irradiance of the Sun and the Earth's climate". Proceedings of the International Astronomical Union 223: 541–542. doi:10.1017/S1743921304006775. http://journals.cambridge.org/action/displayFulltext?type=6&fid=395857&jid=IAU&volumeId=2004&issueId=IAUS223&aid=288608&bodyId=&membershipNumber=&societyETOCSession=&fulltextType=RA&fileId=S1743921304006775. "The main cause of climate change during the last millennia is the corresponding cyclic variation of the 80- and 200-year component of irradiance correlated with activity. That is why, the contemporary (climate change) is not anomalous but is ordinary secular global warming."
- ^ Solomon, Lawrence (2 February 2007b). "Look to Mars for the truth on global warming". National Post. http://www.canada.com/nationalpost/story.html?id=edae9952-3c3e-47ba-913f-7359a5c7f723&k=0. Retrieved 2007-03-02.
- ^ a b Ravilious, Kate (2007-02-28). "Mars Melt Hints at Solar, Not Human, Cause for Warming, Scientist Says". National Geographic News. http://news.nationalgeographic.com/news/2007/02/070228-mars-warming.html.
- ^ a b c Than, Ker (2007-03-12). "Sun Blamed for Warming of Earth and Other Worlds". LiveScience.com. http://www.livescience.com/environment/070312_solarsys_warming.html.
- ^ See also: Fenton, Lori K.; Geissler, Paul E.; Haberle, Robert M. (2007-04-05). "Global warming and climate forcing by recent of albedo changes on Mars" (PDF). Nature 446 (7136): 646–649. Bibcode 2007Natur.446..646F. doi:10.1038/nature05718. PMID 17410170. http://humbabe.arc.nasa.gov/~fenton/pdf/fenton/nature05718.pdf. Retrieved 2007-05-09.
- ^ See also: "MIT researcher finds evidence of global warming on Neptune's largest moon". MIT. 1998-06-24. http://web.mit.edu/newsoffice/1998/triton.html.
- ^ See also: Goudarzi, Sara (2006-05-04). "New Storm on Jupiter Hints at Climate Change". Space.com. http://www.space.com/scienceastronomy/060504_red_jr.html.
- ^ See also: "Pluto is undergoing global warming, researchers find". MIT. 2002-10-09. http://web.mit.edu/newsoffice/2002/pluto.html.
- ^ US Environmental Protection Agency (2009). "3.2.2 Solar Irradiance". Volume 3: Attribution of Observed Climate Change. Endangerment and Cause or Contribute Findings for Greenhouse Gases under Section 202(a) of the Clean Air Act. EPA's Response to Public Comments. US Environmental Protection Agency. http://www.epa.gov/climatechange/endangerment/comments/volume3.html#2-2. Retrieved 2011-06-23.
- ^ IPCC AR4 WG1 2007, Summary for Policymakers, Figure SPM.2.
- ^ Indermühle, Andreas; Monnin, Eric; Stauffer, Bernhard; Stocker, Thomas F.; Wahlen, Martin (2000). "Atmospheric CO2concentration from 60 to 20 kyr BP from the Taylor Dome Ice Core, Antarctica". Geophysical Research Letters 27 (5): 735. Bibcode 2000GeoRL..27..735I. doi:10.1029/1999GL010960.
- ^ Fischer H, Wahlen M, Smith J, Mastroianni D, Deck B (March 1999). "Ice core records of atmospheric CO2 around the last three glacial terminations". Science 283 (5408): 1712–4. Bibcode 1999Sci...283.1712F. doi:10.1126/science.283.5408.1712. PMID 10073931. http://www.sciencemag.org/cgi/pmidlookup?view=long&pmid=10073931. "carbon dioxide concentrations increased by 80 to 100 parts per million by volume 600 ± 400 years after the warming of the last three deglaciations."
- ^ Skinner, L.C. (2006). "Glacial – interglacial atmospheric CO2 change: a simple "hypsometric effect" on deep-ocean carbon sequestration?" (PDF). Climate of the Past Discussions 2. http://www.clim-past-discuss.net/2/711/2006/cpd-2-711-2006.pdf.
- ^ Paillard, Didier (2001). "Glacial Cycles: Toward a New Paradigm". Reviews of Geophysics 39 (3): 325. Bibcode 2001RvGeo..39..325P. doi:10.1029/2000RG000091.
- ^ The Great Global Warming Swindle
- ^ Liou, K.N. (2002). An Introduction to Atmospheric Radiation (2nd ed.). Boston: Academic Press. ISBN 0-12-451451-0.[page needed]
- ^ Staley, D.O.; Jurica, G.M. (1970). "Flux Emissivity Tables for Water Vapor, Carbon Dioxide and Ozone". Journal of Applied Meteorology 9 (3): 365. Bibcode 1970JApMe...9..365S. doi:10.1175/1520-0450(1970)009<0365:FETFWV>2.0.CO;2. ISSN 1520-0450.
- ^ "News Story — BAS Statement about Channel 4 programme on Global Warming — British Antarctic Survey". Antarctica.ac.uk. http://www.antarctica.ac.uk/about_bas/news/news_story.php?id=178. Retrieved 2010-07-21.
- ^ IPCC SAR WG1 1996, Chapter ??: CO2 and the carbon cycle, pp. 76–86.[verification needed]
- ^ IPCC AR4 WG1 2007[page needed]
References
- Houghton, J. (2002), "An Overview of the Intergovernmental Panel on Climate Change (IPCC) and Its Process of Science Assessment", in Hester, R.E.; Harrison, R.M., Issues in Environmental Science and Technology, Global Environmental Change, 17, The Royal Society of Chemistry, ISBN 978-0-85404-280-7, http://www.rsc.org/ebooks/archive/free/BK9780854042807/BK9780854042807-00001.pdf.
- IPCC AR4 WG1 (2007), Solomon, S.; Qin, D.; Manning, M.; Chen, Z.; Marquis, M.; Averyt, K.B.; Tignor, M.; and Miller, H.L., ed., Climate Change 2007: The Physical Science Basis, Contribution of Working Group I to the Fourth Assessment Report of the Intergovernmental Panel on Climate Change, Cambridge University Press, ISBN 978-0-521-88009-1, http://www.ipcc.ch/publications_and_data/ar4/wg1/en/contents.html (pb: 978-0-521-70596-7).
- IPCC TAR WG1 (2001), Houghton, J.T.; Ding, Y.; Griggs, D.J.; Noguer, M.; van der Linden, P.J.; Dai, X.; Maskell, K.; and Johnson, C.A., ed., Climate Change 2001: The Scientific Basis, Contribution of Working Group I to the Third Assessment Report of the Intergovernmental Panel on Climate Change, Cambridge University Press, ISBN 0-521-80767-0, http://www.grida.no/publications/other/ipcc%5Ftar/?src=/climate/ipcc_tar/wg1/index.htm (pb: 0-521-01495-6).
- IPCC SAR WG1 (1996), Houghton, J.T.; Meira Filho, L.G.; Callander, B.A.; Harris, N.; Kattenberg, A., and Maskell, K., ed., Climate Change 1995: The Science of Climate Change, Contribution of Working Group I to the Second Assessment Report of the Intergovernmental Panel on Climate Change, Cambridge University Press, ISBN 0-521-56433-6, http://www.ipcc.ch/ipccreports/sar/wg_I/ipcc_sar_wg_I_full_report.pdf (pb: 0-521-56436-0).
- Karl, T.R.; Melillo. J.; Peterson, T.; Hassol, S.J., ed (2009). Global Climate Change Impacts in the United States. Cambridge University Press. ISBN 978-0-521-14407-0. http://www.globalchange.gov/publications/reports/scientific-assessments/us-impacts/full-report/global-climate-change..
Further reading
- RealClimate – Le Quéré, How much of the recent CO2 increase is due to human activities?, 2005
- Houghton, John Theodore, ed (2001). Climate Change 2001: The Scientific Basis: Contribution of Working Group I to the Third Assessment Report of the Intergovernmental Panel on Climate Change. Cambridge, UK: Cambridge University Press. ISBN 0-521-80767-0. http://www.grida.no/climate/ipcc_tar/wg1.
External links
- RealClimate – Blog on current climate change issues by active climatologists
- "The Climate of Man", The New Yorker (2005): Part 1, Part 2, Part 3
- Anthropogenic or Solar? by Shaviv
- Recent oppositely directed trends in solar climate forcings and the global mean surface air temperature by Mike Lockwood and Claus Frohlich
- US EPA climate change and global warming website
- ResearchChannel – How Do We Know? Physics, Forcings, and Fingerprints. A video by the National Science Foundation on climate change.
- Scientific American editors' blog – Extended discussion of climate attribution
Categories:- Global warming
- Climate change
- Environmental issues with energy


Wikimedia Foundation. 2010.