- Air pollution
-
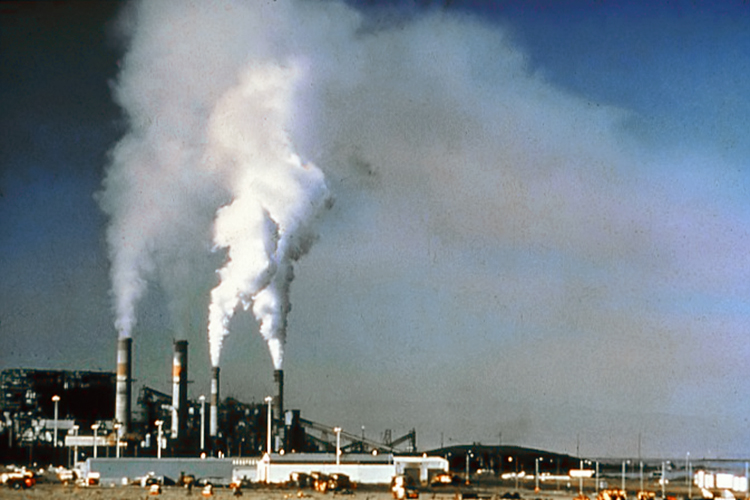
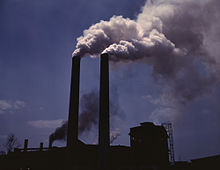 Air pollution from World War II production
 Smog over Santiago, Chile
Air pollution is the introduction of chemicals, particulate matter, or biological materials that cause harm or discomfort to humans or other living organisms, or cause damage to the natural environment or built environment, into the atmosphere.
The atmosphere is a complex dynamic natural gaseous system that is essential to support life on planet Earth. Stratospheric ozone depletion due to air pollution has long been recognized as a threat to human health as well as to the Earth's ecosystems.
Indoor air pollution and urban air quality are listed as two of the world's worst pollution problems in the 2008 Blacksmith Institute World's Worst Polluted Places report.[1]
Pollutants
Main articles: Pollutant and Greenhouse gas Before flue gas desulfurization was installed, the emissions fro this power plant in New Mexico contained excessive amounts of sulfur dioxide.
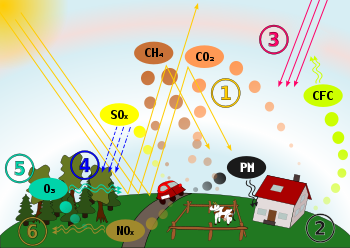 Schematic drawing, causes and effects of air pollution: (1) greenhouse effect, (2) particulate contamination, (3) increased UV radiation, (4) acid rain, (5) increased ground level ozone concentration, (6) increased levels of nitrogen oxides.
A substance in the air that can cause harm to humans and the environment is known as an air pollutant. Pollutants can be in the form of solid particles, liquid droplets, or gases. In addition, they may be natural or man-made.[2]
Pollutants can be classified as primary or secondary. Usually, primary pollutants are directly emitted from a process, such as ash from a volcanic eruption, the carbon monoxide gas from a motor vehicle exhaust or sulfur dioxide released from factories. Secondary pollutants are not emitted directly. Rather, they form in the air when primary pollutants react or interact. An important example of a secondary pollutant is ground level ozone — one of the many secondary pollutants that make up photochemical smog. Some pollutants may be both primary and secondary: that is, they are both emitted directly and formed from other primary pollutants.
Major primary pollutants produced by human activity include:
- Sulfur oxides (SOx) - especially sulphur dioxide, a chemical compound with the formula SO2. SO2 is produced by volcanoes and in various industrial processes. Since coal and petroleum often contain sulphur compounds, their combustion generates sulfur dioxide. Further oxidation of SO2, usually in the presence of a catalyst such as NO2, forms H2SO4, and thus acid rain.[2] This is one of the causes for concern over the environmental impact of the use of these fuels as power sources.
- Nitrogen oxides (NOx) - especially nitrogen dioxide are emitted from high temperature combustion. Can be seen as the brown haze dome above or plume downwind of cities. Nitrogen dioxide is the chemical compound with the formula NO2. It is one of the several nitrogen oxides. This reddish-brown toxic gas has a characteristic sharp, biting odor. NO2 is one of the most prominent air pollutants.
- Carbon monoxide - is a colourless, odorless, non-irritating but very poisonous gas. It is a product by incomplete combustion of fuel such as natural gas, coal or wood. Vehicular exhaust is a major source of carbon monoxide.
- Carbon dioxide (CO2) - a colourless, odorless, non-toxic greenhouse gas associated with ocean acidification, emitted from sources such as combustion, cement production, and respiration
- Volatile organic compounds - VOCs are an important outdoor air pollutant. In this field they are often divided into the separate categories of methane (CH4) and non-methane (NMVOCs). Methane is an extremely efficient greenhouse gas which contributes to enhanced global warming. Other hydrocarbon VOCs are also significant greenhouse gases via their role in creating ozone and in prolonging the life of methane in the atmosphere, although the effect varies depending on local air quality. Within the NMVOCs, the aromatic compounds benzene, toluene and xylene are suspected carcinogens and may lead to leukemia through prolonged exposure. 1,3-butadiene is another dangerous compound which is often associated with industrial uses.
- Particulate matter - Particulates, alternatively referred to as particulate matter (PM) or fine particles, are tiny particles of solid or liquid suspended in a gas. In contrast, aerosol refers to particles and the gas together. Sources of particulate matter can be man made or natural. Some particulates occur naturally, originating from volcanoes, dust storms, forest and grassland fires, living vegetation, and sea spray. Human activities, such as the burning of fossil fuels in vehicles, power plants and various industrial processes also generate significant amounts of aerosols. Averaged over the globe, anthropogenic aerosols—those made by human activities—currently account for about 10 percent of the total amount of aerosols in our atmosphere. Increased levels of fine particles in the air are linked to health hazards such as heart disease,[3] altered lung function and lung cancer.
- Persistent free radicals connected to airborne fine particles could cause cardiopulmonary disease.[4][5]
- Toxic metals, such as lead, cadmium and copper.
- Chlorofluorocarbons (CFCs) - harmful to the ozone layer emitted from products currently banned from use.
- Ammonia (NH3) - emitted from agricultural processes. Ammonia is a compound with the formula NH3. It is normally encountered as a gas with a characteristic pungent odor. Ammonia contributes significantly to the nutritional needs of terrestrial organisms by serving as a precursor to foodstuffs and fertilizers. Ammonia, either directly or indirectly, is also a building block for the synthesis of many pharmaceuticals. Although in wide use, ammonia is both caustic and hazardous.
- Odors — such as from garbage, sewage, and industrial processes
- Radioactive pollutants - produced by nuclear explosions, war explosives, and natural processes such as the radioactive decay of radon.
Secondary pollutants include:
- Particulate matter formed from gaseous primary pollutants and compounds in photochemical smog. Smog is a kind of air pollution; the word "smog" is a portmanteau of smoke and fog. Classic smog results from large amounts of coal burning in an area caused by a mixture of smoke and sulfur dioxide. Modern smog does not usually come from coal but from vehicular and industrial emissions that are acted on in the atmosphere by ultraviolet light from the sun to form secondary pollutants that also combine with the primary emissions to form photochemical smog.
- Ground level ozone (O3) formed from NOx and VOCs. Ozone (O3) is a key constituent of the troposphere. It is also an important constituent of certain regions of the stratosphere commonly known as the Ozone layer. Photochemical and chemical reactions involving it drive many of the chemical processes that occur in the atmosphere by day and by night. At abnormally high concentrations brought about by human activities (largely the combustion of fossil fuel), it is a pollutant, and a constituent of smog.
- Peroxyacetyl nitrate (PAN) - similarly formed from NOx and VOCs.
Minor air pollutants include:
- A large number of minor hazardous air pollutants. Some of these are regulated in USA under the Clean Air Act and in Europe under the Air Framework Directive.
- A variety of persistent organic pollutants, which can attach to particulate matter.
Persistent organic pollutants (POPs) are organic compounds that are resistant to environmental degradation through chemical, biological, and photolytic processes. Because of this, they have been observed to persist in the environment, to be capable of long-range transport, bioaccumulate in human and animal tissue, biomagnify in food chains, and to have potential significant impacts on human health and the environment.
Sources
Main article: AP 42 Compilation of Air Pollutant Emission Factors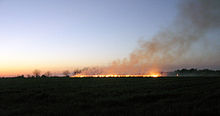
Sources of air pollution refer to the various locations, activities or factors which are responsible for the releasing of pollutants into the atmosphere. These sources can be classified into two major categories which are:
Anthropogenic sources (human activity) mostly related to burning different kinds of fuel
- "Stationary Sources" include smoke stacks of power plants, manufacturing facilities (factories) and waste incinerators, as well as furnaces and other types of fuel-burning heating devices
- "Mobile Sources" include motor vehicles, marine vessels, aircraft and the effect of sound etc.
- Chemicals, dust and controlled burn practices in agriculture and forestry management. Controlled or prescribed burning is a technique sometimes used in forest management, farming, prairie restoration or greenhouse gas abatement. Fire is a natural part of both forest and grassland ecology and controlled fire can be a tool for foresters. Controlled burning stimulates the germination of some desirable forest trees, thus renewing the forest.
- Fumes from paint, hair spray, varnish, aerosol sprays and other solvents
- Waste deposition in landfills, which generate methane. Methane is not toxic; however, it is highly flammable and may form explosive mixtures with air. Methane is also an asphyxiant and may displace oxygen in an enclosed space. Asphyxia or suffocation may result if the oxygen concentration is reduced to below 19.5% by displacement
- Military, such as nuclear weapons, toxic gases, germ warfare and rocketry
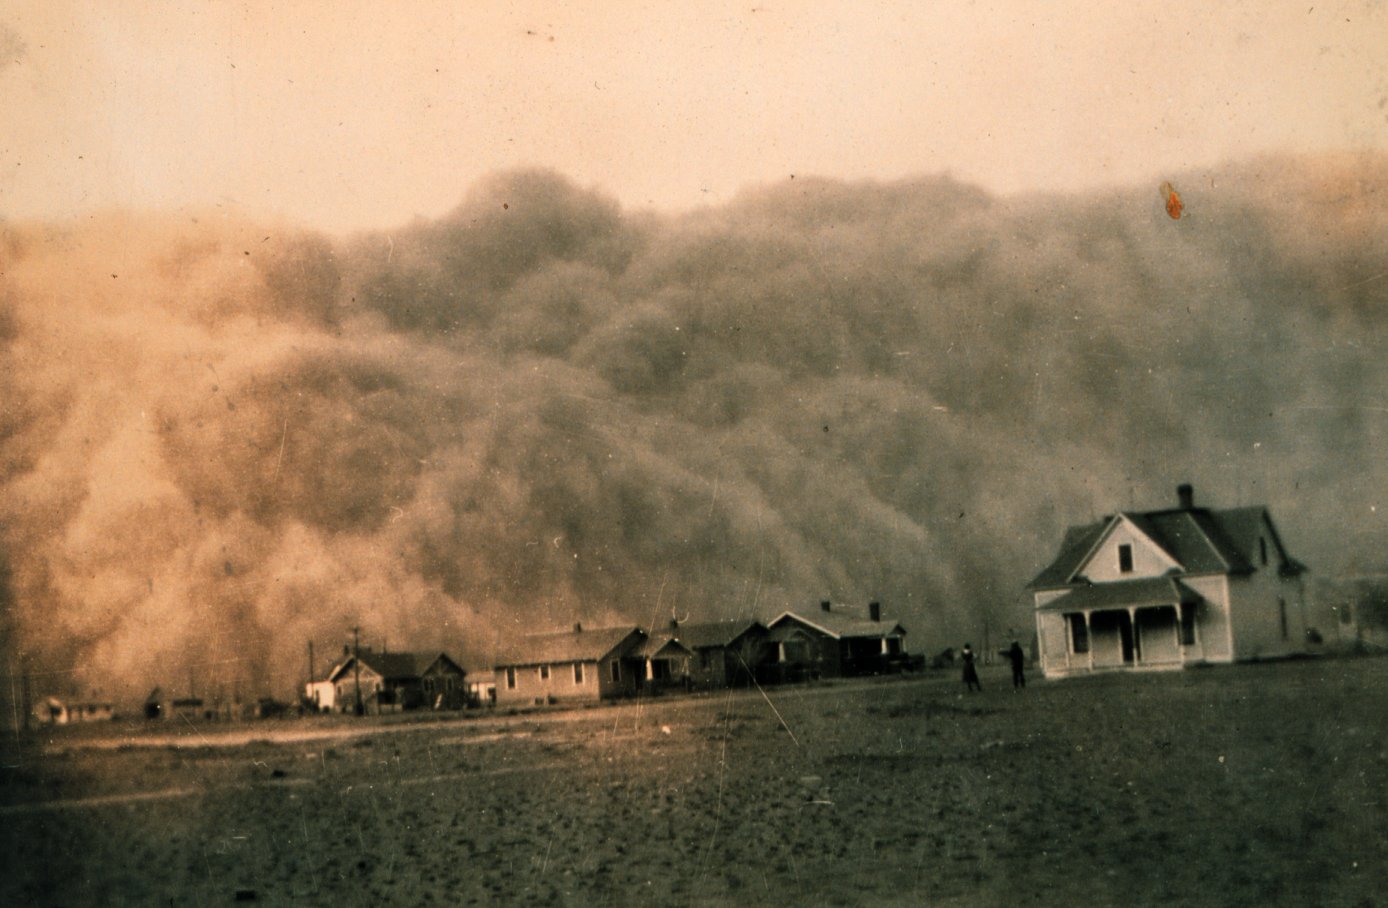
Natural sources
- Dust from natural sources, usually large areas of land with little or no vegetation
- Methane, emitted by the digestion of food by animals, for example cattle
- Radon gas from radioactive decay within the Earth's crust. Radon is a colorless, odorless, naturally occurring, radioactive noble gas that is formed from the decay of radium. It is considered to be a health hazard. Radon gas from natural sources can accumulate in buildings, especially in confined areas such as the basement and it is the second most frequent cause of lung cancer, after cigarette smoking
- Smoke and carbon monoxide from wildfires
- Vegetation, in some regions, emits environmentally significant amounts of VOCs on warmer days. These VOCs react with primary anthropogenic pollutants—specifically, NOx, SO2, and anthropogenic organic carbon compounds—to produce a seasonal haze of secondary pollutants.[6]
- Volcanic activity, which produce sulfur, chlorine, and ash particulates
Emission factors
Main article: AP 42 Compilation of Air Pollutant Emission FactorsAir pollutant emission factors are representative values that people attempt to relate the quantity of a pollutant released to the ambient air with an activity associated with the release of that pollutant. These factors are usually expressed as the weight of pollutant divided by a unit weight, volume, distance, or duration of the activity emitting the pollutant (e.g., kilograms of particulate emitted per megagram of coal burned). Such factors facilitate estimation of emissions from various sources of air pollution. In most cases, these factors are simply averages of all available data of acceptable quality, and are generally assumed to be representative of long-term averages.
There are 12 compounds in the list of POPs. Dioxins and furans are two of them and are intentionally created by combustion of organics, like open burning of plastics. The POPs are also endocrine disruptor and can mutate the human genes.
The United States Environmental Protection Agency has published a compilation of air pollutant emission factors for a multitude of industrial sources.[7] The United Kingdom, Australia, Canada and many other countries have published similar compilations, as well as the European Environment Agency.[8][9][10][11][12]
Indoor air quality (IAQ)
Main article: Indoor air qualityA lack of ventilation indoors concentrates air pollution where people often spend the majority of their time. Radon (Rn) gas, a carcinogen, is exuded from the Earth in certain locations and trapped inside houses. Building materials including carpeting and plywood emit formaldehyde (H2CO) gas. Paint and solvents give off volatile organic compounds (VOCs) as they dry. Lead paint can degenerate into dust and be inhaled. Intentional air pollution is introduced with the use of air fresheners, incense, and other scented items. Controlled wood fires in stoves and fireplaces can add significant amounts of smoke particulates into the air, inside and out.[13] Indoor pollution fatalities may be caused by using pesticides and other chemical sprays indoors without proper ventilation.
Carbon monoxide (CO) poisoning and fatalities are often caused by faulty vents and chimneys, or by the burning of charcoal indoors. Chronic carbon monoxide poisoning can result even from poorly adjusted pilot lights. Traps are built into all domestic plumbing to keep sewer gas, hydrogen sulfide, out of interiors. Clothing emits tetrachloroethylene, or other dry cleaning fluids, for days after dry cleaning.
Though its use has now been banned in many countries, the extensive use of asbestos in industrial and domestic environments in the past has left a potentially very dangerous material in many localities. Asbestosis is a chronic inflammatory medical condition affecting the tissue of the lungs. It occurs after long-term, heavy exposure to asbestos from asbestos-containing materials in structures. Sufferers have severe dyspnea (shortness of breath) and are at an increased risk regarding several different types of lung cancer. As clear explanations are not always stressed in non-technical literature, care should be taken to distinguish between several forms of relevant diseases. According to the World Health Organisation (WHO), these may defined as; asbestosis, lung cancer, and Peritoneal Mesothelioma (generally a very rare form of cancer, when more widespread it is almost always associated with prolonged exposure to asbestos).
Biological sources of air pollution are also found indoors, as gases and airborne particulates. Pets produce dander, people produce dust from minute skin flakes and decomposed hair, dust mites in bedding, carpeting and furniture produce enzymes and micrometre-sized fecal droppings, inhabitants emit methane, mold forms in walls and generates mycotoxins and spores, air conditioning systems can incubate Legionnaires' disease and mold, and houseplants, soil and surrounding gardens can produce pollen, dust, and mold. Indoors, the lack of air circulation allows these airborne pollutants to accumulate more than they would otherwise occur in nature.
Health effects
The World Health Organization states that 2.4 million people die each year from causes directly attributable to air pollution, with 1.5 million of these deaths attributable to indoor air pollution.[14] "Epidemiological studies suggest that more than 500,000 Americans die each year from cardiopulmonary disease linked to breathing fine particle air pollution. . ."[15] A study by the University of Birmingham has shown a strong correlation between pneumonia related deaths and air pollution from motor vehicles.[16] Worldwide more deaths per year are linked to air pollution than to automobile accidents.[citation needed] Published in 2005 suggests that 310,000 Europeans die from air pollution annually.[citation needed] Causes of deaths include aggravated asthma, emphysema, lung and heart diseases, and respiratory allergies.[citation needed] The US EPA estimates that a proposed set of changes in diesel engine technology (Tier 2) could result in 12,000 fewer premature mortalities, 15,000 fewer heart attacks, 6,000 fewer emergency room visits by children with asthma, and 8,900 fewer respiratory-related hospital admissions each year in the United States.[citation needed] Air pollution is also emerging as a risk factor for stroke, particularly in developing countries where pollutant levels are highest.[17]
The worst short term civilian pollution crisis in India was the 1984 Bhopal Disaster.[18] Leaked industrial vapours from the Union Carbide factory, belonging to Union Carbide, Inc., U.S.A., killed more than 25,000 people outright and injured anywhere from 150,000 to 600,000. The United Kingdom suffered its worst air pollution event when the December 4 Great Smog of 1952 formed over London. In six days more than 4,000 died, and 8,000 more died within the following months.[citation needed] An accidental leak of anthrax spores from a biological warfare laboratory in the former USSR in 1979 near Sverdlovsk is believed to have been the cause of hundreds of civilian deaths.[citation needed] The worst single incident of air pollution to occur in the United States of America occurred in Donora, Pennsylvania in late October, 1948, when 20 people died and over 7,000 were injured.[19]
The health effects caused by air pollution may include difficulty in breathing, wheezing, coughing and aggravation of existing respiratory and cardiac conditions. These effects can result in increased medication use, increased doctor or emergency room visits, more hospital admissions and premature death. The human health effects of poor air quality are far reaching, but principally affect the body's respiratory system and the cardiovascular system. Individual reactions to air pollutants depend on the type of pollutant a person is exposed to, the degree of exposure, the individual's health status and genetics.[citation needed]
A new economic study of the health impacts and associated costs of air pollution in the Los Angeles Basin and San Joaquin Valley of Southern California shows that more than 3800 people die prematurely (approximately 14 years earlier than normal) each year because air pollution levels violate federal standards. The number of annual premature deaths is considerably higher than the fatalities related to auto collisions in the same area, which average fewer than 2,000 per year.[20]
Diesel exhaust (DE) is a major contributor to combustion derived particulate matter air pollution. In several human experimental studies, using a well validated exposure chamber setup, DE has been linked to acute vascular dysfunction and increased thrombus formation.[21][22] This serves as a plausible mechanistic link between the previously described association between particulate matter air pollution and increased cardiovascular morbidity and mortality.
Effects on cystic fibrosis
Main article: Cystic fibrosisA study from around the years of 1999 to 2000, by the University of Washington, showed that patients near and around particulate matter air pollution had an increased risk of pulmonary exacerbations and decrease in lung function.[23] Patients were examined before the study for amounts of specific pollutants like Pseudomonas aeruginosa or Burkholderia cenocepacia as well as their socioeconomic standing. Participants involved in the study were located in the United States in close proximity to an Environmental Protection Agency.[clarification needed] During the time of the study 117 deaths were associated with air pollution. Many patients in the study lived in or near large metropolitan areas in order to be close to medical help. These same patients had higher level of pollutants found in their system because of more emissions in larger cities. As cystic fibrosis patients already suffer from decreased lung function, everyday pollutants such as smoke, emissions from automobiles, tobacco smoke and improper use of indoor heating devices could further compromise lung function.[24]
Effects on COPD
Main article: Chronic obstructive pulmonary diseaseChronic obstructive pulmonary disease (COPD) includes diseases such as chronic bronchitis, emphysema, and some forms of asthma.[25]
A study conducted in 1960-1961 in the wake of the Great Smog of 1952 compared 293 London residents with 477 residents of Gloucester, Peterborough, and Norwich, three towns with low reported death rates from chronic bronchitis. All subjects were male postal truck drivers aged 40 to 59. Compared to the subjects from the outlying towns, the London subjects exhibited more severe respiratory symptoms (including cough, phlegm, and dyspnea), reduced lung function (FEV1 and peak flow rate), and increased sputum production and purulence. The differences were more pronounced for subjects aged 50 to 59. The study controlled for age and smoking habits, so concluded that air pollution was the most likely cause of the observed differences.[26]
It is believed that much like cystic fibrosis, by living in a more urban environment serious health hazards become more apparent. Studies have shown that in urban areas patients suffer mucus hypersecretion, lower levels of lung function, and more self diagnosis of chronic bronchitis and emphysema.[27]
Effects on children
Cities around the world with high exposure to air pollutants have the possibility of children living within them to develop asthma, pneumonia and other lower respiratory infections as well as a low initial birth rate. Protective measures to ensure the youths' health are being taken in cities such as New Delhi, India where buses now use compressed natural gas to help eliminate the “pea-soup” smog.[28] Research by the World Health Organization shows there is the greatest concentration of particulate matter particles in countries with low economic world power and high poverty and population rates. Examples of these countries include Egypt, Sudan, Mongolia, and Indonesia. In the United States, the Clean Air Act was passed in 1970, however in 2002 at least 146 million Americans were living in non-attainment areas—regions in which the concentration of certain air pollutants exceeded federal standards.[29] Those pollutants are known as the criteria pollutants, and include ozone, particulate matter, sulfur dioxide, nitrogen dioxide, carbon monoxide, and lead. Because children are outdoors more and have higher minute ventilation they are more susceptible to the dangers of air pollution.
Health effects in relatively "clean" areas
Even in the areas with relatively low levels of air pollution, public health effects can be significant and costly, since a large number of people breathe in such pollutants. A 2005 scientific study for the British Columbia Lung Association showed that a small improvement in air quality (1% reduction of ambient PM2.5 and ozone concentrations) would produce a $29 million in annual savings in the Metro Vancouver region in 2010.[30] This finding is based on health valuation of lethal (death) and sub-lethal (illness) effects.
Reduction efforts
There are various air pollution control technologies and land use planning strategies available to reduce air pollution. At its most basic level land use planning is likely to involve zoning and transport infrastructure planning. In most developed countries, land use planning is an important part of social policy, ensuring that land is used efficiently for the benefit of the wider economy and population as well as to protect the environment.
Efforts to reduce pollution from mobile sources includes primary regulation (many developing countries have permissive regulations),[citation needed] expanding regulation to new sources (such as cruise and transport ships, farm equipment, and small gas-powered equipment such as lawn trimmers, chainsaws, and snowmobiles), increased fuel efficiency (such as through the use of hybrid vehicles), conversion to cleaner fuels (such as bioethanol, biodiesel, or conversion to electric vehicles).
Control devices
The following items are commonly used as pollution control devices by industry or transportation devices. They can either destroy contaminants or remove them from an exhaust stream before it is emitted into the atmosphere.
- Particulate control
- Mechanical collectors (dust cyclones, multicyclones)
- Electrostatic precipitators An electrostatic precipitator (ESP), or electrostatic air cleaner is a particulate collection device that removes particles from a flowing gas (such as air) using the force of an induced electrostatic charge. Electrostatic precipitators are highly efficient filtration devices that minimally impede the flow of gases through the device, and can easily remove fine particulate matter such as dust and smoke from the air stream.
- Baghouses Designed to handle heavy dust loads, a dust collector consists of a blower, dust filter, a filter-cleaning system, and a dust receptacle or dust removal system (distinguished from air cleaners which utilize disposable filters to remove the dust).
-
- Particulate scrubbersWet scrubber is a form of pollution control technology. The term describes a variety of devices that use pollutants from a furnace flue gas or from other gas streams. In a wet scrubber, the polluted gas stream is brought into contact with the scrubbing liquid, by spraying it with the liquid, by forcing it through a pool of liquid, or by some other contact method, so as to remove the pollutants.
- NOx control
- Low NOx burners
- Selective catalytic reduction (SCR)
- Selective non-catalytic reduction (SNCR)
- NOx scrubbers
- Exhaust gas recirculation
- Catalytic converter (also for VOC control)
- Mercury control
- Sorbent Injection Technology
- Electro-Catalytic Oxidation (ECO)
- K-Fuel
- Dioxin and furan control
- Miscellaneous associated equipment
- Source capturing systems
- Continuous emissions monitoring systems (CEMS)
Legal regulations
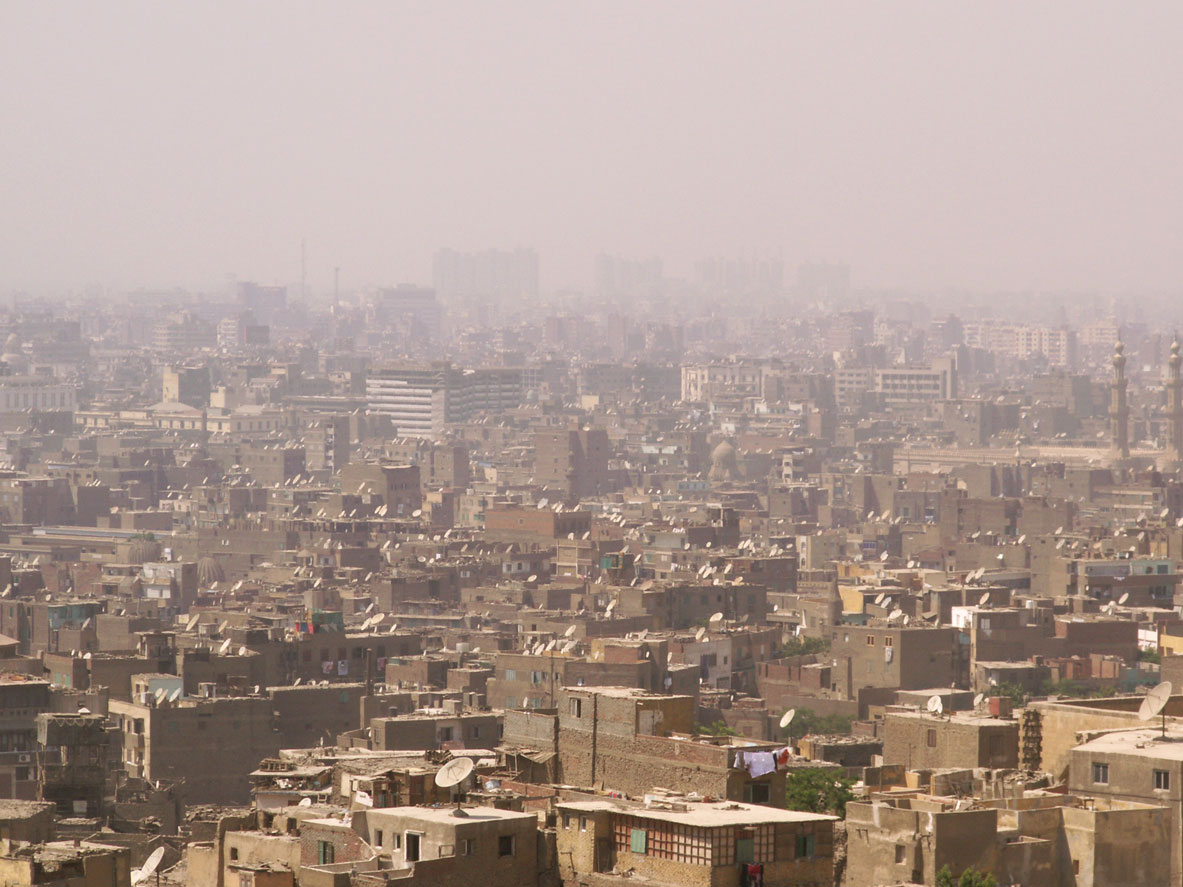
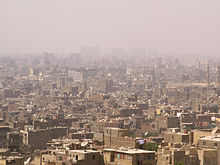 Smog in Cairo
In general, there are two types of air quality standards. The first class of standards (such as the U.S. National Ambient Air Quality Standards and E.U. Air Quality Directive) set maximum atmospheric concentrations for specific pollutants. Environmental agencies enact regulations which are intended to result in attainment of these target levels. The second class (such as the North American Air Quality Index) take the form of a scale with various thresholds, which is used to communicate to the public the relative risk of outdoor activity. The scale may or may not distinguish between different pollutants.
Canada
In Canada air pollution and associated health risks are measured with the The Air Quality Health Index or (AQHI). It is a health protection tool used to make decisions to reduce short-term exposure to air pollution by adjusting activity levels during increased levels of air pollution.
The Air Quality Health Index or "AQHI" is a federal program jointly coordinated by Health Canada and Environment Canada. However, the AQHI program would not be possible without the commitment and support of the provinces, municipalities and NGOs. From air quality monitoring to health risk communication and community engagement, local partners are responsible for the vast majority of work related to AQHI implementation. The AQHI provides a number from 1 to 10+ to indicate the level of health risk associated with local air quality. Occasionally, when the amount of air pollution is abnormally high, the number may exceed 10. The AQHI provides a local air quality current value as well as a local air quality maximums forecast for today, tonight and tomorrow and provides associated health advice.
1 2 3 4 5 6 7 8 9 10 + Risk: Low (1-3) Moderate (4-6) High (7-10) Very high (above 10) As it is now known that even low levels of air pollution can trigger discomfort for the sensitive population, the index has been developed as a continuum: The higher the number, the greater the health risk and need to take precautions. The index describes the level of health risk associated with this number as ‘low’, ‘moderate’, ‘high’ or ‘very high’, and suggests steps that can be taken to reduce exposure.
Health Risk Air Quality Health Index Health Messages At Risk population *General Population Low 1-3 Enjoy your usual outdoor activities. Ideal air quality for outdoor activities Moderate 4-6 Consider reducing or rescheduling strenuous activities outdoors if you are experiencing symptoms. No need to modify your usual outdoor activities unless you experience symptoms such as coughing and throat irritation. High 7-10 Reduce or reschedule strenuous activities outdoors. Children and the elderly should also take it easy. Consider reducing or rescheduling strenuous activities outdoors if you experience symptoms such as coughing and throat irritation. Very high Above 10 Avoid strenuous activities outdoors. Children and the elderly should also avoid outdoor physical exertion. Reduce or reschedule strenuous activities outdoors, especially if you experience symptoms such as coughing and throat irritation. It is measured based on the observed relationship of Nitrogen Dioxide (NO2), ground-level Ozone (O3) and particulate matter (PM2.5) with mortality from an analysis of several Canadian cities. Significantly, all three of these pollutants can pose health risks, even at low levels of exposure, especially among those with pre-existing health problems.
When developing the AQHI, Health Canada’s original analysis of health effects included five major air pollutants: particulate matter, ozone, and nitrogen dioxide (NO2), as well as sulphur dioxide (SO2), and carbon monoxide (CO). The latter two pollutants provided little information in predicting health effects and were removed from the AQHI formulation.
The AQHI does not measure the effects of odour, pollen, dust, heat or humidity.
Cities
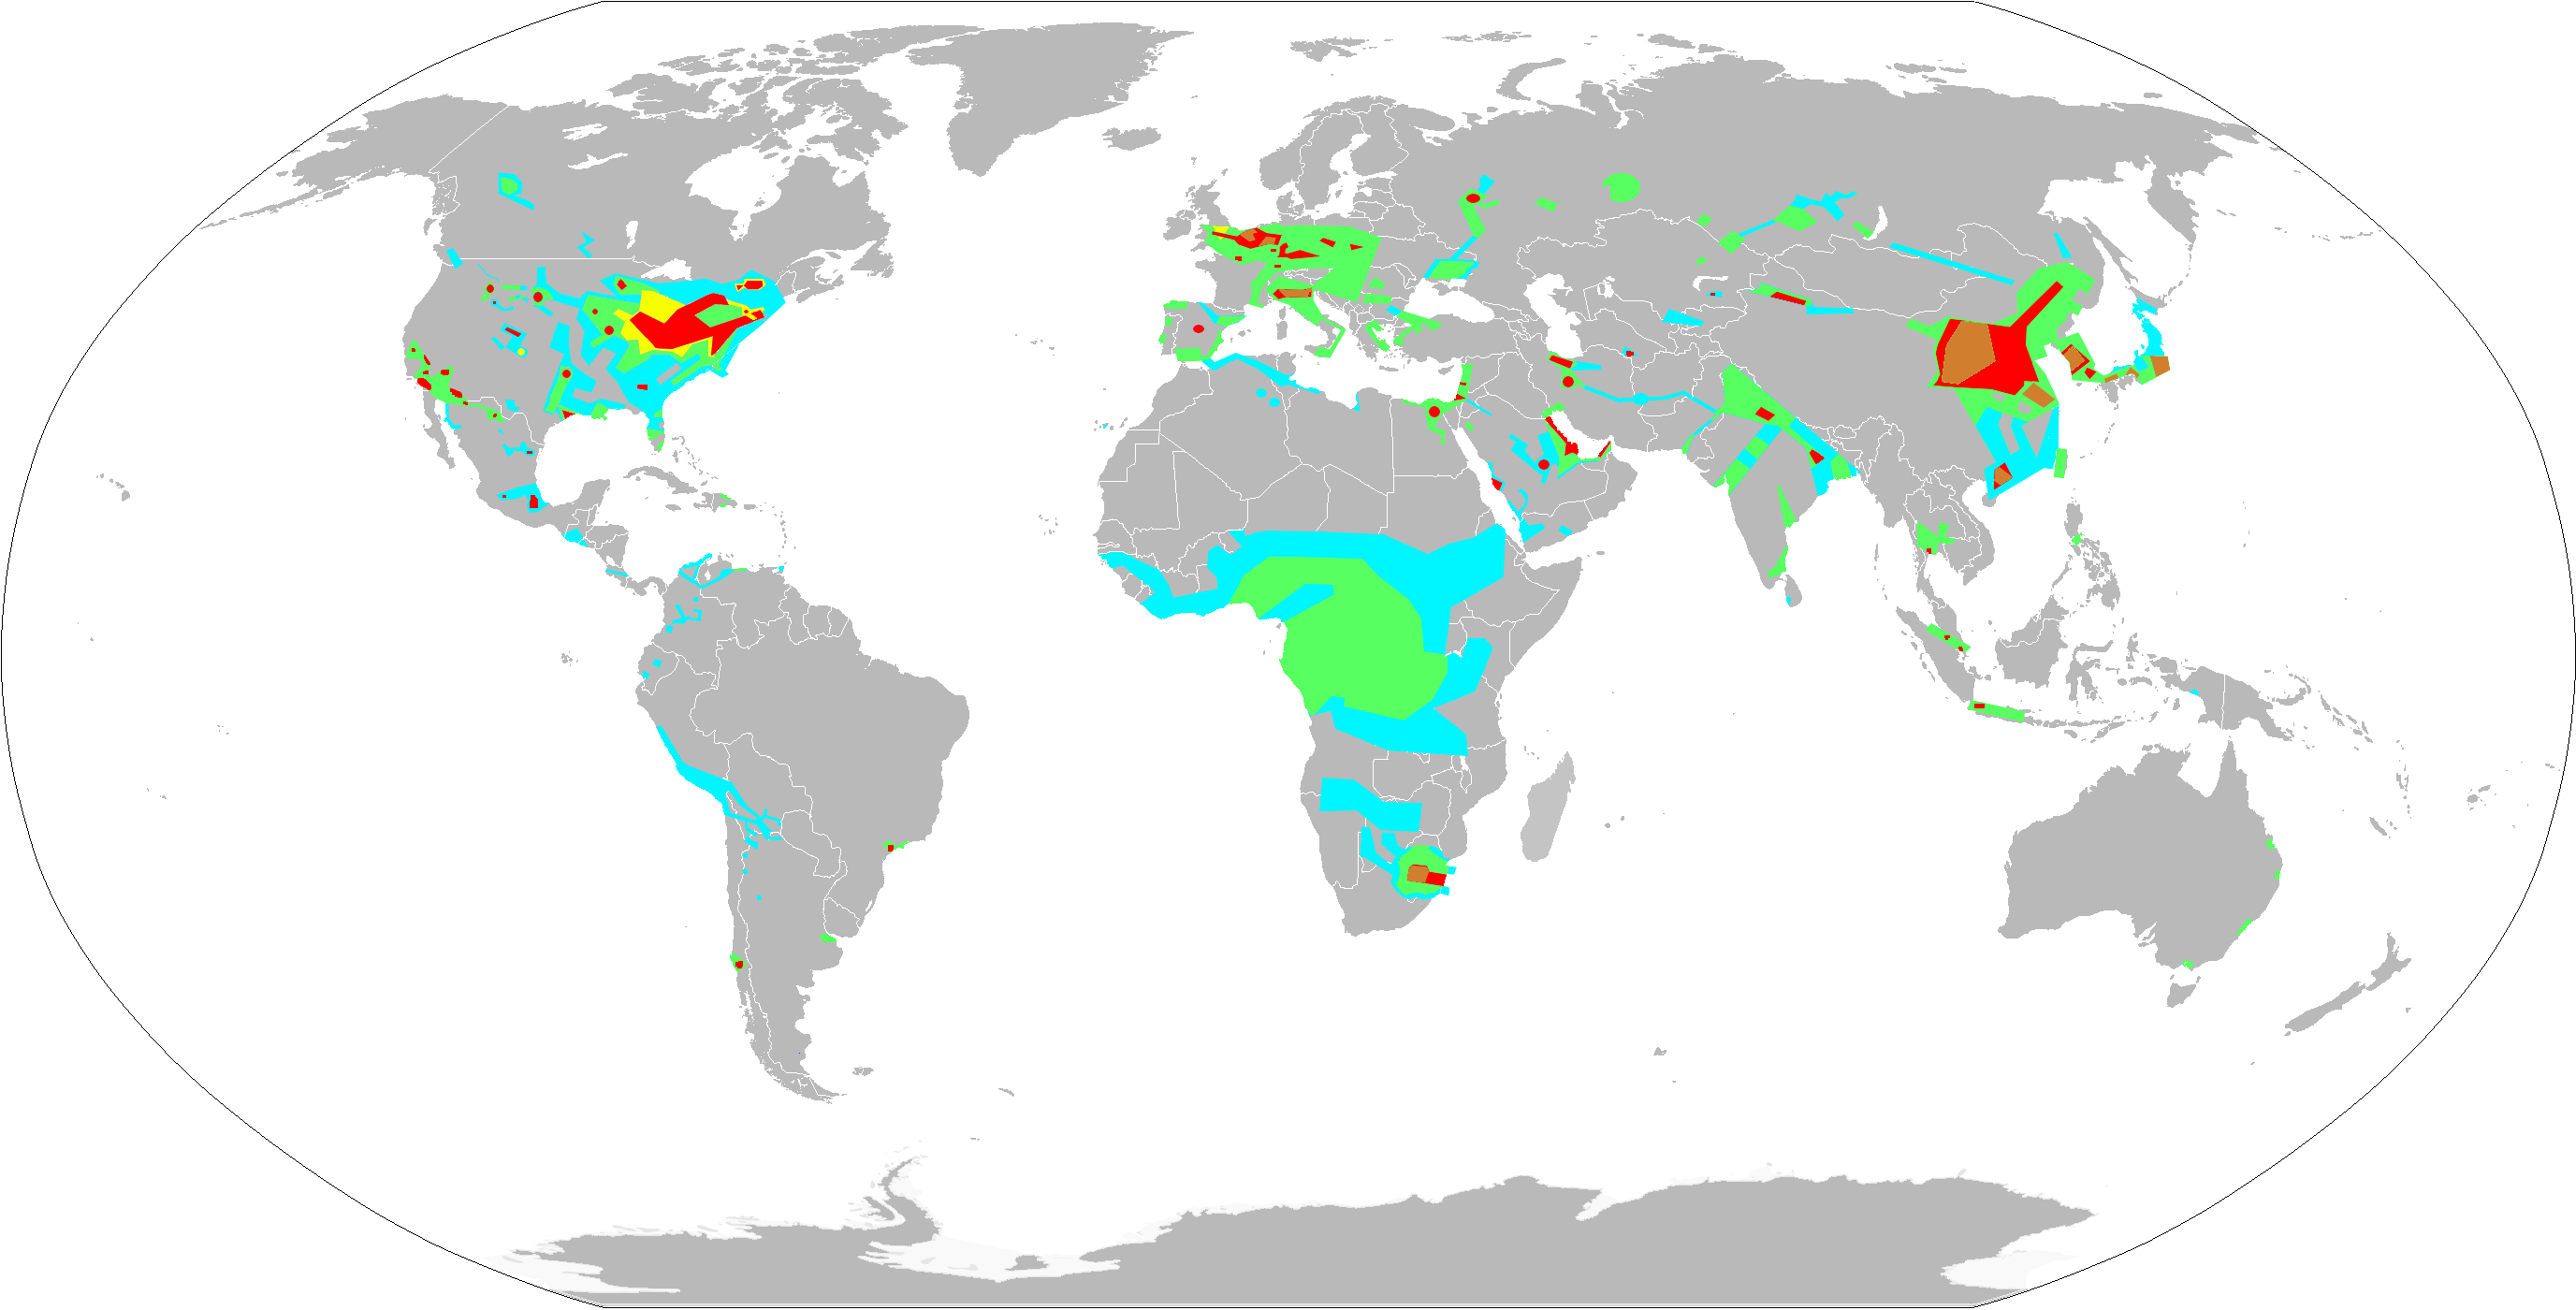
 Nitrogen dioxide concentrations as measured from satellite 2002-2004
Air pollution is usually concentrated in densely populated metropolitan areas, especially in developing countries where environmental regulations are relatively lax or nonexistent[citation needed]. However, even populated areas in developed countries attain unhealthy levels of pollution with Los Angeles and Rome[33] being two good examples.
NATA
The National-Scale Air Toxics Assessment (NATA) is EPA's ongoing comprehensive evaluation of air toxics in the U.S. EPA developed the NATA as a state-of-the-science screening tool for State/Local/Tribal Agencies to prioritize pollutants, emission sources and locations of interest for further study in order to gain a better understanding of risks. NATA assessments do not incorporate refined information about emission sources, but rather, use general information about sources to develop estimates of risks which are more likely to overestimate impacts than underestimate them. NATA provides estimates of the risk of cancer and other serious health effects from breathing (inhaling) air toxics in order to inform both national and more localized efforts to identify and prioritize air toxics, emission source types and locations which are of greatest potential concern in terms of contributing to population risk. This in turn helps air pollution experts focus limited analytical resources on areas and or populations where the potential for health risks are highest. Assessments include estimates of cancer and non-cancer health effects based on chronic exposure from outdoor sources, including assessments of non-cancer health effects for Diesel Particulate Matter (PM). Assessments provide a snapshot of the outdoor air quality and the risks to human health that would result if air toxic emissions levels remained unchanged.[34]
Governing Urban Air Pollution – a regional example (London)
In Europe, Council Directive 96/62/EC on ambient air quality assessment and management provides a common strategy against which member states can “set objectives for ambient air quality in order to avoid, prevent or reduce harmful effects on human health and the environment . . . and improve air quality where it is unsatisfactory”.[35]
On 25 July 2008 in the case Dieter Janecek v Freistaat Bayern CURIA, the European Court of Justice ruled that under this directive[35] citizens have the right to require national authorities to implement a short term action plan that aims to maintain or achieve compliance to air quality limit values.[36]
This important case law appears to confirm the role of the EC as centralised regulator to European nation-states as regards air pollution control. It places a supranational legal obligation on the UK to protect its citizens from dangerous levels of air pollution, furthermore superseding national interests with those of the citizen.
In 2010, the European Commission (EC) threatened the UK with legal action against the successive breaching of PM10 limit values.[37] The UK government has identified that if fines are imposed, they could cost the nation upwards of £300 million per year.[38]
In March 2011, the City of London remains the only UK region in breach of the EC’s limit values, and has been given 3 months to implement an emergency action plan aimed at meeting the EU Air Quality Directive.[39] The City of London has dangerous levels of PM10 concentrations, estimated to cause 3000 deaths per year within the city.[40] As well as the threat of EU fines, in 2010 it was threatened with legal action for scrapping the western congestion charge zone, which is claimed to have led to an increase in air pollution levels.[41]
In response to these charges, Boris Johnson, Mayor of London, has criticised the current need for European cities to communicate with Europe through their nation state’s central government, arguing that in future “A great city like London” should be permitted to bypass its government and deal directly with the European Commission regarding its air quality action plan.[39]
In part, this is an attempt to divert blame away from the Mayors office, but it can also be interpreted as recognition that cities can transcend the traditional national government organisational hierarchy and develop solutions to air pollution using global governance networks, for example through transnational relations. Transnational relations include but are not exclusive to national governments and intergovernmental organisations [42] allowing sub-national actors including cities and regions to partake in air pollution control as independent actors.
Particularly promising at present are global city partnerships.[43] These can be built into networks, for example the C40 network, of which London is a member. The C40 is a public ‘non-state’ network of the world’s leading cities that aims to curb their greenhouse emissions.[43] The C40 has been identified as ‘governance from the middle’ and is an alternative to intergovernmental policy.[44] It has the potential to improve urban air quality as participating cities “exchange information, learn from best practices and consequently mitigate carbon dioxide emissions independently from national government decisions”.[43] A criticism of the C40 network is that its exclusive nature limits influence to participating cities and risks drawing resources away from less powerful city and regional actors.
Carbon dioxide emissions
Most Polluted World Cities by PM[45] Particulate
matter,
μg/m³ (2004)City 169 Cairo, Egypt 150 Delhi, India 128 Kolkata, India (Calcutta) 125 Tianjin, China 123 Chongqing, China 109 Kanpur, India 109 Lucknow, India 104 Jakarta, Indonesia 101 Shenyang, China - Total CO2 emissions
Main article: List of countries by carbon dioxide emissionsCountries with the highest CO2 emissions Country Carbon dioxide emissions per
year (106 Tons) (2006)Percentage of global total Avg. emission
per Km2 of its land (Tons) China
China6,103 21.5% 636  United States
5,752 20.2% 597  Russia
1,564 5.5% 91  India
India1,510 5.3% 459  Japan
Japan1293 4.6% 3421  Germany
805 2.8% 2254  United Kingdom
568 2.0% 2338  Canada
544 1.9% 54  South Korea
475 1.7% 4758  Italy
Italy474 1.7% 1573 - Per capita CO2 emissions[46]
Main article: List of countries by carbon dioxide emissions per capitaCountries with the highest per capita CO2 emissions Country Carbon dioxide emissions per year
(Tons per person) (2006) Qatar
Qatar56.2  United Arab Emirates
32.8  Kuwait
31.2  Bahrain
28.8  Trinidad and Tobago
25.3  Luxembourg
24.5  Netherlands Antilles
22.8  Aruba
Aruba22.3 United States19  Australia
18.1 Atmospheric dispersion
Main article: Atmospheric dispersion modelingThe basic technology for analyzing air pollution is through the use of a variety of mathematical models for predicting the transport of air pollutants in the lower atmosphere. The principal methodologies are:
- Point source dispersion, used for industrial sources.
- Line source dispersion, used for airport and roadway air dispersion modeling
- Area source dispersion, used for forest fires or duststorms
- Photochemical models, used to analyze reactive pollutants that form smog
 Visualization of a buoyant Gaussian air pollution dispersion plume as used in many atmospheric dispersion models
The point source problem is the best understood, since it involves simpler mathematics and has been studied for a long period of time, dating back to about the year 1900. It uses a Gaussian dispersion model for buoyant pollution plumes to forecast the air pollution isopleths, with consideration given to wind velocity, stack height, emission rate and stability class (a measure of atmospheric turbulence).[47][48] This model has been extensively validated and calibrated with experimental data for all sorts of atmospheric conditions.
The roadway air dispersion model was developed starting in the late 1950s and early 1960s in response to requirements of the National Environmental Policy Act and the U.S. Department of Transportation (then known as the Federal Highway Administration) to understand impacts of proposed new highways upon air quality, especially in urban areas. Several research groups were active in this model development, among which were: the Environmental Research and Technology (ERT) group in Lexington, Massachusetts, the ESL Inc. group in Sunnyvale, California and the California Air Resources Board group in Sacramento, California. The research of the ESL group received a boost with a contract award from the United States Environmental Protection Agency to validate a line source model using sulfur hexafluoride as a tracer gas. This program was successful in validating the line source model developed by ESL inc. Some of the earliest uses of the model were in court cases involving highway air pollution, the Arlington, Virginia portion of Interstate 66 and the New Jersey Turnpike widening project through East Brunswick, New Jersey.
Area source models were developed in 1971 through 1974 by the ERT and ESL groups, but addressed a smaller fraction of total air pollution emissions, so that their use and need was not as widespread as the line source model, which enjoyed hundreds of different applications as early as the 1970s. Similarly photochemical models were developed primarily in the 1960s and 1970s, but their use was more specialized and for regional needs, such as understanding smog formation in Los Angeles, California.
Environmental impacts of greenhouse gas pollutants
Main articles: Ocean acidification and Greenhouse effectThe greenhouse effect is a phenomenon whereby greenhouse gases create a condition in the upper atmosphere causing a trapping of heat and leading to increased surface and lower tropospheric temperatures. Carbon dioxide emissions from combustion of fossil fuels are a source of greenhouse gas emissions.
Other greenhouse gases include methane, hydrofluorocarbons, perfluorocarbons, chlorofluorocarbons, nitrogen oxides, and ozone.
This effect has been understood by scientists for about a century, and technological advancements during this period have helped increase the breadth and depth of data relating to the phenomenon. Currently, scientists are studying the role of changes in composition of greenhouse gases from natural and anthropogenic sources for the effect on climate change.
A number of studies have also investigated the potential for long-term rising levels of atmospheric carbon dioxide to cause increases in the acidity of ocean waters and the possible effects of this on marine ecosystems.
See also
References
- ^ "Reports". WorstPolluted.org. http://www.worstpolluted.org/. Retrieved 2010-08-29.
- ^ "EPA: Air Pollutants". Epa.gov. 2006-06-28. http://www.epa.gov/ebtpages/airairpollutants.html. Retrieved 2010-08-29.
- ^ Evidence growing of air pollution’s link to heart disease, death // American Heart Association. May 10, 2010
- ^ "Newly detected air pollutant mimics damaging effects of cigarette smoke" (PDF). http://www.physorg.com/pdf138201201.pdf. Retrieved 2010-08-29.
- ^ "Infant Inhalation Of Ultrafine Air Pollution Linked To Adult Lung Disease". Sciencedaily.com. 2009-07-23. http://www.sciencedaily.com/releases/2009/07/090722123751.htm. Retrieved 2010-08-29.
- ^ Goldstein, Allen H., Charles D. Koven, Colette L. Heald, Inez Y. Fung (2009-05-05). "Biogenic carbon and anthropogenic pollutants combine to form a cooling haze over the southeastern United States". Proceedings of the National Academy of Sciences. http://www.pnas.org/content/106/22/8835.full. Retrieved 2010-12-05.
- ^ "AP 42, Volume I". Epa.gov. http://www.epa.gov/ttn/chief/ap42/index.html. Retrieved 2010-08-29.
- ^ "United Kingdom's emission factor database". Naei.org.uk. http://www.naei.org.uk/emissions/index.php. Retrieved 2010-08-29.
- ^ EMEP/EEA air pollutant emission inventory guidebook — 2009
- ^ "Revised 1996 IPCC Guidelines for National Greenhouse Gas Inventories (reference manual)". Ipcc-nggip.iges.or.jp. http://www.ipcc-nggip.iges.or.jp/public/gl/invs6.htm. Retrieved 2010-08-29.
- ^ Australian National Pollutant Inventory Emissions Estimation Technique Manuals[dead link]
- ^ Canadian GHG Inventory Methodologies[dead link]
- ^ "Duflo, E., Greenstone, M., and Hanna, R. (2008) "Indoor air pollution, health and economic well-being". ''S.A.P.I.EN.S.'' '''1''' (1)". Sapiens.revues.org. http://sapiens.revues.org/index130.html. Retrieved 2010-08-29.
- ^ "Estimated deaths & DALYs attributable to selected environmental risk factors, by WHO Member State, 2002". http://www.who.int/entity/quantifying_ehimpacts/countryprofilesebd.xls. Retrieved 2010-08-29.
- ^ "Newly detected air pollutant mimics damaging effects of cigarette smoke". www.eurekalert.org. http://www.eurekalert.org/pub_releases/2008-08/acs-nda072308.php. Retrieved 2008-08-17.
- ^ "Study links traffic pollution to thousands of deaths". The Guardian (London, UK: Guardian Media Group). 2008-04-15. http://www.guardian.co.uk/society/2008/apr/15/health. Retrieved 2008-04-15.
- ^ Farrah J. Mateen & Robert D. Brook "Air pollution as an emerging global risk factor for stroke" JAMA 2011 Mar 23;305(12):1240-1. http://www.ncbi.nlm.nih.gov/pubmed/21427378
- ^ Simi Chakrabarti. "20th anniversary of world's worst industrial disaster". Australian Broadcasting Corporation. http://www.abc.net.au/worldtoday/content/2004/s1257352.htm.
- ^ Davis, Devra (2002). When Smoke Ran Like Water: Tales of Environmental Deception and the Battle Against Pollution. Basic Books. ISBN 0-465-01521-2.
- ^ [1][dead link] , http://www.latimes.com/features/health/la-me-pollute13-2008nov13,0,5432723.story , http://www.sfgate.com/cgi-bin/article.cgi?f=/c/a/2008/11/13/MNQP143CPV.DTL
- ^ Diesel exhaust inhalation increases thrombus formation in man† Andrew J. Lucking1*, Magnus Lundback2, Nicholas L. Mills1, Dana Faratian1, Stefan L. Barath2, Jamshid Pourazar2, Flemming R. Cassee3, Kenneth Donaldson1, Nicholas A. Boon1, Juan J. Badimon4, Thomas Sandstrom2, Anders Blomberg2, and David E. Newby1
- ^ Persistent Endothelial Dysfunction in Humans after Diesel Exhaust Inhalation Ha°kan To¨rnqvist1*, Nicholas L. Mills2*, Manuel Gonzalez3, Mark R. Miller2, Simon D. Robinson2, Ian L. Megson4, William MacNee5, Ken Donaldson5, Stefan So¨derberg3, David E. Newby2, Thomas Sandstro¨m1, and Anders Blomberg1
- ^ Christopher H. Goss, Stacey A. Newsom, Jonathan S. Schildcrout, Lianne Sheppard and Joel D. Kaufman (2004). "Effect of Ambient Air Pollution on Pulmonary Exacerbations and Lung Function in Cystic Fibrosis". American Journal of Respiratory and Critical Care Medicine 169 (7): 816–821. doi:10.1164/rccm.200306-779OC. PMID 14718248.
- ^ Michael Kymisis, Konstantinos Hadjistavrou (2008). "Short-Term Effects Of Air Pollution Levels On Pulmonary Function Of Young Adults". The Internet Journal of Pulmonary Medicine 9 (2). http://www.ispub.com/ostia/index.php?xmlFilePath=journals/ijpm/vol9n2/pollution.xml.
- ^ Zoidis, John D. (1999). "The Impact of Air Pollution on COPD". RT: for Decision Makers in Respiratory Care. http://www.rtmagazine.com/issues/articles/1999-10_06.asp.
- ^ Holland WW, Reid DD. The urban factor in chronic bronchitis. Lancet. 1965;I:445-448.
- ^ J. Sunyer (2001). "Urban air pollution and Chronic Obstructive Pulmonary disease: a review". European Respiratory Journal 17 (5): 1024–1033. doi:10.1183/09031936.01.17510240. PMID 11488305. http://erj.ersjournals.com/cgi/content/abstract/17/5/1024.
- ^ "Polluted Cities: The Air Children Breathe" (PDF). World Health Organization. http://www.who.int/ceh/publications/en/11airpollution.pdf.
- ^ Committee on Environmental Health (2004). "Ambient Air Pollution: Health Hazards to Children". Pediatrics 114 (6): 1699–1707. doi:10.1542/peds.2004-2166. PMID 15574638.
- ^ "2005 BC Lung Association report on the valuation of health impacts from air quality in the Lower Fraser Valley airshed" (PDF). http://www.bc.lung.ca/pdf/health_and_air_quality_2005.pdf. Retrieved 2010-08-29.
- ^ "Environment Canada - Air - Air Quality". Ec.gc.ca. 2007-09-10. http://www.ec.gc.ca/cas-aqhi/default.asp?lang=En&n=065BE995-1. Retrieved 2011-11-11.
- ^ "Environment Canada - Air - AQHI categories and explanations". Ec.gc.ca. 2008-04-16. http://www.ec.gc.ca/cas-aqhi/default.asp?lang=En&n=79A8041B-1. Retrieved 2011-11-11.
- ^ http://www.ncbi.nlm.nih.gov/pmc/articles/PMC1757645/pdf/v055p00605.pdf
- ^ EPA; http://www.epa.gov/ttn/atw/natamain/
- ^ a b Europa (1996). "Summaries of EU legislation - Management and quality of ambient air". http://europa.eu/legislation_summaries/other/l28031a_en.htm. Retrieved 7 April.
- ^ European Court of Justice, CURIA (2008). "PRESS RELEASE No 58/08 Judgment of the Court of Justice in Case C-237/07". http://curia.europa.eu/en/actu/communiques/cp08/aff/cp080058en.pdf. Retrieved 6 April.
- ^ European Commission. "Air quality: Commission sends final warning to UK over levels of fine particle pollution". http://ec.europa.eu/unitedkingdom/press/press_releases/2010/pr1055_en.htm. Retrieved 7 April 2011.
- ^ House of Commons Environmental Audit Committee (2010). "Environmental Audit Committee - Fifth Report Air Quality". http://www.publications.parliament.uk/pa/cm200910/cmselect/cmenvaud/229/22902.htm. Retrieved 6 April.
- ^ a b Guardian (11 March 2011). "Britain fends off threat of £300m fine over London air pollution". Guardian. http://www.guardian.co.uk/environment/2011/mar/11/britain-300m-fine-london-air-pollution. Retrieved 6 April.
- ^ London Assembly Environment Committee (2009). "Every Breath You Take". http://www.london.gov.uk/archive/assembly/reports/environment/air-quality-report-200904.pdf.. Retrieved 4 April.
- ^ BBC (2010) (2010-12-06). "Threat to sue over London congestion charge scrapping". BBC News. http://www.bbc.co.uk/news/uk-england-london-11928005. Retrieved 5 April.
- ^ Risse-Kappen, T (1995). Bringing transnational relations back in: non-state actors, domestic structures, and international institutions. Cambridge: Cambridge University Press. pp. 3–34.
- ^ a b c Pattberg, P; Stripple, J. (2008) (2008). "Beyond the public and private divide: remapping transnational climate governance in the 21st century". International Environmental Agreements: Politics, Law and Economics 8 (4).
- ^ Roman, M (2010). "Governing from the middle: the C40 Cities Leadership Group". Corporate Governance 10 (1).
- ^ "World Bank Statistics" (PDF). http://siteresources.worldbank.org/DATASTATISTICS/Resources/table3_13.pdf. Retrieved 2010-08-29.
- ^ International Carbon Dioxide Emissions and Carbon Intensity Energy Information Administration
- ^ Turner, D.B. (1994). Workbook of atmospheric dispersion estimates: an introduction to dispersion modeling (2nd ed.). CRC Press. ISBN 1-56670-023-X.
- ^ Beychok, M.R. (2005). Fundamentals Of Stack Gas Dispersion (4th ed.). author-published. ISBN 0-9644588-0-2. www.air-dispersion.com
External links
- Air quality science and general information
- International Conference on Urban Air Quality.
- UNEP Urban Issues
- European Commission > Environment > Policies > Air >Air Quality.
- UNEP Partnership for Clean Fuels and Vehicles
- Database: outdoor air pollution in cities from the World Health Organisation
- Interactive map of US facilities emitting air pollution
- Air quality modelling
- Stuff in the Air Standard air quality modelling procedure for industrial sources.
- Wiki on Atmospheric Dispersion Modelling. Addresses the international community of atmospheric dispersion modellers — primarily researchers, but also users of models. Its purpose is to pool experiences gained by dispersion modellers during their work.
- Air Dispersion Modeling Conversions and Formulas One of six technical articles devoted to air quality and air pollution dispersion modeling.
- Effects on human health
- World Health Organization Fact Sheet on Air quality and health
- Air Pollution Triggers Blood Clots
- American Lung Association of New England on air quality.
- Impact assessment of the mortality effects of longer-term exposure to air pollution: exploring cause-specific mortality and susceptibility by BG Miller. Institute of Occupational Medicine Research Report TM/03/01
- Comparing estimated risks for air pollution with risks for other health effects by BG Miller and JF Hurley. Institute of Occupational Medicine Research Report TM/06/01
- The Mortality Effects of Long-Term Exposure to Particulate Air Pollution in the United Kingdom, COMEAP, 2010.
Categories:- Air pollution
- Climate forcing agents


Wikimedia Foundation. 2010.