- Crime in the United States
-
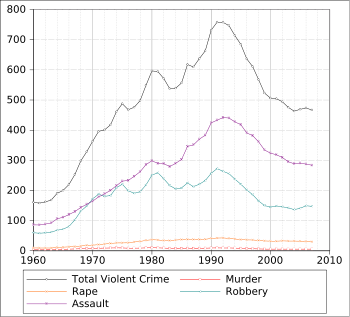 Violent crime rates in the United states per 100,000 population beginning in 1960. Source: Bureau of Justice Statistics.
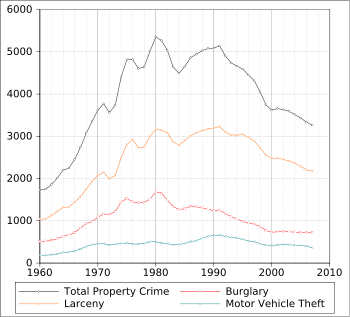 Property crime rates in the United states per 100,000 population beginning in 1960. Source: Bureau of Justice Statistics.
Crime statistics for the United States are published annually by the Federal Bureau of Investigation in the Uniform Crime Reports which represents crimes reported to the police. The Bureau of Justice Statistics conducts the annual National Crime Victimization Survey which captures crimes not reported to the police.
In 2009 America's crime rate was roughly the same as in 1968, with the homicide rate being at its lowest level since 1964. Overall, the national crime rate was 3466 crimes per 100,000 residents, down from 3680 crimes per 100,000 residents forty years earlier in 1969 (-9.4%).[1]
The likelihood of committing and falling victim to crime also depends on several demographic characteristics, as well as location of the population. Overall, men, minorities, the young, and those in financially less favorable positions are more likely to be crime victims, as well as commit crimes.[2] Crime in the US is also concentrated in certain areas.
It is quite common for crime in American cities to be highly concentrated in a few, often economically disadvantaged areas. For example, San Mateo County, California had a population of approximately 707,000 and 17 homicides in 2001. Six of these 17 homicides took place in poor, largely Black and Hispanic East Palo Alto, which had a population of roughly 30,000. So, while East Palo Alto accounted for a mere 4.2% of the population, about one-third of the homicides took place there.[3] According to the FBI, in 2008 14,180 people were murdered in America.[4]
Contents
Measuring crime
The country's overall crime rate is displayed in fifty indices. The violent crime index comprises homicide, forcible rape, robbery and assault. The property crime index consists of burglary, larceny/theft, motor vehicle theft, and arson. Statistics for index offenses are generally available for the country as a whole, all fifty states and all participating communities within the United States.
For example, Dallas is mentioned as having one of the highest crime rates in the nation. This indicator is important in demonstrating this statistic and understanding the intricacies of crime in Dallas. As noted above, “the crime rate” as reported in the news media typically refers to a combination of violent crime and property crime. In 2002, Dallas reportedly had 17,018 crimes, and 15,429 in 2005. However, in Dallas, as in many other cities, property crime accounts for the majority of offences, while “the crime rate" is frequently interpreted as the rate of violent crime.
The crime rate is measured by the number of offenses being reported per 100,000 people.
Crime over time
Crime has been a long-standing concern in the United States, with high rates at the beginning of the 20th century compared to parts of Western Europe. In 1916, 198 homicides were recorded in Chicago, a city of slightly over 2 million at the time. This level of crime was not exceptional when compared to other American cities such as New York City, but was much higher relative to European cities, such as London, which then had three times the population but recorded only 45 homicides in the same year.[5]
Post 1960s rise
Since 1964, the U.S. crime rate has increased by as much as 350%, and over 11 million crimes were reported in the year 2007 alone.[6] Crime in the United States has fluctuated considerably over the course of the last half-century, rising significantly in the late 1960s and 1970s, peaking in the early 1990s and then decreasing steadily from then on.
Over the past thirty years, the crime rate rose throughout the 1980s, reached its peak in 1993 and then began to decrease throughout the 1990s and 2000s. One hypothesis suggests there is a causal link between legalized abortion and this drop.[7] Another suggests reduced lead exposure as the cause; Scholar Mark A.R. Kleiman writes: "Given the decrease in lead exposure among children since the 1980s and the estimated effects of lead on crime, reduced lead exposure could easily explain a very large proportion—certainly more than half—of the crime decrease of the 1994-2004 period. A careful statistical study relating local changes in lead exposure to local crime rates estimates the fraction of the crime decline due to lead reduction as greater than 90 percent. (When Brute Force Fails: How to Have Less Crime and Less Punishment, Princeton University Press 2009 page 133 citing Richard Nevin, "How Lead Exposure Relates to Temoral Changes in IQ, Violent Crime and Unwed Pregnancy," Environmental Research 83, 1 (2000): 1-22.)
1990s decline
 History of Right To Carry laws
While the crime rate had risen sharply in the late 1960s and early 1970s, bringing it to a constant all-time high during much of the 1980s, it has declined steeply since 1993. Several theories have been proposed to explain the cause.
- The first is the rate of gun ownership and the increase in laws allowing concealed carry of guns. Gun ownership reached its lowest levels in the early 1990s [2] and at that time, the ability to carry a gun was very restricted. By 2010, 40 states had either implemented "Shall-Issue" concealed carry permit laws, or protected concealed carry unrestricted by permit.
- Another hypothesis suggests a causal link between legalized abortion and the drop in crime during the 1990s.[7]
- Another possibility sometimes suggested is the introduction of the Three Strikes Law, which was first passed by Washington state in 1993, providing that felony offenders who committed a third offence receive life imprisonment. Other states that passed Three Strikes Laws include California, Colorado, Connecticut, Indiana, Kansas, Nevada, North Dakota, Arkansas, Georgia, and Maryland.
The year 2010 was overall the safest year in almost forty years. The recent overall decrease has reflected upon all significant types of crime, with all violent and property crimes having decreased and reached an all-time low. The homicide rate in particular has decreased 51% between its record high point in 1991 and 2010.From 2000-2008, the homicide rate stagnated.[8] While the homicide rate decreased continuously between 1991 and 2000 from 9.8 homicides per 100,000 persons to 5.5 per 100,000, it remained at 5.4-5.7 until 2009, when it dipped down to 5.0, and continued to drop in 2010 to 4.8.
Despite the recent stagnation of the homicide rate, however, property and violent crimes overall have continued to decrease, though at a considerably slower pace than in the 1990s.[8] Overall, the crime rate in the U.S. was the same in 2009 as in 1968, with the homicide rate being roughly the same as in 1964. Violent crime overall, however, is still at the same level as in 1973, despite having decreased steadily since 1991.[9]
Crime Rate[9][10] 1960 1961 1963 1965 1967 1969 1971 1973 1975 1977 1979 1981 1983 1985 1987 1989 1991 1993 1995 1997 1999 2001 2003 2005 2007 2009 2010 Violent crime rate 160.9 158.1 168.2 200.2 253.2 328.7 396.0 417.4 487.8 475.9 548.9 594.3 537.7 556.6 609.7 663.1 758.2 747.1 684.5 611.0 523.0 504.5 475.8 469.0 472.0 429.4 403.6 Homicide rate 5.1 4.8 4.6 5.1 6.2 7.3 8.6 9.4 9.6 8.8 9.8 9.8 8.3 8.0 8.3 8.7 9.8 9.5 8.2 6.8 5.7 5.6 5.7 5.6 5.7 5.0 4.8 Property crime rate 1,726 1,747 2,012 2,249 2,736 3,351 3,769 3,737 4,811 4,602 5,017 5,264 4,637 4,650 4,940 5,078 5,140 4,740 4,591 4,316 3,744 3,658 3,591 3,432 3,277 3,036 2,941 Crimes per 100,000 population
SOURCES: US Bureau of Justice Statistics (2004),[9] Federal Bureau of Investigation, (2010)[10]
Characteristics of offenders
Further information: Race and crime in the United States As of 2005, statistics show that offending rates for blacks were more than 7 times higher than the rates for whites.
According to the latest US Department of Justice survey of crime victims, more than 6.6 million violent crimes (murder, rape, assault and robbery) are committed in the US each year, of which about 20 per cent, or 1.3 million, are inter-racial crimes.
According to the survey "Highlights from 20 Years of Surveying Crime Victims", published in 1993, of the 20% of violent crimes that are interracial, 15% involve white victims and black offenders, 3% involve white victims and other-race offenders, and 2% involve black victims and white offender.
And according to the latest annual report on murder by the Federal Bureau of Investigation, most inter-racial murders involve black assailants and white victims, with blacks murdering whites at 18 times the rate that whites murder blacks. As of 2008, a statistics report which surveyed all persons arrested for offending, stated that of the crimes surveyed for which the identity of the offender could be determined, 77.2 percent of all persons arrested were white or Hispanic, 20.3 percent of people arrested for offending were black or black and Hispanic; and the remaining 2.4 percent were of other races. After arrest, 45.1% of violent crimes and 17.4% of property crimes nationwide were cleared by arrest or exceptional means.[11]
As of 2008, statistics report that of 16,277 murders, 10,568 were committed by males, 1,176 were by female, and 4,533 were committed in which the offenders sex was unknown. Likewise, 5,334 murders were committed by white offenders, 5,943 were committed by black or black and Hispanic offenders, 273 were committed by offenders of other races, and 4,727 murders were committed by offenders whose race is not known. [12]
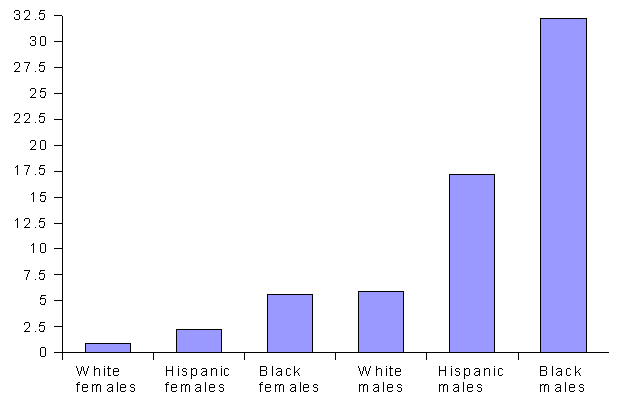
 As of 2001, the chances of going to prison in percentages for various demographic groups
According to Anthony Walsh, "Whites constituted 82.2% of the American population in 1999 (US Bureau of the Census, 2000), with arrest rates for murder (48.9%), rape (63.1%), robbery (46.0%), aggravated assault (64.4%), burglary (68.1%), larceny/theft (64.9%), motor vehicle theft (58.0%), and arson (72.4%). It should be noted that the "white" category in the UCR includes non-black Hispanics, and the "black" category includes black Hispanics."[13]
A 2008 FBI Uniform Crime Report on rape and sexual-based crime published by the United States Department of Justice stated that of the crimes surveyed, whites represented 65.2% of persons arrested for rape, blacks represented 32.2%, with American Indians and Asians ranking just above 1%. "Hispanics", "Hispanic-White" or "Hispanic-Black" was not specified into any specific category.[14]
According to the latest "Hate Crimes Reported by Victims and Police," a 2008 Bureau of Justice Statistics Report, hate crime offenders were predominantly white (61%), whereas the victims were predominantly black (72.9%) and targeted because of their race (51%). Among religious hate crimes, the majority of victims were of Jewish faith (65.7%) with less than one in ten offenses aimed at people of the Muslim faith (7.7%).[15] Among crimes aimed at ethnicity and national background, the majority of hate crimes were of anti-Hispanic bias (64%).[15]
Reporting at the annual meeting of the American Sociological Association (August 3, 2008), sociologists at Bowling Green State University found that men who attend college are more likely to commit property crimes during their college years than their non-college-attending peers. The research draws from three waves of data from the National Longitudinal Study of Adolescent Health and examines education, crime levels, substance abuse and socializing among adolescents and young adults.[16] Also, according to Naci Mocan of the University of Colorado and Erdal Tekin of Georgia State University, "We find that unattractive individuals commit more crime in comparison to average-looking ones, and very attractive individuals commit less crime in comparison to those who are average-looking."
Prison statistics
Main article: Incarceration in the United States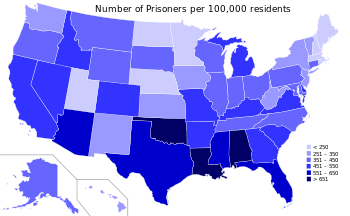 A map of US states according to number of incarcerated individuals per population of 100,000 in 2008.[17]
Compared with other countries, the United States has the highest incarceration rate in the world. As of 2006, a record 7 million people were behind bars, on probation or on parole, of which 2.2 million were incarcerated. The People's Republic of China ranks second with 1.5 million. The United States has 5% of the world's population and 25% of the world's incarcerated population.[18][dated info]
In terms of federal prison, 57% of those incarcerated were sentenced for drug offenses. However, the federal prison population is a very small percentage of the massive state prison population, which also holds numerous people convicted of drug offenses. Currently, considering local jails as well, almost a million of those incarcerated are in prison for non-violent crime.[19] In 2002, 93.2% of prisoners were male. 10.4% of the black males in the United States between the ages of 25 and 29 were sentenced and in prison by year end, as were 2.4% of Hispanic males and 1.2% of white males.[20]
Many sociologists and criminal justice academics argue that this disparity in prison population is reflective of discriminatory sentencing. In a study conducted by the Rand Corporation, it has been estimated that Blacks and Latinos received longer sentences and spent more time in jail than their white counterparts who were convicted of similar crimes and with similar criminal records. One particular example revealed the state of California statistically imposed sentences that averaged 6.5 months longer for Hispanics, and 1.5 months longer for Blacks when compared to white inmates.[21]
More than one in 100 adults in the United States is in jail or prison, an all-time high that costs state governments nearly $50 billion a year and the federal government $5 billion more.[22] With more than 2.3 million people behind bars, the United States leads the world in both the number and percentage of residents it incarcerates, leaving China a remote second, according to a study by the Pew Center on the States. For example, Florida, which has almost doubled its prison population over the past 15 years, has experienced a smaller drop in crime than New York, which, after a brief increase, has reduced its number of inmates to below the 1993 level.
Crime victimology
 This graph shows the homicide victimization rate for whites and blacks, according to the US Bureau of Justice Statistics.
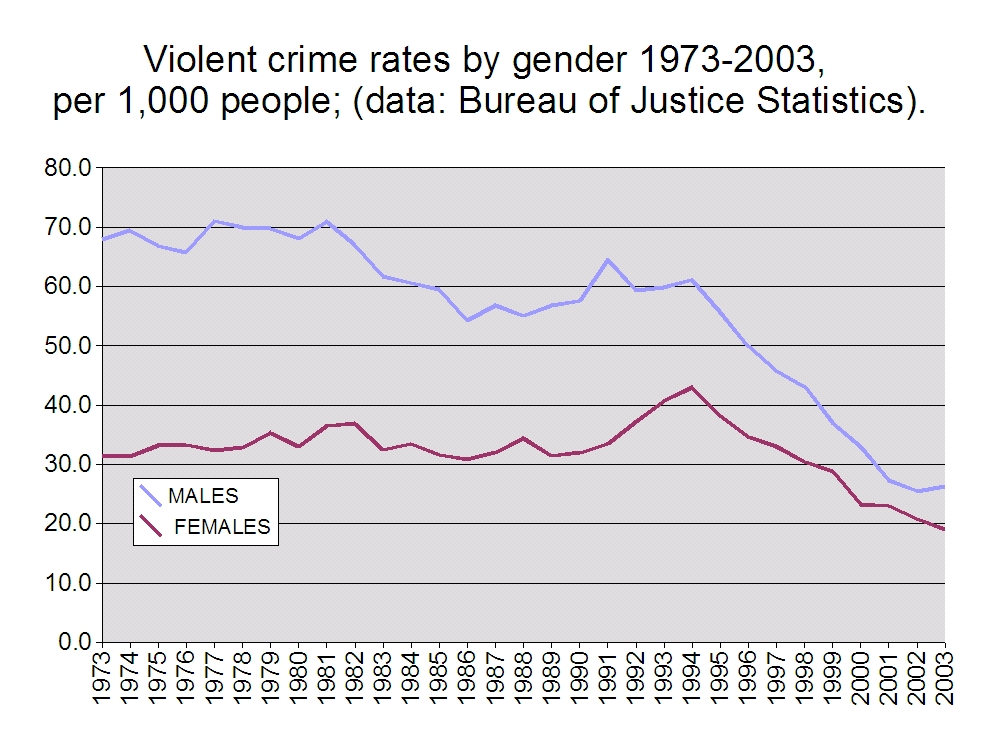
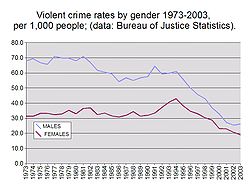 Violent crime rates by gender 1973-2003
Patterns are found within the victimology of crime in the United States. Overall, the financially disadvantaged, females, those younger than 25 and non Whites were more likely to fall victim to crime. Income, sex and age had the most dramatic effect on the chances of a person being victimized by crime, while the characteristic of race depended upon the crime being committed.[citation needed]
In 2005, 2.7% of African Americans became the victim of a violent crime, compared to 2.0% of Whites. African Americans were overall 35% more likely to sustain a violent crime. The likelihood of being murdered was drastically higher for African Americans.[23] In 2004 African Americans constituted roughly 13.4% of the general population,[citation needed] yet, nearly half, 49%, of all murder victims in 2005 were African American.
Sexual assault and rape rates were roughly the same for all races. Whites and African Americans also had approximately the same chances of falling victim to simple assaults.
In terms of gender, males were more likely to become crime victims than were females, with 79% percent of all murder victims being male. Males were also twice as likely to be carjacked as were females.
In terms of income, households with a 2008 annual income of less than $15,000 were significantly more likely to have their homes burgled.[24]
Concerning age, those younger than twenty-five were more likely to fall victim to crime, especially violent crime. The chances of being victimized by violent crime decreased far more substantially with age than the chances of becoming the victim of property crime. For example, 3.03% of crimes committed against a young person were theft, while 20% of crimes committed against an elderly person were theft. Thus, one can conclude that the probability of becoming a violent crime victim decreases as income and age increase, in addition to being lower for European Americans and females.[23]
Crimes against the homeless
A 2007 study found that the number of violent crimes against the homeless is increasing.[25][26] The rate of such documented crimes in 2005 was 30% higher than of those in 1999.[27] 75% of all perpetrators are under the age of 25. Studies and surveys indicate that homeless people have a much higher criminal victimization rate than the non-homeless, but that most incidents never get reported to authorities.
In recent years, largely due to the efforts of the National Coalition for the Homeless (NCH) and academic researchers the problem of violence against the homeless has gained national attention. The NCH called deliberate attacks against the homeless hate crimes in their report Hate, Violence, and Death on Mainstreet USA (they retain the definition of the American Congress).
The Center for the Study of Hate & Extremism at California State University, San Bernardino in conjunction with the NCH found that 155 homeless people were killed by non-homeless people in "hate killings", while 76 people were killed in all the other traditional hate crime homicide categories such as race and religion, combined.[26] The CSHE contends that negative and degrading portrayals of the homeless contribute to a climate where violence takes place.
International comparison
The manner in which America's crime rate compared to other countries of similar wealth and development depends on the nature of the crime used in the comparison.[28] Overall crime statistic comparisons are difficult to conduct, as the definition of crimes significant enough to be published in annual reports varies across countries. Thus an agency in a foreign country may include crimes in its annual reports which the United States omits.
Some countries such as Canada, however, have similar definitions of what constitutes a violent crime, and nearly all countries had the same definition of the characteristics that constitutes a homicide. Overall the total crime rate of the United States is similar to that of other highly developed countries. Some types of reported property crime in the U.S. survey as lower than in Germany or Canada, yet the homicide rate in the United States is substantially higher.
Homicide
The US homicide rate, which has declined substantially since 1991 from a rate per 100,000 persons of 9.8 to 4.8 in 2010, is still among the highest in the industrialized world. There were 14,748 murders in the United States in 2010[29] (666,160 murders from 1960 to 1996).[30] In 2004, there were 5.5 homicides for every 100,000 persons, roughly three times as high as Canada (1.9) and six times as high as Germany (0.9). A closer look at The National Archive of Criminal Justice Data indicates that per-capita homicide rates over the last 30 years on average of major cities, New Orleans' average per capita homicide rate of 52 murders per 100,000 people overall (1980–2009) ranks highest among major U.S. cities[31][32] Most industrialized countries had homicide rates below the 2.5 mark.[33][34]
Country Ireland[35] Germany[36] Netherlands[35] Norway[35] United Kingdom[35] France[35] Canada[31] Scotland[37] United States[38] Russia[39] Venezuela[40] El Salvador[41] Honduras[41] Homicide rate (per hundred thousand) 0.9 0.9 1.0 0.5 1.4 1.6 1.9 1.59 4.8 13 48 65 78 Year 2000 2007 2007 2006 2000 2004 2004 2001 2010 2010 2010 2010 2010 In the United States, the number of homicides where the victim and offender relationship was undetermined has been increasing since 1999 but has not reached the levels experienced in the early 1990s. In 14% of all murders, the victim and the offender were strangers. Spouses and family members made up about 15% of all victims, about one-third of the victims were acquaintances of the assailant, and the victim and offender relationship was undetermined in over one-third of homicides. Gun involvement in homicides were gang related homicides which increased after 1980, homicides that occurred during the commission of a felony which increased from 55% in 1985 to 77% in 2005, homicides resulting from arguments which declined to the lowest levels recorded recently, and homicides resulting from other circumstances which remained relatively constant. Because gang killing has become a normal part of inner cities, many including police, hold preconceptions about the causes of death in inner cities. When a death is labeled gang related it lowers the chances that it will be investigated and increases the chances that the perpetrator will remain at large. In addition, victims of gang killings often determine the priority a case will be given by police. Jenkins (1988) argues that many serial murder cases remain unknown to police and that cases involving Black offenders and victims are especially likely to escape official attention.[42]
Violent crime
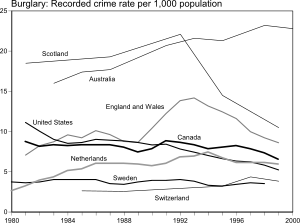 The burglary rates of selected developed countries as published by the US Bureau of Justice Statistics
The reported US violent crime rate includes only Aggravated Assault, whereas the Canadian violent crime rate includes all categories of assault, including the much-more-numerous Assault level 1 (i.e., assault not using a weapon and not resulting in serious bodily harm).[31][32] A government study concluded that direct comparison of the 2 countries' violent crime totals or rates was "inappropriate".[43]
Property crime
According to a 2004 study by the Bureau of Justice Statistics, looking at the period from 1981 to 1999, the United States had a lower surveyed residential burglary rate in 1998 than Scotland, England, Canada, the Netherlands, and Australia. The other two countries included in the study, Sweden and Switzerland, had only slightly lower burglary rates. (Note: The rate of burglary in Police records remained higher in the U.S. than most other countries during the study period (see graph)). For the first nine years of the study period the same surveys of the public showed only Australia with rates higher than the U.S. The authors noted various problems in doing the comparisons including infrequent data points (The U.S. performed 5 surveys from 1995 to 1999 when its rate dipped below Canada's while Canada ran a single telephone survey during that period for comparison).[28]
Physical abuse and neglect of children
According to a 2001 report from UNICEF, the United States has the highest rate of deaths from child abuse and neglect of any industrialised nation, at 2.4 per 100,000 children; France has 1.4, Japan 1, UK 0.9 and Germany 0.8. According to the US Department of Health, the state of Texas has the highest death rate, at 4.05 per 100,000 children, New York has 2.46, Oregon 1.49 and New Hampshire 0.35. [44]
Geography of crime
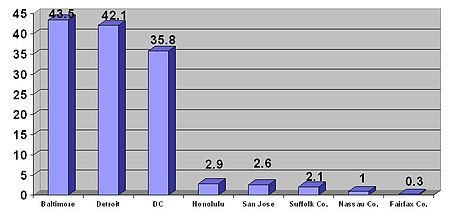 This graph shows the homicide rate for America's three worst and five best ranking jurisdictions in 2004.[45]Further information: United States cities by crime rate
Location has a very significant impact on crime in the United States. While some responding jurisdictions are nearly free of serious crime, others are plagued by some of the highest serious crime rates in the industrialized world. The homicide rate exemplifies the stark differences between communities.
For example, in 2004 the New Orleans police departments reported more homicides per 100,000 residents than any other jurisdiction. The rate of homicide per 100,000 was 56.0, which was ten times the national average. By contrast, in 2005 Forbes magazine listed Long Island, one of the suburban areas of New York City, which is also one of the wealthiest and most expensive communities in the United States, as having 2.042 crimes per 100,000 residents; the lowest crime rate and less than half the US average [3].
Fairfax County, Virginia, a very affluent suburban enclave of the nation's capital with 1,041,200 residents, had the lowest homicide rate of any jurisdiction. In 2004, Fairfax County's homicide rate was reported at 0.3 homicides per 100,000 persons, 94.5% below the national average and 1/145 of Philadelphia's homicide rate. It is therefore important to remember that the risk of being victimized by crime in the United States varies greatly from locale to locale.[46][47]
Large cities
Crime among the country's twenty largest cities tended to be above the national average. It is, however, important to note that these statistics exclude the given city's suburbs and only reflect the crime rates within the jurisdiction of a given city's police department.
Rates are based on cases per 100,000 for all of calendar 2007.
City State Population Violent crime Murder and nonnegligent manslaughter Forcible rape Robbery Aggravated assault Property crime Burglary Larceny-theft Motor vehicle theft Arson Austin Texas 716,817 540 4 46 203 287 6,341 1,120 4,808 413 16 Baltimore Maryland 624,237 1,631 45 23 624 939 4,796 1,182 2,682 932 65 Chicago Illinois 2,824,434 N/A[48] 16 N/A[48] 546 617 4,472 876 2,937 659 25 Columbus Ohio 735,981 852 11 90 523 228 6,996 1,952 4,198 846 87 Dallas Texas 1,239,104 1,069 16 41 583 429 6,776 1,814 1,113 73 Detroit Michigan 860,971 2,289 46 40 764 1,440 6,772 2,064 2,430 2,278 88 El Paso Texas 616,029 418 3 42 77 297 3,201 349 2,361 492 13 Fort Worth Texas 670,693 667 9 50 242 367 5,469 1,343 3,726 400 34 Houston Texas 2,169,544 1,132 16 32 529 555 5,684 1,339 3,449 897 48 Indianapolis Indiana 797,268 1,234 14 63 507 649 6,308 1,679 3,666 963 42 Jacksonville Florida 797,350 1,022 15 31 391 584 5,696 1,394 3,698 604 23 Los Angeles California 3,870,487 718 10 26 348 334 2,621 507 1,506 608 57 Memphis Tennessee 669,264 1,951 19 68 728 1,136 8,062 2,183 4,953 926 22 New York New York 8,220,196 614 6 11 265 332 1,819 254 1,403 161 N/A Philadelphia Pennsylvania 1,635,533 1,475 47 37 1215 767 4,305 803 2,728 774 N/A Phoenix Arizona 1,541,698 724 14 33 321 356 5,826 1,246 3,227 1,353 32 San Antonio Texas 1,316,882 556 9 48 186 313 6,390 1,272 4,607 511 35 San Diego California 1,261,196 502 5 23 166 308 3,502 609 1,845 1,049 16 San Francisco California 733,799 1,037 14 17 514 493 4,696 692 3,199 804 32 San Jose California 934,553 402 4 23 114 261 2,575 476 1,412 686 36 SOURCES: FBI Uniform Crime Reports (2007)[49]
States
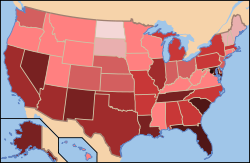 Map of violent crime per 100,000 people in the USA by state in 2004.< 100>100-200>200-300>300-400>400-500>500-600>600-700>700-800>800
Crime rates vary greatly across the states. Overall, New England had the lowest crime rates, for both violent and property crimes. New England states also had the lowest homicide rates in the country.
A closer look at per capita homicide rates for each state from FBI Uniform Crime Reports Bureau of Justice Statistics indicate that Louisiana's per capita homicide rate has ranked 1st every single year from 1989 to 2010, which is 22 consecutive years.
Southern states had the highest overall crime rates. Crime can also be isolated to one particular part of a state. Lafayette, Louisiana, for instance had 6 murders per 100,000 people in 2004, while New Orleans, Louisiana, had 56 murders per 100,000 people according to Bureau of Justice Statistics for the same year.[50]
Almost all of the nation's wealthiest twenty states, which included northern mid-western and western states such as Wisconsin and California, had crime rates below the national average. In addition to having the country's lowest crime rates, New England states also had the country's highest median household income, while the Southern states have the lowest.
This contrasts starkly to some of the nation's poorer states such as Georgia, Florida or Louisiana. Louisiana had a crime rate 27% and a homicide rate 130.9% above the national average and ranked as the nation's fourth poorest state with a median household income 20% below the national median. While poorer states generally have higher crime rates, several states who fell below the national median for household income such as Maine and Kentucky also had crime rates below the national average, while some wealthier states such as Maryland and Hawaii had crime rates above the national average.[50][51]
See also
- List of United States criminals
- List of serial killers in the United States of America
- List of U.S. serial killers by region
- List of serial killers in the United States of America
- United States cities by crime rate
- Race and crime in the United States
- Rape in the United States of America
- Gangs in the United States
- National Crime Information Center Interstate Identification Index
- America's Safest and Most Dangerous Cities
Related:
- Terrorism in the United States
- Incarceration in the United States
- Law enforcement in the United States
References
- ^ FBI Uniform Crime Reports
- ^ "Characteristics of crime victims, US Bureau of Justice Statistics". Archived from the original on 2006-09-26. http://web.archive.org/web/20060926003700/http://www.ojp.usdoj.gov/bjs/cvict_v.htm. Retrieved 2006-09-27.
- ^ "Crime in San Mateo County in 2001, US Bureau of Justice Statistics". http://bjsdata.ojp.usdoj.gov/dataonline/Search/Crime/Local/RunCrimeOneYearofData.cfm. Retrieved 2006-09-27.
- ^ http://www.fbi.gov/ucr/cius2008/offenses/expanded_information/homicide.html
- ^ Fosdick, Raymond (1920). American Police Systems. The Century Co.. p. 13. ISBN 0875850537.
- ^ "Surviving Crime". ShaveMagazine.com. http://www.shavemagazine.com/lifestyle/090501.
- ^ a b Donohue, John; Levitt, Steven (2000-03-01). "The Impact in Legalized Abortion on Crime". Berkeley Program in Law & Economics, Working Paper Series 2000 (2): 69. http://www.bepress.com/cgi/viewpdf.cgi?article=1028&context=blewp&preview_mode=. Retrieved 2007-10-05.[dead link]
- ^ a b "Crime in the US, 1986-2005, FBI". http://www.fbi.gov/ucr/05cius/data/table_01.html. Retrieved 2006-09-29.
- ^ a b c "Crime in the US, 1960-2004, Bureau of Justice Statistics". http://bjsdata.ojp.usdoj.gov/dataonline/Search/Crime/State/StateCrime.cfm. Retrieved 2006-09-29.
- ^ a b "Crime in the US, 1991-2010, FBI". http://www.fbi.gov/about-us/cjis/ucr/crime-in-the-u.s/2010/crime-in-the-u.s.-2010/tables/10tbl01.xls. Retrieved 2011-09-19.
- ^ http://www.fbi.gov/ucr/cius2008/offenses/clearances/index.html
- ^ http://www.fbi.gov/ucr/cius2008/offenses/violent_crime/murder_homicide.html
- ^ Anthony Walsh (2004). "Race and crime: a biosocial analysis". Nova Publishers. p.23. ISBN 1590339703
- ^ http://www.fbi.gov/ucr/cius2008/data/table_43.html
- ^ a b [1]
- ^ Male College Students More Likely than Less-Educated Peers to Commit Property Crimes Newswise, Retrieved on August 3, 2008.
- ^ United States Bureau of Justice Statistics (December 2009). "Prisoners in 2008". United States Department of Justice. http://bjs.ojp.usdoj.gov/content/pub/pdf/p08.pdf. Retrieved 2010-04-03.
- ^ Report: 7 million Americans in justice system
- ^ "America's One-Million Nonviolent Prisoners". Center on Juvenile and Criminal Justice. Archived from the original on 2006-06-08. http://web.archive.org/web/20060608002810/http://www.cjcj.org/pubs/one_million/onemillionexec.html. Retrieved 2006-06-13.
- ^ "Prisoners in 2002" (PDF). Bureau of Justice Statistics. Archived from the original on 2005-12-28. http://web.archive.org/web/20051228145956/http://www.ojp.usdoj.gov/bjs/pub/pdf/p02.pdf. Retrieved 2006-06-13.
- ^ http://www.rand.org/pubs/papers/2008/P7742.pdf
- ^ Aizenman, N.C.. "New High in Prison Numbers". The Washington Post February 29, 2008: 1-1.
- ^ a b "Victim characteristics, US Bureau of Justice Statistics, 2005". Archived from the original on 2006-09-26. http://web.archive.org/web/20060926003700/http://www.ojp.usdoj.gov/bjs/cvict_v.htm#income. Retrieved 2006-09-29.
- ^ Michael R. Rand, National Crime Victimization Survey: Criminal Victimization, 2008, Table 5, Bureau of Justice Statistics Bulletin, September 2009, NCJ 227777, US Department of Justice. Accessed February, 2010.
- ^ Lewan, Todd, "Unprovoked Beatings of Homeless Soaring", Associated Press, April 8, 2007.
- ^ a b National Coalition for the Homeless, Hate, "Violence, and Death on Main Street USA: A report on Hate Crimes and Violence Against People Experiencing Homelessness, 2006", February 2007.
- ^ National Coalition for the Homeless: A Dream Denied.
- ^ a b "National Crime Rates Compared". http://www.crimereduction.gov.uk/statistics/statistics35.htm. Retrieved 2006-09-29.
- ^ Crime in the United States 2010
- ^ Twentieth Century Atlas - Homicide
- ^ a b c "Crime in Canada, Canada Statistics". http://www.statcan.ca/Daily/English/050721/d050721a.htm. Retrieved 2006-09-27.
- ^ a b "BKA, German federal crime statistics 2004 (German)" (PDF). http://www.bka.de/pks/pks2004ev/pcs_2004.pdf. Retrieved 2006-09-27.
- ^ "Homicide rate comparisons". http://www.benbest.com/lifeext/murder.html. Retrieved 2006-09-29.
- ^ "National homicide rates, Nation Master.com". http://www.nationmaster.com/graph/cri_mur_percap-crime-murders-per-capita#rest. Retrieved 2006-09-29.
- ^ a b c d e "National homicide rates, UN data published by Nation Master.com". http://www.nationmaster.com/graph/cri_mur_percap-crime-murders-per-capita#rest. Retrieved 2006-09-29.
- ^ "BKA, German federal crime statistics 2007 (German)" (PDF). http://www.bka.de/pks/pks2007/download/pks-jb_2007_bka.pdf. Retrieved 2009-01-17.
- ^ "Eighth United Nations survey of crime trends and operations of criminal justice systems, covering the period 2001 - 2002" (PDF). United Nations Office on drugs and crime division for policy analysis and public affairs. pp. 28–29. Archived from the original on 2006. http://www.google.com/search?q=cache%3Ahttp%3A//www.unodc.org/pdf/crime/eighthsurvey/8sv.pdf. Retrieved 2006-12-02.
- ^ "Crime in The United States 2010, FBI Statistics". http://www.fbi.gov/about-us/cjis/ucr/crime-in-the-u.s/2010/crime-in-the-u.s.-2010/tables/10tbl01.xls. Retrieved 2011-09-19.
- ^ "Vital statistics by the Subjects of the Russian Federation". Rosstat. http://translate.google.com/translate?hl=en&sl=ru&u=http://www.gks.ru/free_doc/2010/demo/edn12-10.htm&ei=ZkKjTdS9CI6-tgfPz7WGAw&sa=X&oi=translate&ct=result&resnum=1&ved=0CB0Q7gEwAA&prev=/search%3Fq%3Dhttp://www.gks.ru/free_doc/2010/demo/edn12-10.htm%26hl%3Den%26sa%3DG%26biw%3D1440%26bih%3D703%26prmd%3Divns. Retrieved 2011-04-03.
- ^ http://www.bbc.co.uk/mundo/noticias/2011/02/110209_venezuela_asamblea_inseguridad_cifras_jp.shtml
- ^ a b "Homicidios en Centroamérica" (in Spanish) (PDF). La Prensa Grafica de El Salvador. pp. 1, 3. http://multimedia.laprensagrafica.com/pdf/2011/03/20110322-PDF-Informe-0311-Homicidios-en-Centroamerica.pdf. Retrieved 2011-08-02.
- ^ Jenkins, P. (1988). Myth and murder: the serial killer panic of 1983-1985, Criminal Justice Research Bulletin. 3(11) 1-7.
- ^ Feasibility Study on Crime Comparisons Between Canada and the United States Maire Gannon, Canadian Centre for Justice Statistics, Statistics Canada, Cat. no. 85F0035XIE, Accessed June 28, 2009
- ^ BBC - America's child death shame, 17 October 2011
- ^ "Crime in CA, FBI, 2005". http://www.fbi.gov/ucr/05cius/data/table_08_ca.html. Retrieved 2006-09-29.
- ^ "Crime in PA, FBI, 2005". http://www.fbi.gov/ucr/05cius/data/table_08_md.html. Retrieved 2006-09-29.[dead link]
- ^ "Crime in VA counties, FBI, 2005". http://www.fbi.gov/ucr/05cius/data/table_10_va.html. Retrieved 2006-09-29.[dead link]
- ^ a b The data collection methodology for the offense of forcible rape used by the Illinois state UCR Program (with the exception of Rockford, Illinois) does not comply with national UCR Program guidelines. Consequently, their figures for forcible rape and violent crime (of which forcible rape is a part) are not published in this table. Source: "Illinois Offenses Known to Law Enforcement by City, 2007". Crime in the United States, 2007. September 2008. http://www.fbi.gov/ucr/cius2007/data/table_08_il.html. Retrieved 2009-01-31.[dead link]
- ^ http://www.fbi.gov/ucr/cius2007/data/table_08.html
- ^ a b "Crime by State and region, FBI". http://www.fbi.gov/ucr/05cius/data/table_04.html. Retrieved 2006-09-29.[dead link]
- ^ "US Census Bureau, median household income by state 2004". Archived from the original on 2006-06-28. http://web.archive.org/web/20060628082502/http://www.census.gov/hhes/www/income/income04/statemhi.html. Retrieved 2006-07-01.
External links
- The FBI's Ten Most Wanted Fugitives
- Surviving Crime
- 15 Most Wanted by U.S. Marshals
- DEA Fugitives, Major International Fugitives
- Metropolitan Police Department: Most Wanted
- New York State's 100 Most Wanted Fugitives
- All Most Wanted - official website of the Los Angeles Police Department
Life in the United States Affluence · Crime · Culture · Economic issues · Education (attainment) · Family structure · Health care · Health insurance · Holidays · Household income · Homelessness · Homeownership · Human rights · Income inequality · Labor unions · Languages · Middle class · Passenger vehicle transport · Personal income · Political ideologies · Poverty · Racism · Religion · Social class · Society · Sports · Standard of living · Wealth
Sovereign states Antigua and Barbuda · Bahamas · Barbados · Belize · Canada · Costa Rica · Cuba · Dominica · Dominican Republic · El Salvador · Grenada · Guatemala · Haiti · Honduras · Jamaica · Mexico · Nicaragua · Panama · Saint Kitts and Nevis · Saint Lucia · Saint Vincent and the Grenadines · Trinidad and Tobago · United States
Dependencies and
other territoriesAnguilla · Aruba · Bermuda · Bonaire · British Virgin Islands · Cayman Islands · Curaçao · Greenland · Guadeloupe · Martinique · Montserrat · Puerto Rico · Saint Barthélemy · Saint Martin · Saint Pierre and Miquelon · Saba · Sint Eustatius · Sint Maarten · Turks and Caicos Islands · United States Virgin Islands
Crime in the United States by state States - Alabama
- Alaska
- Arizona
- Arkansas
- California
- Colorado
- Connecticut
- Delaware
- Florida
- Georgia
- Hawaii
- Idaho
- Illinois
- Indiana
- Iowa
- Kansas
- Kentucky
- Louisiana
- Maine
- Maryland
- Massachusetts
- Michigan
- Minnesota
- Mississippi
- Missouri
- Montana
- Nebraska
- Nevada
- New Hampshire
- New Jersey
- New Mexico
- New York
- North Carolina
- North Dakota
- Ohio
- Oklahoma
- Oregon
- Pennsylvania
- Rhode Island
- South Carolina
- South Dakota
- Tennessee
- Texas
- Utah
- Vermont
- Virginia
- Washington
- West Virginia
- Wisconsin
- Wyoming
Federal district Insular areas - American Samoa
- Guam
- Northern Mariana Islands
- Puerto Rico
- U.S. Virgin Islands
Outlying islands - Bajo Nuevo Bank
- Baker Island
- Howland Island
- Jarvis Island
- Johnston Atoll
- Kingman Reef
- Midway Atoll
- Navassa Island
- Palmyra Atoll
- Serranilla Bank
- Wake Island
Categories:


Wikimedia Foundation. 2010.