- Demographics of Nova Scotia
-
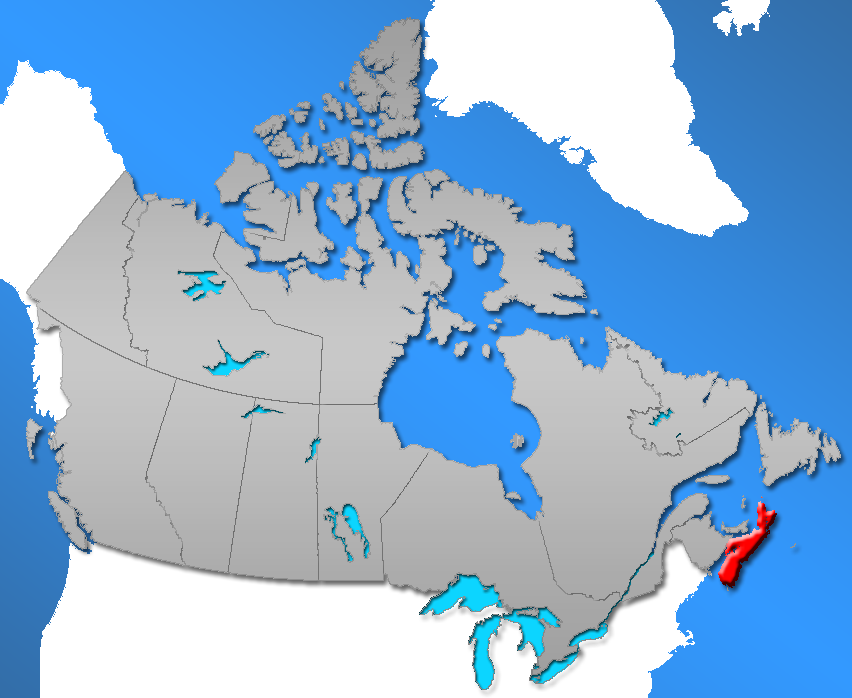
Nova Scotia (Latin for New Scotland; Scottish Gaelic: Alba Nuadh; French: Nouvelle-Écosse) is a Canadian province located on Canada's southeastern coast. It is the most populous province in the Atlantic Canada, and its capital, Halifax, is a major economic centre of the region. Nova Scotia is the second smallest province in Canada, with an area of 55,284 km². Its population of 934,405[1] makes it the fourth least populous province of the country.
Contents
Population
Nova Scotia is the seventh most populous province in Canada with an estimated 936,988 residents as of January 1, 2006. It accounts for 3% of the population of Canada. The population density is approximately 17.2 persons/km². Roughly 60% of the population live in rural parts of the province.
Most populous urban areas
The largest urban area in Nova Scotia is that surrounding Halifax.
2006 census population figures for the next biggest urban areas are shown in the table below:Rank Urban area 2006 population 1. Halifax 282,924 2. Sydney 33,012 3. Truro 22,376 4. New Glasgow 20,876 5. Glace Bay 19,968 6. Sydney Mines 15,500 7. Kentville 14,613 8. New Waterford 9,661 9. Amherst 9,547 10. Bridgewater 8,021 11. Yarmouth 7,162 12. Kingston - Greenwood 6,528 13. Antigonish 4,665 14. Windsor 3,986 15. Springhill 3,941 16. Pictou 3,813 17. Wolfville 3,772 18. Lake Echo 3,527 19. Port Hawkesbury 3,517 20. Enfield 3,415 21. Liverpool 2,759 22. Berwick 2,524 23. Lunenburg 2,317 24. Digby 2,097 25. Shelburne 1,879 Source: Statistics Canada [2]
Population of Nova Scotia since 1851
Year Population % change Rank* 5-year 10-year 1851 276,854 – – 3 1861 330,857 – 19.5 1871 387,800 – 17.2 1881 440,572 – 13.6 1891 450,396 – 2.2 1901 459,574 – 2.0 1911 492,338 – 7.1 4 1921 523,837 – 6.4 7 1931 512,846 – 2.1 1941 577,962 – 12.7 1951 642,584 – 11.2 Year Population % change Rank* 5-year 10-year 1956 694,717 8.1 – 7 1961 737,007 6.1 14.7 1966 756,039 2.6 8.8 1971 788,965 4.4 7.0 1976 828,570 5.0 9.6 1981 847,442 2.3 7.4 1986 873,175 3.0 5.4 1991 899,942 3.1 6.2 1996 909,282 1.0 4.1 2001 908,007 0.1 0.9 2006 913,462 0.6 2.8 Source: Statistics Canada [3][1]
* among provinces.
** Preliminary 2006 census estimate.Languages
The 2006 Canadian census showed a population of 913,462.
Of the 899,270 singular responses to the census question concerning mother tongue the most commonly reported languages were:1. English 832,105 92.53% 2. French 32,540 3.62% 3. Arabic 4,425 0.49% 4. Algonquian languages 4,120 0.46% Mi'kmaq 4,060 0.45% 5. German 4,045 0.45% 6. Chinese languages 3,370 0.37% Mandarin 595 0.07% Cantonese 505 0.06% 7. Dutch 2,440 0.27% 8. Polish 1,570 0.17% 9. Spanish 1,305 0.15% 10. Greek 1,035 0.12% 11. Italian 905 0.10% 12. Korean 860 0.10% 13. Persian 715 0.08% 14. Serbo-Croatian languages 670 0.07% Croatian 250 0.03% Serbo-Croatian 235 0.03% Bosnian 95 0.01% Serbian 85 0.01% 15. Scandinavian languages 615 0.07% Danish 235 0.03% Norwegian 175 0.02% Icelandic 120 0.01% Swedish 80 0.01% 16. Russian 585 0.06% 17. Portuguese 560 0.06% 18. Urdu 550 0.06% 19. Vietnamese 500 0.06% 20. Ukrainian 440 0.05% 21. Panjabi 420 0.05% 22. Tagalog 415 0.05% 23. Hindi 410 0.05% 24. Bengali 395 0.04% 25. Hungarian 340 0.04% 26. Celtic languages 330 0.04% Gaelic languages 305 0.03% 27. Japanese 290 0.03% 28. Gujarati 220 0.02% 29. Czech 180 0.02% 30. Romanian 170 0.02% There were also 145 single-language responses for Turkish; 140 for Non-verbal languages (Sign languages); 125 for Malay; 120 for Bantu languages; 100 for Kurdish; 100 for Slovak; and 95 for Estonian. In addition, there were also 105 responses of English and a non-official language; 25 of French and a non-official language; 495 of English and French; and 10 of English, French, and a non-official language. Figures shown are for the number of single language responses and the percentage of total single-language responses.[4]
Migration
Immigration
The 2006 Canadian census counted a total of 45,195 immigrants living in Nova Scotia.
The most commonly reported origins for these immigrants were: [5]Country Immigrants 1. United Kingdom 11,665 2. United States 7,960 3. Germany 2,850 4. Netherlands 1,830 5. China 1,740 6. India 1,440 7. Lebanon 1,265 8. Poland 970 9. Kuwait 780 10. Egypt 675 11. former Yugoslavia 670 12. Greece 545 13. Italy 540 14. France 530 15. Iran 520 16. Pakistan 450 17. South Korea 430 18. Ireland (Eire) 425 19. Philippines 420 20. Vietnam 375 There were also 365 immigrants from Australia; 320 from South Africa; 280 from Hong Kong; 255 from Saudi Arabia; 245 from Iraq and from Trinidad and Tobago; 225 from Hungary and from Russia; 220 from Portugal; 215 from Switzerland; 210 from Denmark; and 205 from Belize.
Internal migration
A total of 101,035 people moved to Nova Scotia from other parts of Canada between 1996 and 2006 while 110,335 people moved in the opposite direction. These movements resulted in a net outmigration of 11,925 people to Alberta and 4,120 to Ontario; as well as a net influx of 4,690 people from Newfoundland and Labrador and 2,930 from New Brunswick. During this period there was a net outmigration of 835 francophones to Quebec and 340 to Alberta; and a net influx of 575 anglophones from Quebec and 145 francophones from New Brunswick. (All net inter-provincial movements of more than 500 persons and official minority movements of more than 100 persons are given.)[6][7]
Religion
According to the 2001 census 36.5% of Nova Scotians were Roman Catholic, while 15.9% belonged to the United Church of Canada and 13.4% were Anglican. About 10.6% of the population identified as Baptist, 2.5% as Presbyterian, 1.7% as simply Protestant, 1.2% as Lutheran, 1.1% as simply Christian, and 1.0% as Pentecostal. 0.5% of the population reported belonging to the Jehovah's Witnesses, and 0.4% to the Salvation Army; while 0.4% identified as Muslim, 0.3% as Mormon, 0.2% as Wesleyan, 0.2% as Jewish, 0.2% as Greek Orthodox, 0.2% as Buddhist, and 0.2% as Seventh-day Adventist. 11.6% said they had no religion. [8]
Employment
As of November 2009, the unemployment rate is 9.2 percent. [9]
Income
Median Household Income By County By Community Rank County 2006 1 Halifax County $54,108 2 Hants County $49,630 3 Antigonish County $49,581 Nova Scotia $46,605 4 Inverness County $45,687 5 Kings County $44,744 6 Victoria County $44,134 7 Pictou County $43,475 8 Lunenburg County $43,257 9 Colchester County $42,782 10 Yarmouth County $41,744 11 Shelburne County $40,514 12 Cape Breton County $40,451 13 Richmond County $40,188 14 Queens County $39,972 15 Cumberland County $38,433 16 Digby County $38,284 17 Annapolis County $37,024 18 Guysborough County $34,894 Rank Community 2006 1 Halifax Regional Municipality $54,129 2 Hantsport $49,283 3 Port Hawkesbury $48,141 Nova Scotia $46,605 4 Kentville $44,164 5 Berwick $43,730 6 Trenton $43,687 7 Pictou $41,905 8 Stewiacke $41,787 9 Cape Breton Regional Municipality $41,257 10 Middleton $40,351 11 Mulgrave $40,339 12 Stellarton $40,252 13 Bridgewater $40,123 14 New Glasgow $39,979 15 Westville $38,262 16 Bridgetown $38,248 17 Antigonish $38,100 18 Lunenburg $37,822 19 Oxford $37,734 20 Truro $37,056 21 Springhill $36,995 22 Wolfville $36,979 23 Amherst $36,539 24 Annapolis Royal $36,480 25 Mahone Bay $36,374 26 Clark's Harbour $35,830 27 Shelburne $35,341 28 Windsor $34,414 29 Lockeport $33,854 30 Yarmouth $31,584 31 Canso $30,502 32 Digby $28,551 33 Parrsboro $27,472 Gross Domestic Product
Nova Scotia GDP is presently approximately $33 billion (Can) annually.
See also
References
- ^ a b Canada's population. Statistics Canada. Last accessed September 28, 2006.
- ^ Population and dwelling counts, for Canada, provinces and territories, and urban areas (2006 Census)
- ^ Population urban and rural, by province and territory (Nova Scotia). Statistics Canada, 2005.
- ^ Detailed Mother Tongue (186), Knowledge of Official Languages (5), Age Groups (17A) and Sex (3) (2006 Census)
- ^ Immigrant Status and Period of Immigration (8) and Place of Birth (261) (2006 Census)
- ^ Province or Territory of Residence 5 Years Ago (14), Mother Tongue (8), Age Groups (16) and Sex (3) (2006 Census)
- ^ Province or Territory of Residence 5 Years Ago (14), Mother Tongue (8), Age Groups (16) and Sex (3) (2001 census)
- ^ Religion (95A), Age Groups (7A)
- ^ http://www.gov.ns.ca/finance/publish/lmm/LMM0911.pdf Unemployment rate
 Demographics of Canada (by province or territory)Alberta · British Columbia · Manitoba · New Brunswick · Newfoundland and Labrador · Nova Scotia · Ontario · Prince Edward Island · Quebec · Saskatchewan
Northwest Territories · Nunavut · Yukon Book ·
  Category ·
  Portal ·
  WikiProject People of Canada
Ethnic ancestry CanadaAfricaAmericasNorth AmericaCaribbeanEast AsiaSouth AsiaSoutheast AsiaWest AsiaEuropeNorthern EuropeWestern EuropeCentral EuropeSouthern EuropeBalkan PeninsulaEastern EuropeOceaniaAustralianDemographics Languages · Religion · Population totals · 1666 census · 1911 Census · 1996 Census · 2001 Census · 2006 Census · 2011 Census
By province & territory.. Alberta · British Columbia · Manitoba · New Brunswick · Newfoundland & Labrador · Nova Scotia · Ontario · Prince Edward Island · Quebec · Saskatchewan · Yukon · Northwest Territories · Nunavut
By city.. Edmonton · Montreal · Ottawa · Toronto · VancouverCulture
& societyArchitecture · Art · Charter · Cinema · Citizenship · Crime · Cuisine · Education · Government · Health · History · Identity · Immigration · Law
Literature · Media · Military · Multiculturalism · Music · Nationalism · Politics · Poverty · Protection of · Social welfare · Sport · Symbols · Theatrelist of
CanadiansMembers of.. Canada's Walk of Fame · Fathers of Confederation · Historic significance · Order of Canada (Companions) · The Greatest Canadian · Victoria Cross
Individuals by.. Aboriginals · Actors · Artists · Composers · Monarchs · Musicians · Painters · Prime Ministers
Net worth · Province and city · Radio personalities · Sports personalities · TV personalities · WritersOrders, medals
& decorations Category · Portal · WikiProjectCategories:- Demographics of Canada
- Nova Scotia society
Wikimedia Foundation. 2010.