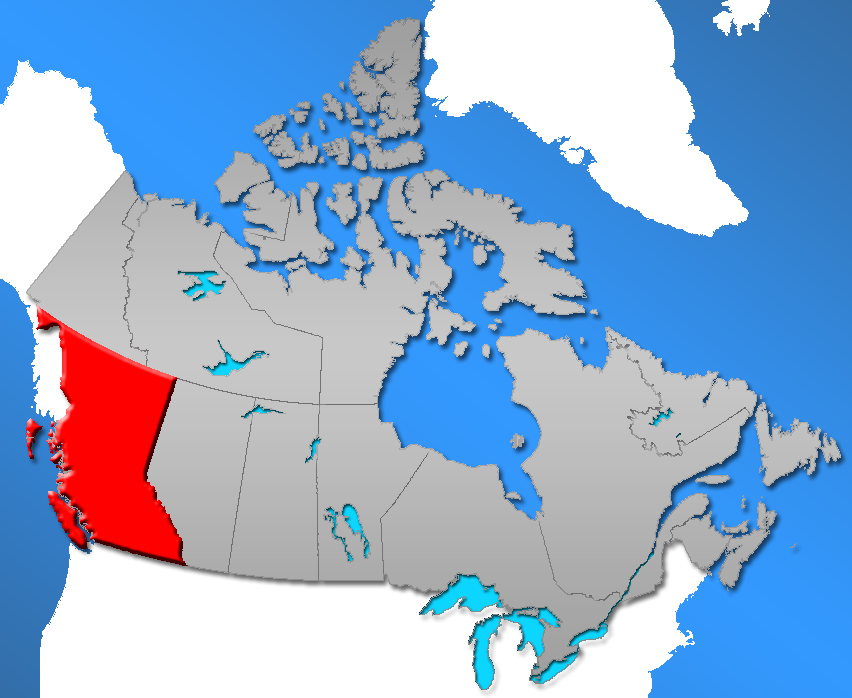
- Demographics of British Columbia
-
 Map of British Columbia regional districts with population density.
Estimated Population of British Columbia (2005): 4,254,500
Percentage of National Population: 13.2%
Population Growth Rate: 4.9%
See also: Demographics of CanadaContents
Vital Statistics
Birth rate: 9.7 births p/1,000 [1](Canadian Average = ~11)
Death rate: 2.3 deaths p/1,000
Infant mortality rate: 4.0 deaths p/1,000 live births [2]
Life expectancy at Birth: 81.12 years [3]
Total fertility rate: 1.4 children born p/woman [4] (Canadian Average = 1.61)
Population of British Columbia since 1851
Year Population Five Year
% changeTen Year
% changeRank Among
Provinces1851 55,000 n/a n/a n/a 1861 51,524 n/a -6.3 n/a 1871 36,247 n/a -29.7 7 1881 49,459 n/a 36.4 8 1891 98,173 n/a 98.5 8 1901 178,657 n/a 82.0 6 1911 392,480 n/a 119.7 6 1921 524,582 n/a 33.7 6 1931 694,263 n/a 32.3 6 1941 817,861 n/a 17.8 4 1951 1,165,210 n/a 42.5 3 1956 1,398,464 20.0 n/a 3 1961 1,629,082 16.5 39.8 3 1966 1,873,674 15.0 34.0 3 1971 2,184,620 16.6 34.1 3 1976 2,466,610 12.9 31.6 3 1981 2,744,467 11.3 25.6 3 1986 2,883,370 5.1 16.9 3 1991 3,282,061 13.8 19.6 3 1996 3,724,500 13.5 29.2 3 2001 3,907,738 4.9 19.1 3 2006 4,113,487 5.4 10.4 3 - Source: Statistics Canada[5]
Age Structure
Males Females Age
GroupNumber Per cent Number Per cent 0-4 105,808 2.4% 100,116 2.2% 5-9 117,909 2.8% 111,383 2.6% 10-14 133,809 3.1% 126,388 3.0% 15-19 143,449 3.4% 136,227 3.2% 20-24 155,369 3.7% 147,770 3.5% 25-29 139,521 3.3% 138,299 3.3% 30-34 144,788 3.4% 145,869 3.4% 35-39 155,429 3.7% 158,364 3.7% 40-44 177,381 4.2% 179,216 4.2% 45-49 172,786 4.1% 177,082 4.2% 50-54 157,596 3.7% 159,965 3.8% 55-59 138,096 3.2% 139,772 3.3% 60-64 101,610 2.4% 103,764 2.4% 65-69 80,051 1.9% 82,363 1.9% 70-74 70,060 1.6% 72,493 1.7% 75-79 54,572 1.3% 64,344 1.5% 80-84 36,304 0.8% 53,047 1.2% 85+ 24,544 0.6% 48,978 1.1% Totals 2,109,082 49.6% 2,145,440 50.4% - Source: BC Stats [6]
Ethnicity
British Columbia has a very diverse ethnic population, with a large number of immigrants having lived in the province for 30 years or less. First-generation immigrants from the British Isles remain a strong component of local society despite limitations on immigration from Britain since the ending of special status for British subjects in the 1960s. Also present in large numbers relative to other cities in Canada (except Toronto), and also present in BC ever since the province was first settled (unlike Toronto), are many European ethnicities of the first and second generation, notably Germans, Ukrainians, Scandinavians, Yugoslavs and Italians; third-generation Europeans are generally of mixed lineage, and traditionally intermarried with other ethnic groups more than in any other Canadian province. The percentages add to more than 100% because of dual responses (e.g. "French-Canadian" generates an entry in both the category "French" and the category "Canadian"). In recent decades, the proportion of those of Chinese ethnicity has risen sharply, though still outnumbered by the historically-strong population of those of German ancestry. Visible minorities have become an important factor in ethnic-based politics, though most visible minorities are less numerous than the long-standing non-British European ethnicities making up BC's "invisible minorities".
- Further information: Statistics Canada. "Population by selected ethnic origins, by province and territory (2006 Census) (British Columbia)"[7]
Note: The following statistics represent both single (e.g., "German") and multiple (e.g., "part Chinese, part English") responses to the 2006 Census, and thus do not add up to 100%.
Ethnic Origin Population Percent English 1,207,245 29.63% Scottish 828,145 20.32% Canadian 720,200 17.67% Irish 618,120 15.17% German 561,570 13.78% Chinese 432,435 10.60% French 361,215 8.86% Indian 232,370 5.70% Ukrainian 197,265 4.84% Dutch (Netherlands) 196,420 4.82% North American Indian 193,060 4.74% Italian 143,155 3.51% Norwegian 129,420 3.18% Polish 128,360 3.15% Russian 114,105 2.80% Welsh 104,275 2.56% Swedish 104,025 2.55% - Source: Statistic Canada[8]
Visible Minorities
Asians are by far the largest visible minority demographic, with many of the Lower Mainland's large cities having sizeable Chinese, Indian, Japanese, Filipino, and Korean communities.
- Note: Statistics Canada defines visible minorities as defined in the Employment Equity Act which defines visible minorities as 'persons, other than Aboriginal peoples, who are non-Caucasian in race or non-white in colour.'
British Columbia 2006 Population % of Group % of Total Population Visible minority group
Source: [1]South Asian 262,290 26.0 6.4 Chinese 407,225 40.4 10.0 Black 28,315 2.8 0.7 Filipino 88,080 8.8 2.2 Latin America 28,960 2.9 0.7 Southeast Asian 40,690 4.0 1.0 Others 153,295 15.2 3.8 Total Visible Minorities 1,008,855 100 24.8 Some Arabs, Latin Americans and other groups may be able to pass for white. All categories may include people of part-Caucasian origin.
Aboriginal peoples
British Columbia 2006 Population % of Group % of Total Population Aboriginal Group
Source: [2]North American Indian 129,580 66.1 3.2 Metis 59,445 30.3 1.5 Inuit 795 0.4 0.0 Total Aboriginal Identity Population 196,075 100 4.8 Religions
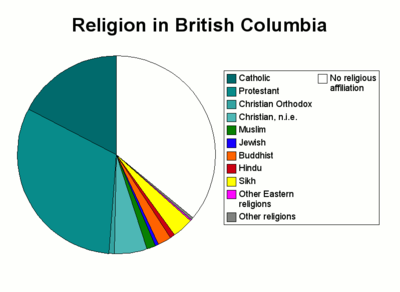 Religion in British Columbia in 2001.
Population by religion, Canada and BC
(2001 Census)Canada B.C. number % number % Total population 29,639,035 3,868,875 No religious affiliation 4,900,090 17% 1,388,300 36% Protestant 8,654,850 29% 1,213,295 31% Catholic 12,936,905 44% 675,320 17% Christian not included elsewhere 780,450 3% 200,345 5% Sikh 278,410 1% 135,310 3% Buddhist 300,345 1% 85,540 2% Muslim 579,640 2% 56,220 1% Christian Orthodox 479,620 2% 35,655 1% Hindu 297,200 1% 31,500 1% Jewish 329,995 1% 21,230 1% Eastern religions 37,550 0% 9,970 0% Other religions 63,975 0% 16,205 0% Source: Statistics Canada 2001 Census
http://www40.statcan.ca/l01/cst01/demo30c.htmLanguages
Language(s) first learned and still understood Total % Male Female English Only 2,825,780 73.03% 1,403,230 1,422,545 French Only 54,405 1.41% 27,340 27,060 Both English and French 6,784 0.18% 3,360 3,452 Other Languages 981,910 25.38% 470,145 511,765 Source: Statistics Canada 2001 Census Literacy
See also
- Demographics of Canada
- List of Canadian provinces and territories by population
- Demographics of Vancouver
- Demographics of Abbotsford, British Columbia
References
- ^ BC's birth rate, teen births lowest in Pacific Northwest — Sightline Institute
- ^ 25_imr.FH10
- ^ http://www.bcstats.gov.bc.ca/DATA/pop/vital/exp0_bc.csv
- ^ Northwest's birth rate, teen births hit record lows — Sightline Institute
- ^ Statistics Canada - Population
- ^ http://www.bcstats.gov.bc.ca/data/pop/pop/dynamic/PopulationStatistics/Query.asp?category=Health&type=HA&topic=Estimates&agegrouptype=Standard&subtype=®ion=0&year=2005&agegroup=5-year&gender=a&rowsperpage=50000&output=file
- ^ Population by selected ethnic origins, by province and territory (2006 Census) (British Columbia)
- ^ 2001 Canadian Census
 Demographics of Canada (by province or territory)
- Alberta
- British Columbia
- Manitoba
- New Brunswick
- Newfoundland and Labrador
- Nova Scotia
- Ontario
- Prince Edward Island
- Quebec
- Saskatchewan
- Northwest Territories
- Nunavut
- Yukon
Categories:- Demographics of Canada
- British Columbia society


Wikimedia Foundation. 2010.