- Demographics of Ontario
-
Estimated population of Ontario : 13,069,200 (2009 est)
Percentage of National Population : 38.7%
Population growth rate per year: 1.0%
Source: Statistics Canada[1]
Contents
Vital statistics
Birth Rate: 10.8/1,000 people [2]
Death Rate: 7.1/1,000 people [3]
Life Expectancy at birth: 81 years (2006 est) [4]
Infant Mortality rate: 5.2 (2007 est) [5]
Source: Statistics Canada
Urban and rural population of Ontario since 1851
Year Population Urban Population Rural Population %
Urban%
Rural1851 952,004 133,463 818,541 14 86 1861 1,396,091 258,192 1,137,899 18 82 1871 1,620,851 355,997 1,264,854 22 78 1881 1,926,922 575,848 1,351,074 30 70 1891 2,114,321 818,998 1,295,323 39 61 1901 2,182,947 935,978 1,246,969 43 57 1911 2,527,292 1,328,489 1,198,803 53 47 1921 2,933,662 1,706,632 1,227,030 58 42 1931 3,431,683 2,095,992 1,335,691 61 39 1941 3,787,655 2,338,633 1,449,022 62 38 1951 4,597,542 3,251,099 1,346,443 71 29 1956 5,404,933 4,102,919 1,302,014 76 24 1961 6,236,092 4,823,529 1,412,563 77 23 1966 6,960,870 5,593,440 1,367,430 80 20 1971 7,703,105 6,343,630 1,359,480 82 18 1976 8,264,465 6,708,520 1,555,945 81 19 1981 8,625,107 7,047,032 1,578,075 82 18 1986 9,101,695 7,469,420 1,632,275 82 18 1991 10,084,885 8,253,842 1,831,043 82 18 1996 10,753,573 8,958,741 1,794,832 83 17 2001 11,410,046 9,662,547 1,747,499 85 15 2006 12,160,282 10,351,135 1,809,147 85 15 Source: Statistics Canada [6]
Age structure
Age Groups Total Male Female 0–4 years 671,250 343,340 327,910 5–9 years 772,650 396,385 376,265 10–14 years 788,845 404,970 383,880 15–24 years 1,487,835 754,565 733,270 25–34 years 1,558,495 760,695 797,800 35–44 years 1,959,520 963,840 995,680 45–54 years 1,635,280 801,540 833,735 55–64 years 1,064,000 520,570 543,430 65–74 years 818,170 383,625 434,540 75–84 years 503,930 202,270 301,665 85 years and over 150,075 45,260 104,810 Total 11,410,045 5,577,055 5,832,990 Source : Statistics Canada [7]
Visible Minorities and Aboriginals
Ontario 2006 Population % of Group % of Total Population Visible minority group
Source: [2]South Asian 794,170 28.9 6.6 Chinese 576,980 21.0 4.8 Black 473,765 17.3 3.9 Filipino 203,220 7.4 1.7 Latin American 147,135 5.4 1.2 Southeast Asian 110,045 4.0 0.9 Others 439,890 16.0 3.7 Total Visible Minorities 2,745,205 100 22.8 Aboriginal Group
Source: [3]North American Indian 158,395 65.3 1.3 Metis 73,605 30.4 0.6 Inuit 2,035 0.8 0 Total Aboriginal Identity Population 242,495 100 2.0 Not A Visible Minority or Aboriginal 9,041,195 75.2 Total population 12,028,895 100 Ethnic groups
Ethnic Responses % Total population 12,028,895 100 English 2,971,360 24.7 Canadian 2,768,870 23.0 Scottish 2,101,100 17.5 Irish 1,988,940 16.5 French 1,351,600 11.2 German 1,144,560 9.5 Italian 867,980 7.2 Chinese 644,465 5.4 East Indian 573,250 4.8 Dutch (Netherlands) 490,995 4.1 Polish 465,560 3.9 Ukrainian 336,355 2.8 North American Indian 317,890 2.6 Portuguese 282,870 2.4 Filipino 215,750 1.8 British, not included
elsewhere205,755 1.7 Jamaican 197,540 1.6 Welsh 182,825 1.5 Jewish 177,255 1.5 Russian 167,365 1.4 Hungarian (Magyar) 151,750 1.3 Spanish 149,160 1.2 Greek 132,440 1.1 American (USA) 113,050 0.9 Pakistani 91,160 0.8 Métis 87,090 0.7 Sri Lankan 85,935 0.7 Vietnamese 83,330 0.7 Romanian 80,710 0.7 African, not included elsewhere 75,500 0.6 Finnish 72,990 0.6 Korean 72,065 0.6 Croatian 71,380 0.6 Iranian 70,590 0.6 Note: The graph takes dual responses (for example if someone is French-Canadian he/she would be added to both French and Canadian) thus the graph does not add up to 100%. Some places of ones ethnic origin do refer to a single specified country of origin, i.e. Spanish refers to people from Spanish speaking countries such as Colombia, Argentina, Cuba and others; or East Indian where the respondents origin could be from Pakistan, India, Nepal, Bangladesh, etc.; and the list contains about 200 nationalities known to reside in the province. However, there are options for the respondent to identify the country alone.
Ontario is a very diverse province. For example, 42.8% of the population of Toronto was born outside Canada[8], which is the second-largest percentage of immigrants in a single city on Earth, after Miami. Hamilton is ranked the third-most diverse urbanized area in Canada (after Toronto and Vancouver).[citation needed]
Religious groups
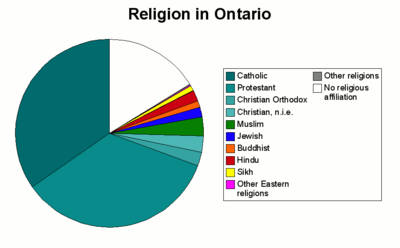 Religion in Ontario in 2001.[1]
Canadian Christian bodies Religion People % Total 11,285,535 100 Protestant 3,935,745 34.9 Catholic 3,911,760 34.7 No Religion 1,841,290 16.3 Muslim 352,530 3.1 Other Christians 301,935 2.7 Christian Orthodox 264,055 2.3 Hindu 217,555 1.9 Jewish 190,795 1.7 Buddhist 128,320 1.1 Sikh 104,785 0.9 Eastern Religions 17,780 0.2 Other Religions 18,985 0.2 Source: Statistics Canada [9]
City Metropolitan Areas
City 2006 postcensal estimate 2001 Census Population Toronto 5,406,300 4,883,800 Ottawa-Gatineau 1,158,300 1,102,900 Hamilton 716,200 689,200 London 465,700 449,600 Kitchener-Waterloo 463,600 431,300 St. Catharines-Niagara 396,800 391,700 Oshawa 344,400 308,500 Windsor 332,100 320,800 Greater Sudbury 162,000 155,601 Kingston 155,000 146,838 Thunder Bay 125,400 126,600 Source: Statistics Canada [10]
See also
Demographics of Canada's provinces and territories. Click on the Province Hyperlink to see the Demographics of that province. References
- ^ Population information of Canada and its provinces and territories
- ^ Birth rates of Canada and its provinces and territories
- ^ Death rates of Canada and its provinces and territories
- ^ Life expectancy of Canada and its provinces
- ^ Infant mortality information of Canada and its provinces and territories
- ^ Rural and Urban population changes since 1851 for Ontario
- ^ Statistics profile for Ontario
- ^ Visible minorities of Toronto.
- ^ Religious diversity information for Ontario
- ^ Information on population for Canada's biggest CMAs note that it can be inaccurate]
 Demographics of Canada (by province or territory)
- Alberta
- British Columbia
- Manitoba
- New Brunswick
- Newfoundland and Labrador
- Nova Scotia
- Ontario
- Prince Edward Island
- Quebec
- Saskatchewan
- Northwest Territories
- Nunavut
- Yukon
Categories:- Demographics of Canada
- Ontario society

Wikimedia Foundation. 2010.