- Demographics of Vancouver
-
The Demographics of Vancouver concern population growth and structure for Vancouver, British Columbia, Canada. Figures given here are for the Greater Vancouver Regional District, however, not for the City of Vancouver proper.
Contents
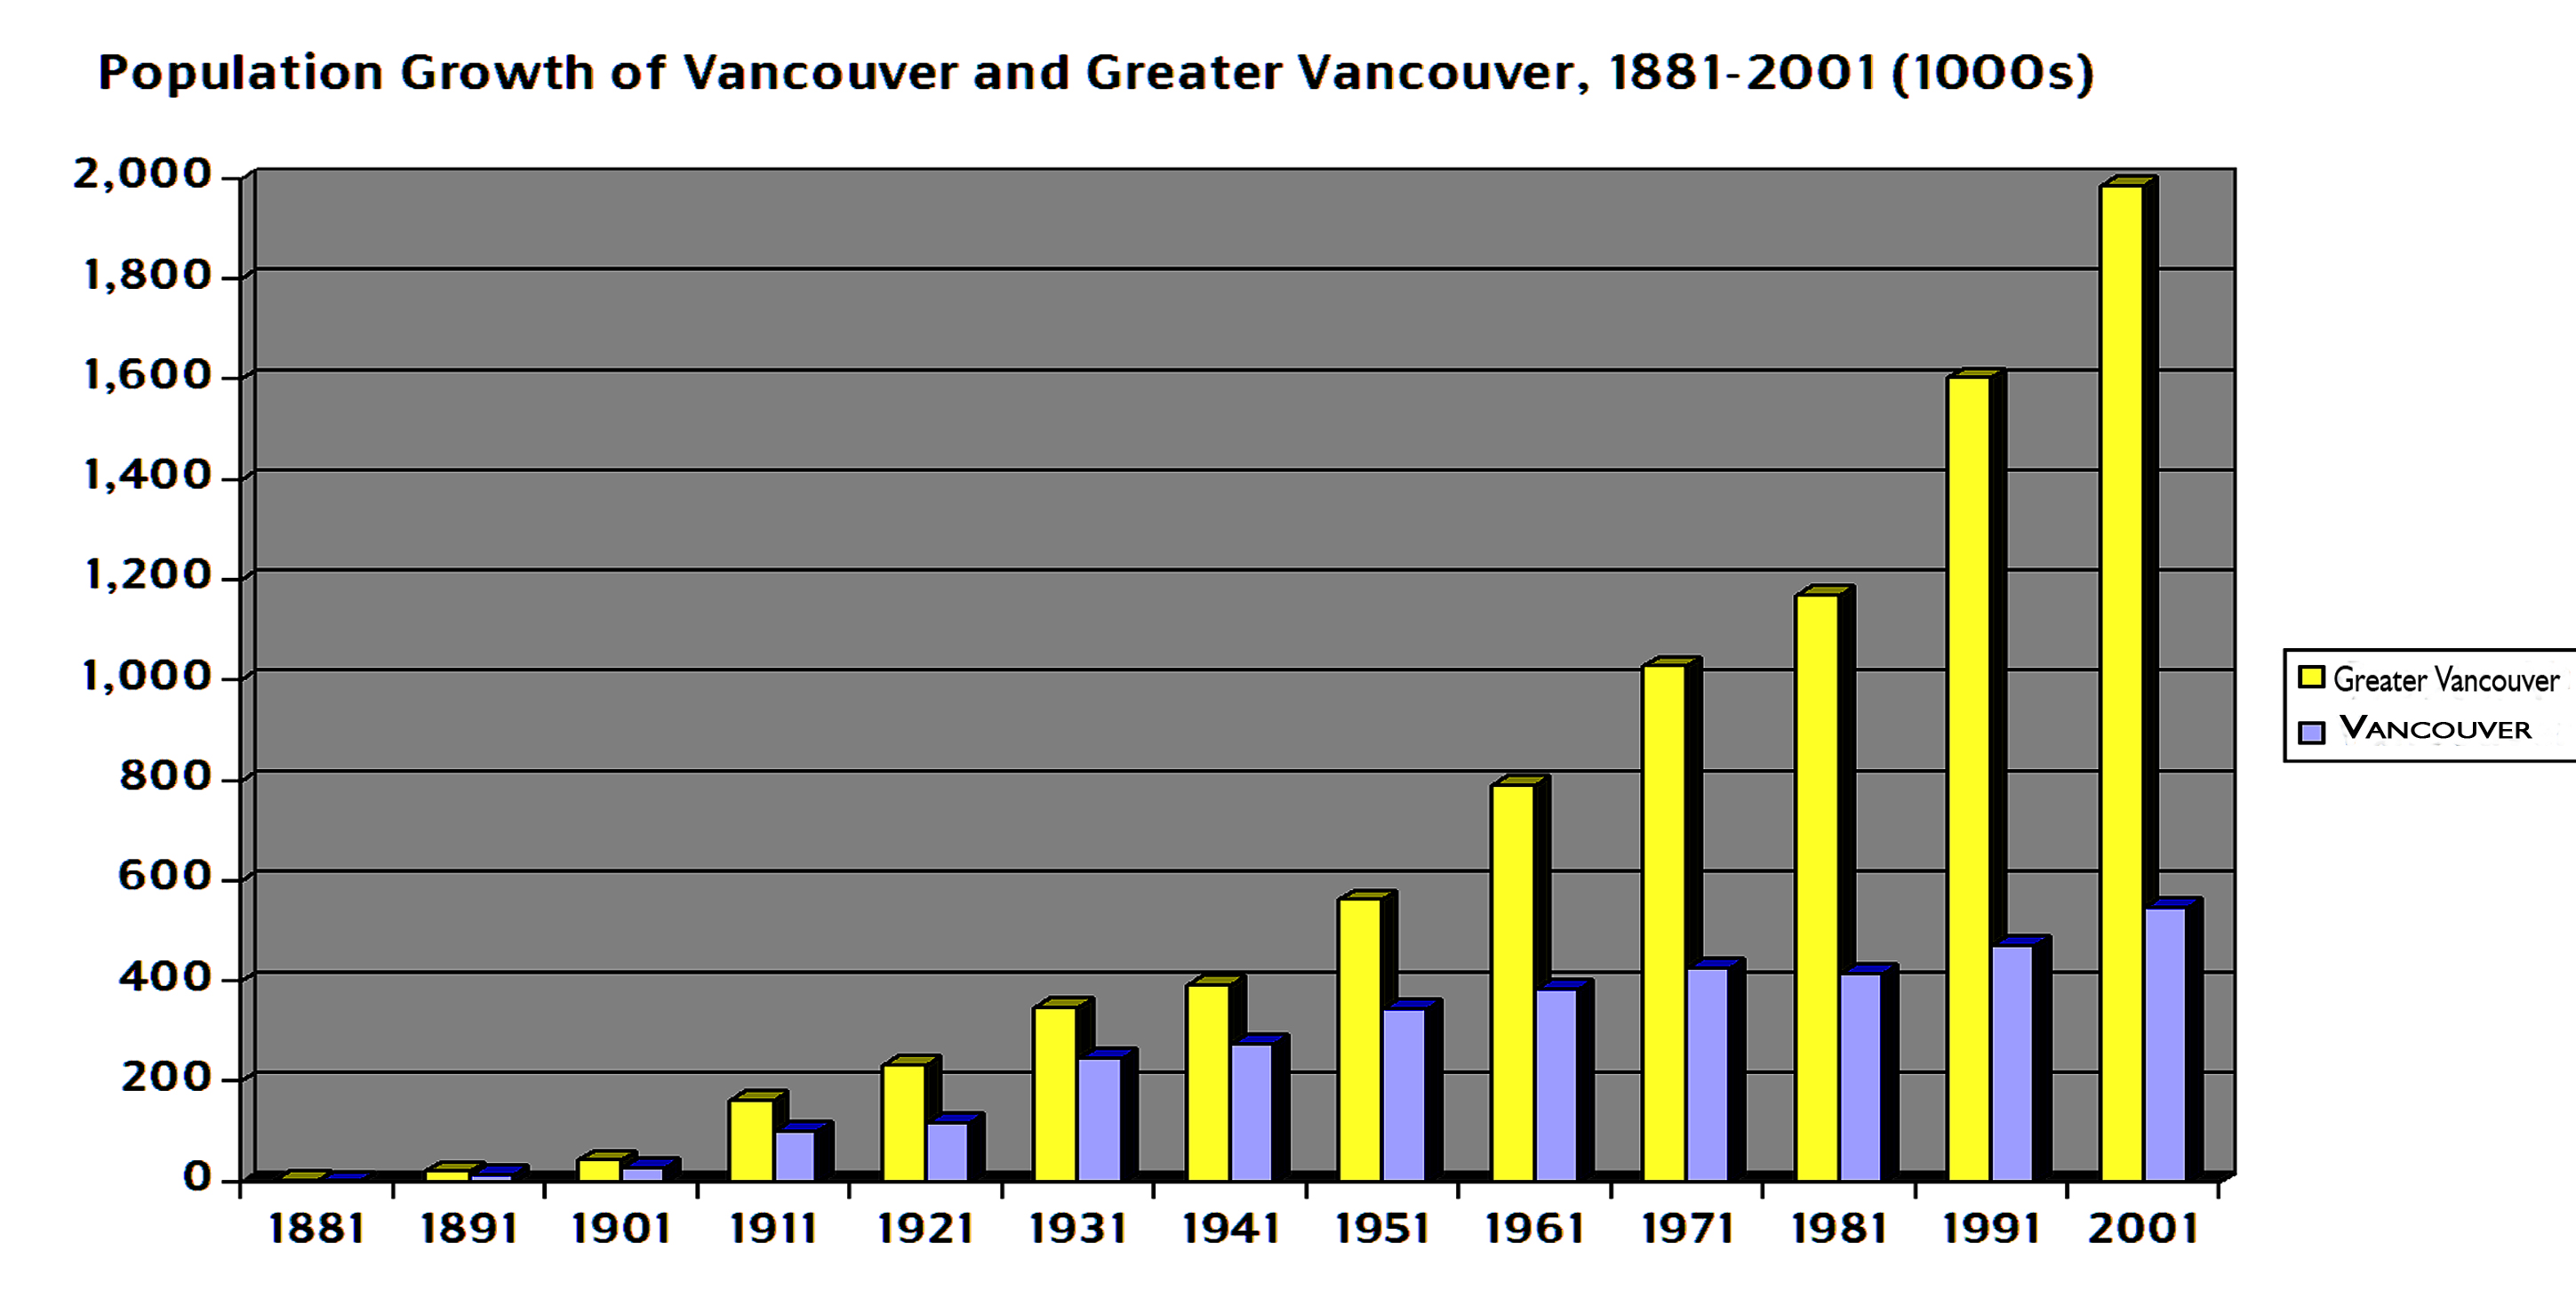
Population growth
The following table shows the development of the number of inhabitants according to census data of Statistics Canada. The former municipalities of Point Grey and South Vancouver are not included in the data prior to 1931.[1] NB Vancouver did not exist as such at the time of the 1881 and 1871 censuses.
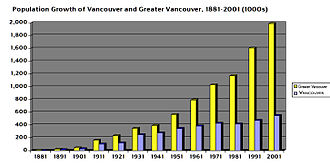 Population growth.[2]
Year Inhabitants 1891 13,709 1901 26,133 1911 100,401 1921 117,217 1931 246,593 1941 275,353 1951 344,833 1956 365,844 1961 384,522 Year Inhabitants 1966 410,375 1971 426,256 1976 410,188 1981 414,281 1986 431,147 1991 471,644 1996 514,008 2001 545,671 2006 578,041 Ethnic origin
The demographics of Vancouver reveal a multi-ethnic society. There remains a small population, less than 2%, of Aboriginal peoples, who according to archeological and historical records, have inhabited this region for more than 3,000 years.[citation needed]
From the time of Vancouver's first non-indigenous settlement in the second half of the 19th century, people from Britain and Ireland were the largest group of immigrants and, collectively, remain the largest ethnic grouping in Vancouver to this day. Chinese are by far, the largest visible minority group, although ethnic Germans are the largest non-British group and, as census records show, only in the 21st Century were outnumbered by the Chinese for the first time. The city has one of the most diverse Chinese-speaking communities with several dialects of Chinese being represented. Vancouver contains the second-largest Chinatown in North America (after San Francisco's), and many multicultural neighbourhoods such as the Punjabi Market, Greektown, and Japantown. Commercial Drive, the core of the historic Little Italy, which is also the main Portuguese area, has become an alternative-culture focus, though traditional Italian and Portuguese and other establishments and residents remain in the area. Bilingual street signs can be seen in Chinatown and the Punjabi Market, and commercial signs in a wide array of languages can be seen all over the metropolitan area.
Aboriginal peoples
There is a small community of aboriginal people in Vancouver as well as in the surrounding metropolitan region, with the result that Vancouver constitutes the largest native community in the province, albeit an unincorporated one (i.e. not as a band government).[citation needed] There is an equally large or larger Métis contingent, with this being a mix of traditional "real" Metis from the Prairies and others whose mixed native/non-native ancestry qualifies them legally as Metis.[citation needed]
British and European origins
Much of the white population consists of persons whose origins go back to the British Isles and, until recently, British Columbians with British and Irish ancestry most likely came directly from the Britain and Ireland, rather than via Ontario or the Maritime Provinces. Until the 1960s, it was easier to purchase the Times of London and The Guardian in Vancouver than it was to find the Toronto Globe and Mail or Montreal Gazette. Other large and historically important European ethnic groups consist of Germans, Dutch, French (of both European and Canadian origin), Ukrainians, Norwegians, Swedes, Danes, Finns, Italians, Croats, Hungarians, Greeks, and lately numerous Romanians, Russians, Portuguese, Serbs and Poles. Non-visible minorities such as newly arrived Eastern Europeans and the new wave of Latin Americans are also a feature of the city's ethnic landscape. Prior to the Hong Kong influx of the 1980s, the largest non-British Isles ethnic group in the city was German, followed by Ukrainian and the Scandinavian ethnicities. Most of these earlier immigrant groups are fully assimilated or intermarried with other groups, although a new generation of East Europeans form a distinct linguistic and social community.
Chinese origins
Main article: History of Chinese immigration to CanadaThe first Chinese immigrants to British Columbia were men who came to "the Colonies of T'ang (China)," as they called British Columbia, for the Fraser Canyon Gold Rush of 1858 and a decade later to work on building the Canadian Pacific Railway. Because of various loopholes in the Head Tax and other anti-Chinese legislation, there was a steady influx of Chinese families from the late 19th century until the Second World War. Then in the 1980s, a huge influx immigrants from Hong Kong came to Vancouver in anticipation of and during the transfer of sovereignty of that former British colony from the United Kingdom to China. This continued a tradition of immigration from around the world that had already established Vancouver as the second most multi-ethnic of Canada's cities (after Toronto) before the Hong Kong influx began.
Statistics Canada data shows that over 17% of the approximately 2.5 million people living in the metropolitan area are ethnic Chinese. Vancouver has one of the most diverse Chinese-speaking communities (from several regions of China, Hong Kong, Taiwan, Hainan, Malaysia/Singapore, etc.) made available to consumers in Vancouver and adjacent communities such as Richmond and Burnaby. The ethnic Chinese from Hong Kong who speak Cantonese make up the largest group within Vancouver's Chinese-speaking community. However, before the influx of Hong Kong immigrants, many earlier Chinese spoke Taishanese (台山話). The majority of these early Chinese immigrants came from the southern coastal province of Guangdong. [3] In addition, the Chinese-speaking community has largely evolved and has residents who speak Mandarin, Hakka, Shanghainese, Taiwanese, and Teochiu who have arrived in Vancouver via Hong Kong, Taiwan, or Southeast Asia. There are also many Chinese immigrants from Hong Kong whose origin is from other areas of China such as Shanghai. Immigration from Taiwan increased as of the late 1980s and early 1990s, and continues at a steady pace. Many Taiwanese are currently choosing to retire in Vancouver or raise their families in the city.[citation needed] The most recent Chinese immigrants to Vancouver are also those who come directly from Mainland China. Vancouver continues to receive immigration not only from Mainland China but also from Taiwan and Hong Kong, though to a lesser extent than in the 1990s. South (in particular Indo-Canadians) are one of Vancouver's largest Asian minorities; as of current statistics, Vancouver has Canada's second largest Indo-Canadian population after Toronto.
Other Asian ethnicities
Other significant Asian ethnic groups in Vancouver are Korean, Vietnamese, Filipino, Cambodian, Japanese, and Russians from the Russian Far East and Siberia. In Vancouver the term 'Asian' is normally used to refer only to East Asian peoples, while South Asians from the northern Indian subcontinent (mostly Punjabis) are usually referred to as Indo-Canadian or East Indians. Technically, though, the term 'Asian' may refer to either group, and also to the large Persian and other Middle Eastern populations as well as elements from Central Asia.
Tables of ethnicities (for census metropolitan area)
Ethnic Origin by Regional Group[4][dead link] Population Percent of 2,097,960* British Isles origins 753,215 35.90% French origins 138,145 6.58% Aboriginal origins 59,110 2.82% Other North American origins (Canadian and American) 296,895 14.15% Caribbean origins 11,830 0.56% Latin, Central and South American origins 28,575 1.36% Western European origins (Germany, Austria, Benelux, Switzerland) 289,030 13.78% Northern European origins (Norwegian, Swedish, Danish, Icelander, Finnish) 123,620 5.89% Eastern European origins (Polish, Ukrainian) 219,325 10.45% Southern European origins (Italian, Sicilian, Portuguese, Spaniards) 172,425 8.22% Other European origins (Basque, Romany, Jewish, misc. Slav) 26,485 1.26% African origins 22,610 1.08% Arab origins 14,170 0.68% West Asian origins 40,145 1.91% South Asian origins 208,535 9.94% East and Southeast Asian origins 584,895 27.88% Oceania origins 18,125 0.86% *Percentages total more than 100% due to multiple responses, e.g. German-East Indian, Norwegian-Irish-Polish Ethnic Origin[4] Population Percent of 2,097,960 Cornish 225 0.01% English 484,340 23.09% Irish 251,695 12.00% Manx 640 0.03% Scottish 337,230 16.07% Welsh 41,805 1.99% British Isles, n.i.e.** 35,505 1.69% Acadians 1,280 0.06% French 137,270 6.54% Inuit 580 0.03% Métis 17,110 0.82% North American Indian 43,190 2.06% American 27,000 1.29% Canadian 278,350 13.27% Newfoundlander 390 0.02% Nova Scotian 120 0.01% Ontarian 20 less than 0.01% Québécois 350 0.02% Other North American provincial or regional groups 150 0.01% Antiguan 105 0.01% Bahamian 50 less than 0.01% Barbadian 925 0.04% Bermudan 100 less than 0.01% Carib 85 less than 0.01% Cuban 540 0.03% Dominican, n.o.s.*** 195 0.01% Grenadian 175 0.01% Guyanese 825 0.04% Haitian 405 0.02% Jamaican 4,645 0.22% Kittitian/Nevisian 15 less than 0.01% Martinican 10 less than 0.01% Montserratan 10 less than 0.01% Puerto Rican 260 0.01% St. Lucian 80 less than 0.01% Trinidadian/Tobagonian 2,185 0.10% Vincentian/Grenadinian 120 0.01% West Indian 1,245 0.06% Caribbean, n.i.e.** 620 0.03% Aboriginal from Central/South America 830 0.04% Argentines 790 0.04% Belizean 60 less than 0.01% Bolivian 90 less than 0.01% Brazilian 1,115 0.05% Chilean 2,935 0.14% Colombian 2,125 0.10% Costa Rican 355 0.02% Ecuadorian 225 0.01% Guatemalan 1,405 0.07% Hispanic 555 0.03% Honduran 745 0.04% Maya 575 0.03% Mexican 7,680 0.37% Nicaragua 860 0.04% Panamanian 145 0.01% Paraguayan 170 0.01% Peruvian 1,910 0.09% Salvadoran 5,760 0.27% Uruguayan 60 less than 0.01% Venezuelan 535 0.03% Latin, Central or South American, n.i.e.** 1,225 0.06% Austrian 21,500 1.02% Belgian 6,555 0.31% Dutch (Netherlands) 71,710 3.42% Flemish 815 0.04% Frisian 155 0.01% German 203,715 9.71% Luxembourger 235 0.01% Swiss 10,130 0.48% Finnish 12,745 0.61% Danish 22,800 1.09% Icelandic 9,630 0.46% Norwegian 46,260 2.20% Swedish 39,920 1.90% Scandinavian, n.i.e.** 3,830 0.18% Estonian 2,590 0.12% Latvian 2,160 0.10% Lithuanian 3,100 0.15% Byelorussian 820 0.04% Czech 10,385 0.50% Czechoslovakian 2,810 0.13% Slovak 5,700 0.27% Hungarian (Magyar) 23,365 1.11% Polish 60,715 2.89% Romanian 14,055 0.67% Russian 47,935 2.28% Ukrainian 81,725 3.90% Albanian 650 0.03% Bosnian 2,535 0.12% Bulgaria 1,960 0.09% Croatian 12,475 0.59% Cypriot 270 0.01% Greek 15,025 0.72% Italian 76,345 3.64% Kosovar 85 less than 0.01% Macedonian 600 0.03% Maltese 990 0.05% Montenegrin 370 0.02% Portuguese 20,335 0.97% Serbian 7,690 0.37% Sicilian 180 0.01% Slovenian 2,475 0.12% Spanish 36,000 1.72% Yugoslavs 5,525 0.26% Basque 405 0.02% Gypsy (Roma) 250 0.01% Jewish 21,465 1.02% misc. Slav (European) 760 0.04% European, n.i.e.** 3,975 0.19% Afrikaner 290 0.01% Akan 25 less than 0.01% Amhara 65 less than 0.01% Angolan 70 less than 0.01% Ashanti 65 less than 0.01% Bantu 170 0.01% Black 3,005 0.14% Burundian 90 less than 0.01% Congolese (Zairian) people 75 less than 0.01% Congolese, n.o.s.*** 85 less than 0.01% Dinka 25 less than 0.01% East African people 610 0.03% Eritrean 335 0.02% Ethiopian 1,625 0.08% Gabonese 10 less than 0.01% Gambian 15 less than 0.01% Ghanaian 1,100 less than 0.01% Guinean, n.o.s.*** 95 less than 0.01% Ibo 15 less than 0.01% Ivoirian 15 less than 0.01% Kenyan 765 0.04% Malagasay 35 less than 0.01% Mauritian 325 0.02% Nigerian 880 0.04% Oromo 145 0.01% Rwandan 225 0.01% Senegalese 20 less than 0.01% Seychellois 20 less than 0.01% Sierra Leonean 115 0.01% Somali 1,320 0.06% South African 4,120 0.20% Sudanese 705 less than 0.01% Tanzanian 135 0.01% Tigrian 50 less than 0.01% Togolese 15 less than 0.01% Ugandan 360 0.02% Yoruba 80 less than 0.01% Zambian 40 less than 0.01% Zimbabwean 230 0.01% Zulu 70 less than 0.01% African, n.i.e.** 6,490 0.31% Egyptian 2,120 0.10% Iraqi 1,805 0.09% Jordanian 300 0.01% Kuwaiti 75 less than 0.01% Lebanese 6,175 0.29% Libyan 25 less than 0.01% Algerian 390 0.02% Berber 150 0.01% Moroccan 635 0.03% Tunisian 70 less than 0.01% Maghrebi origins, n.i.e.** 160 0.01% Palestinian 1,050 0.05% Saudi Arabian 255 0.01% Syrian 925 0.04% Yemeni 75 less than 0.01% Arab, n.i.e.** 3,075 0.15% Afghan 4,620 0.22% Armenian 1,910 0.09% Assyrian 355 0.02% Azeribaijani 405 0.02% Georgian 240 0.01% Iranian 27,155 1.29% Israeli 765 0.04% Kurd 1,145 0.05% Pashtun 170 0.01% Tatar 235 0.01% Turk 3,380 0.16% West Asian, n.i.e.** 1,350 0.06% Bangladeshi 785 0.04% Bengali 415 0.02% East Indian 181,895 8.67% Goan 280 0.01% Gujurati 515 0.02% Kashmiri 70 less than 0.01% Nepali 460 0.02% Pakistani 6,875 0.33% Punjabi 13,735 0.65% Sinhalese 415 0.02% Sri Lankan 3,740 0.18% Tamil 740 0.04% South Asian, n.i.e.** 6,495 0.31% Burmese 865 0.04% Cambodian 1,525 0.07% Chinese 402,000 19.16% Filipino 83,760 3.99% Hmong 75 less than 0.01% Indonesian 3,140 0.15% Japanese 30,230 1.44% Khmer 135 0.01% Korean 46,040 2.19% Laotian 1,065 0.05% Malaysian 3,365 0.16% Mongolian 680 0.03% Singaporean 515 0.02% Taiwanese 9,810 0.47% Thai 1,565 0.07% Tibetan 100 0.00% Vietnamese 26,115 1.24% East or Southeast Asian, n.i.e.** 1,170 0.06% Asian, n.o.s.*** 80 less than 0.01% Australian 5,525 0.26% New Zealander 2,390 0.11% Fijian 8,920 0.43% Hawaiian 660 0.03% Maori 375 0.02% Polynesia 265 0.01% Samoan 160 0.01% Pacific Islander, n.i.e.** 210 0.01% *Percentages total more than 100% due to multiple responses, e.g. German-East Indian, Norwegian-Irish-Polish **'not included elsewhere.' ***'not otherwise specified.' Visible minorities
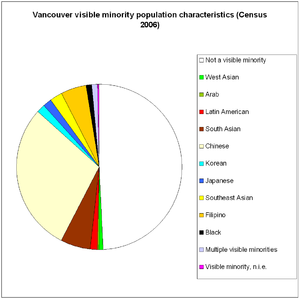 Pie chart showing Vancouver's visible minority composition (data from Canada Census 2006).
Vancouver has more interracial couples and less residential segregation than Canada's two largest cities, Toronto and Montreal. In total, 7.2% of married and common-law couples in Greater Vancouver are interracial; double the Canadian average of 3.2%, and higher than in Toronto (6.1%) and Montreal (3.5%).
In the city of Vancouver, 47.1% of the population are members of visible minority groups.[5]
Aboriginal peoples, who make up less than two percent of the city's population, are not officially considered a visible minority group by Statistics Canada.
Religion
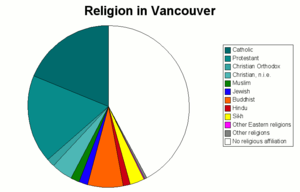 Religion in Vancouver in 2001.
Vancouver, like the rest of British Columbia, has a low rate of church attendance compared with the rest of the continent and the majority of the population does not practice religion.[6][7] It has a significant Buddhist population, mostly adherents from China.[citation needed]
-
Vancouver religious profile from 2001 Census[5] 42.2% no religious affiliation, including agnostic, atheist, Humanist, Darwinism, and "no religion" 19.0% Catholic 17.4% Protestant 6.9% Buddhist 4.4% other Christian, not identified elsewhere 2.8% Sikh 1.8% Jewish 1.7% Muslim 1.7% Christian Orthodox 1.4% Hindu 0.5% other religions, including Aboriginal spirituality, Pagan, Wicca, Unity, New Thought,
Pantheist, Scientology, Rastafarian, New Age, Gnostic, Satanist0.3% Bahá'í, Eckankar, Jains, Shinto, Taoist, Zoroastrian and Eastern religions not identified elsewhere
References
- ^ "Vancouver Public Library" (PDF). http://www.vpl.ca/branches/LibrarySquare/soc/pdfs/QF_Population_BC_Vancouver.pdf. Retrieved 2007-02-06.
- ^ Data taken from: "British Columbia Regional District and Municipal Census Populations" (PDF). BC Stats. http://www.bcstats.gov.bc.ca/data/dd/handout/hist_cen.pdf.; "British Columbia Municipal and Regional District 1996 Census Results". BC Stats. http://www.bcstats.gov.bc.ca/data/cen96/mun_rd.asp.;"British Columbia Municipal and Regional District 2001 Census Results". BC Stats. http://www.bcstats.gov.bc.ca/data/cen01/mun_rd.asp.;Davis, Chuck (1997). The Greater Vancouver Book: An Urban Encyclopedia. Surrey, BC: Linkman Press. p. 780. ISBN 978-1896846002.
- ^ Chinese Genealogy
- ^ a b Profile of Ethnic Origin and Visible Minorities for Census Metropolitan Areas and Census Agglomerations, 2006 Census
- ^ a b 2001 Vancouver Community Profile from 2001 Census at Statistics Canada
- ^ Clark, Warren. "Patterns of Religious Attendance".
- ^ Babych, Art. "Attendance Drops in Church". Western Catholic Reporter.
 Demographics of Canada
Topics By province By city Census in Canada Aboriginal peoples Lists Categories: -


Wikimedia Foundation. 2010.