- Demography of the United Kingdom
-
This article is about the demographic features of the population of the United Kingdom, including population density, ethnicity, education level, health of the populace, economic status, religious affiliations and other aspects of the population.
According to the 2001 census, the total population of the United Kingdom was 58,789,194—the third-largest in the European Union (behind Germany and metropolitan France) and the 21st-largest in the world. Its overall population density is one of the highest in the world, due to the particularly high population density in England. Almost one-third of the population lives in England's southeast and is predominantly urban and suburban, with about 8.2 million in the capital city of London. The United Kingdom's extremely high literacy rate (99%) is attributable to universal public education introduced for the primary level in 1870 (Scotland 1872, free 1890[1]) and secondary level in 1900. Parents are obliged to have their children educated from the ages of 5 to 16 (with legislation passed to raise this to 18), and can continue education free of charge in the form of A-Levels, vocational training or apprenticeship to age 18. About 40% of British students go on to post-secondary education (18+). The Church of England and the Church of Scotland function as the national churches in their respective countries, but all the major religions found in the world are represented in the United Kingdom.
The UK's population is predominantly White British. Being located close to continental Europe, the countries that formed the United Kingdom were subject to many invasions and migrations, especially from Scandinavia and the continent, including Roman occupation for several centuries. Historically, British people were thought to be descended mainly from the different ethnic stocks that settled there before the 11th century; pre-Celtic, Celtic, Anglo-Saxon, Viking and Norman. The geneticist Stephen Oppenheimer carried out an extensive research of the British Isles, finding that the Celtic and Anglo-Saxon influx had little effect, with the majority of British ethnicity tracing back from an ancient Palaeolithic Iberian migration, now represented by the Basques so that 75% of the modern British population could (in theory) trace their ancestry back 15,000 years.[2][3] Although Celtic languages are partially spoken in Scotland, Cornwall, and Northern Ireland, the predominant language overall is English. In North and West Wales, Welsh is widely spoken as a first language, but much less so in the more English dominated South East of the country.
Contents
History
Three sets of demographic statistics are useful to governments and others concerned with their nations’ political and economic stability. The first is an enumeration of the number of inhabitants distinguished by age, sex, and occupation. The second involves a continuous record of population trends from the registration of births, marriages, and burials. The third is documentation of the extent of internal and external migration.
England and Wales
Before 1800, England had none of these except for the civil registration of births, marriages, and burials briefly attempted under the Commonwealth (1653–1660) and an even more short-lived initiative of the same kind in 1694 in connection with the attempt to raise a tax on the occasion of every birth, marriage, and death—paupers excepted. At that time, the chief source of information on the demography was provided by parish registration of baptisms, marriages, and burials that had occurred in the parish churches, supplemented by information on mortality in the Bills of Mortality that were published for certain large towns and by inferences drawn from various counts of taxpayers. The article focuses on the reliability of the parochial registration system and the way in which it was exploited by the state as measured against the state’s objectives for establishing it in 1538. These objectives were rarely achieved. By the end of the 18th century, the parish registers were falling short of providing a national system of registration. Neither had the registers at any time provided the requisite detail to allow the verification of age, lineal descent, or right of inheritance. They had not been used as a way of raising revenue except briefly between 1694 and 1705. Moreover, the Anglican Church was extremely lax about the enforcement of its own regulations regarding the appropriate time for registering baptisms, burials, and marriages.
The ability of the registration system to fulfil these original objectives can be measured in terms of the breadth of its coverage and the quality of the information provided. Each category can be further subdivided. For example, the breadth of coverage can be defined to include the speed with which parishes throughout the country commenced the registration of baptisms, marriages, and burials; the percentage of the population whose vital events went unrecorded even in the parishes that established registers; and the success of the incumbents and churchwardens in preserving the registers completed by their predecessors. The quality of the recording can be assessed based on the amount of information offered about individuals mentioned in the registers, the extent to which that information was provided in a standard form across the country, and the clarity of the presentation (whether separate registers for baptisms, marriages, and burials were maintained). The accuracy of the work undertaken by the parochial clergy as unpaid servants of the state in providing Rickman with the totals of baptisms, marriages, and burials can also be assessed. Each of these aspects will now be considered in turn before an assessment of the overall effectiveness of the registration system is attempted. Cromwell’s brief instructions establishing the registration system did not specify what sort of register book was to be provided. Not unnaturally, most parishes chose to use paper rather than the dearer, but more durable, parchment. In 1597, the Convocation of the clergy, bishops, and archbishop of the province of Canterbury found it necessary to order parchment copies of all entries from old paper registers, instructions that were soon reissued in 1603.
The first census held throughout the UK was organised in 1801. England and Wales started the civil registration of births, marriages, and deaths in 1837. The first attempt by the state to compile statistics on migration was included in the census of 1841.
United Kingdom
During the Industrial Revolution, the life expectancy of children increased dramatically. The proportion of the children born in London who died before the age of five decreased from 74.5 per thousand in 1730–1749 to 31.8 per thousand in 1810–1829.[4] According to Robert Hughes in The Fatal Shore, the population of England and Wales, which had remained steady at 6 million from 1700 to 1740, rose dramatically after 1740.
The first Census in 1801 revealed that the population of England, Scotland and Wales was 10.5 million.[5][6] In 1800 the population of Ireland was between 4.5 and 5.5 million.[7][8]
The 1841 UK Census counted the population of England and Wales to be 15.9 million.[9] Ireland's population was 8.2 million in 1841.[10] The population of Scotland was 2.6 million.[11]
The Great Irish Famine, which began in the 1840s, caused the deaths of one million Irish people, and caused over a million to emigrate.[12] Mass emigration became entrenched as a result of the famine and the population continued to decline until late in the 19th century.
The population of England had almost doubled from 16.8 million in 1851 to 30.5 million in 1901. Ireland’s population decreased rapidly, from 8.2 million in 1841 to less than 4.5 million in 1901.[13]
Population
The population of the United Kingdom in the 2001 census was 58,789,194. This has since risen to 60,587,300 according to mid-2006 estimates by the Office for National Statistics.[14] Current estimates (mid 2010) put the country's population at closer to 63 million.
Part Population (2010) Percentage (2010) England 51,809,700 83.8 Scotland 5,222,100 8.4 Wales 3,006,400 4.8 Northern Ireland 1,789,000 3.0 United Kingdom 61,827,200 100 (1 July 2006 population estimates by UK National Statistics[14])
There are 11 cities which exceed 300,000 inhabitants, these being London, Birmingham, Glasgow, Leeds, Sheffield, Liverpool, Manchester, Edinburgh, Bristol, Cardiff and Coventry. Cities with urban areas in excess of 300,000 inhabitants include Nottingham, Leicester, Brighton, Belfast, Southampton, Portsmouth and Newcastle Upon Tyne.
Population levels at census dates and average adjustments annually
(thousands)
United Kingdom Population
at start of periodOverall
annual changeBirths Deaths Natural change Net migration
and other changes1901 – 1911 38 237 385 1091 624 467 -82 1911 – 1921 42 082 195 975 689 286 -92 1921 – 1931 44 027 201 824 555 268 -67 1931 – 1951 46 038 213 793 603 190 22 1951 – 1961 50 225 258 839 593 246 12 1961 – 1971 52 807 312 962 638 324 -12 1971 – 1981 55 928 42 736 666 69 -27 1981 – 1991 56 357 108 757 655 103 5 1991 – 2001 57 439 161 731 631 100 61 2001 – 2008 59 113 324 722 588 134 191 Age structure
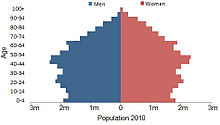
The most numerous five year age groups (at the 2001 census) were the 5-year group born in the years 1946–51 (the post–World War II baby boom); the baby boom born a generation later in 1966–71 (the largest group of all); and a more modest boom a generation after that, born in 1986–91.[16] The 1946–51 group reaches retirement age from 2006 onwards (women from 2006 and men from 2011), and the sudden increase in the number of people claiming the state pension has led politicians and political commentators to fear a "pensions crisis".
The age groups are not evenly distributed around the country, with some areas having many young adults and children[17] and some areas having large numbers of older people.[18]
Age group Population % Male Female 0–14 5,560,489 5,293,871 18.0 15–64 20,193,876 19,736,516 66.3 65+ 4,027,721 5,458,235 15.7 Fertility
In 2008 the UK's total fertility rate (TFR) was 1.96 children per woman,[19] below the replacement rate, which in the UK is 2.075.[20] In 2001, the TFR was at a record low of 1.63, but it has increased each year since. The TFR was considerably higher during the 1960s 'baby boom', peaking at 2.95 children per woman in 1964.[21] In 2010, England and Wales TFR rose to 2.00.[22] TFR in England in 2009 was 1.96.[23] In Scotland however TFR is lower: in 2009 it was 1.77.[23] Norther Ireland had the highest TFR in 2009, at 2.04; in Wales TFR was 1.93.[23]
The TFR for British residents also varies by country of birth. In England and Wales in 1996, people born in the UK had a TFR of 1.67, India 2.21 and Pakistan and Bangladesh 4.90, for example.[24]
Statistics for 2010 live births in England and Wales:[22] [25]
- total fertility rate was 2.00
- 46.8% of children were born to un-married women
- average (mean) age of mother at birth was 29.5 years
- 48% of all babies were born to mothers aged 30 and over
- 25.1% of children were born to mothers born outside the UK
Other statistics:
- 64.4% of children born in England and Wales in 2005 were recorded as White British.[26]
- in Scotland, in 2007, 78.4% of live births were to mothers born in Scotland, 9.2% to mothers born in England, 1.6% in Poland, 1.1% in Pakistan, 0.9% Northern Ireland, 0.7% Germany, 0.6% India, 0.5% Ireland, and 6.9% other countries[27]
- in 2009, in England and Wales, 25% of births were to women under 25, while 20% of births were to women 35 and over[28]
- 51% of babies born in in 2010 in Northern Ireland were to mothers aged 30 or over[29]
- 6% of babies born in Scotland in 2010 were to mothers under 20; 18% to mothers 20-24; 27% to mothers 25-29; 28% to mothers 30-34; 16% to mothers 35-39; 4% to mothers 40 and over [30]
- 50.2% of babies born in Scotland in 2010 were born to unmarried mothers [30]
- in England and Wales, in 2009, of the women born in 1964: 20% did not have any children; 12% had 1 child; 38% had 2 children; 19% had 3 children; 10% had 4+ children[31]
Sexual orientation
A 2010 survey from the Office of National Statistics found that 1.5% of Britons identify as either homosexual or bisexual—far lower than previous estimates of 5–7%.[32] Although this survey has been regarded as a false estimate by many for many reasons. One being that many people who engage in homosexual activities may not identify themselves as homosexuals. Another being that many gay individuals are still in the closet and choose not to reveal their sexuality. Furthermore they may actually be in heterosexual relationships or even in heterosexual marriages. Gay dating website Gaydar also contested this statistic, stating in an article in Pink News that they have 2.2 million members with Trevor Martin, managing director at Gaydar saying; “The Office for National Statistics figures don’t add up. With 2.2 million Gaydar profiles in the UK either there are a lot of straight guys playing away from girlfriends or every single gay and lesbian in the country tunes into GaydarRadio – or the ONS have got it terribly wrong.” Furthermore nearly four per cent of those asked on the ONS survey refused to answer, said they did not know or described themselves as “other".[33]
Ethnicity
Main articles: Ethnic groups in the United Kingdom, Foreign-born population of the United Kingdom, and Classification of ethnicity in the United KingdomFrom the United Kingdom Census 2001:
Ethnic group Population % of total* White British 50,366,497 85.67% White (other) 3,096,169 5.27% Indian 1,053,411 1.8% Pakistani 977,285 1.6% White Irish 691,232 1.2% Mixed race 677,117 1.2% Black Caribbean 565,876 1.0% Black African 485,277 0.8% Bangladeshi 283,063 0.5% Other Asian (non-Chinese) 247,644 0.4% Chinese 247,403 0.4% Other 230,615 0.4% Black (others) 97,585 0.2% * Percentage of total UK population Religion
The traditional religion in the United Kingdom is Christianity. In England the established church is the Church of England (Anglican). In Scotland, the Church of Scotland (a Presbyterian Church) is regarded as the 'national church' but there is not an established church. In Wales there is no established church, with the Church in Wales having been disestablished in 1920. Likewise, in Northern Ireland the Church of Ireland was disestablished in 1871. In Northern Ireland and similarly in parts of Scotland, there is a sectarian divide between Roman Catholic and Protestant communities.
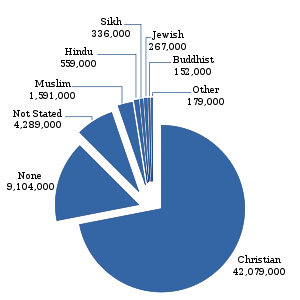
The table below shows the most recent census data (2001) regarding religion:[34]
Religion Number % Christian 42,079,000 71.6% No religion 9,104,000 15.5% Muslim 1,591,000 2.7% Hindu 559,000 1.0% Sikh 336,000 0.6% Jewish 267,000 0.5% Buddhist 152,000 0.3% Other religion 179,000 0.3% Not stated 4,289,000 7.3% Total religious 45,163,000 76.8% Rather than select one of the specified religions offered on the 2001 Census form, many people chose to write in their own religion. Some of these religions were reassigned to one of the main religions offered, predominantly within the Christian group.
In England and Wales, 151,000 people belonged to religious groups which did not fall into any of the main religions. The largest of these were Spiritualists (32,000) and Pagans (31,000), followed by Jain (15,000), Wicca (7,000), Rastafarian (5,000), Bahà'ì (5,000) and Zoroastrian (4,000).
Although the Census 2001 also recorded 390,000 Jedi Knights, making Jedi the fourth-largest "religion" in the UK, this does not confer them any official recognition. In fact, all returns with "Jedi Knight" were classified as "No religion", along with Atheist, Agnostic, Heathen and those who ticked "Other" but did not write in any religion.
An Office for National Statistics survey of 450,000 Britons in 2010 confirmed that 71% are Christian, 4% are Muslim and 21% lack a religious affiliation.[32]
See also: Status of religious freedom in the United Kingdom, Islam in the United Kingdom, Hinduism in the United Kingdom, Buddhism in the United Kingdom, Sikhism in the United Kingdom, History of the Jews in England, and Judaism in the United KingdomLanguages
The United Kingdom has no official language. The dominant language, spoken as a first language by 95% of the population, is English. Scots is spoken by around 500,000 people in Scotland and 30,000 in Northern Ireland, where it is called Ulster Scots. Welsh is spoken by around 600,000 people. Scottish Gaelic is spoken by about 60,000 speakers, mostly in Scotland. Cornish is spoken by around 2,500 people. Irish is spoken by about 106,844 speakers in Northern Ireland. The Polish minority in the United Kingdom estimated over 600,000 people speak mostly Polish at home, Polish Britons are mainly Polish-born immigrants to the UK, although many are those who settled in Britain after the second world war and their descendants. French language is spoken in the Channel Islands. British Sign Language is also common.
Education
Main articles: Education in England, Education in Northern Ireland, Education in Scotland, and Education in WalesEach country of the United Kingdom has a separate education system, with power over education matters in Scotland, Wales and Northern Ireland being devolved.
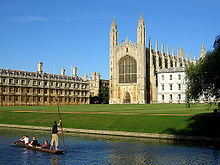
The Secretary of State for Education and the Secretary of State for Innovation, Universities and Skills are responsible to the UK Parliament for education in England, though the day to day administration and funding of state schools is the responsibility of Local Education Authorities. Universal state education in England and Wales was introduced for primary level in 1870 and secondary level in 1900.[35] Education is mandatory from ages five to sixteen (15 if born in late July or August). The majority of children are educated in state-sector schools, only a small proportion of which select on the grounds of academic ability. Despite a fall in actual numbers, the proportion of children in England attending private schools has risen to over 7%.[36] Just over half of students at the leading universities of Cambridge and Oxford had attended state schools.[37] State schools which are allowed to select pupils according to intelligence and academic ability can achieve comparable results to the most selective private schools: out of the top ten performing schools in terms of GCSE results in 2006 two were state-run grammar schools. England has some of the top universities in the world with Cambridge, Oxford, and London ranked amongst the top 20 in the 2007 THES - QS World University Rankings.[38]
In Scotland, the Cabinet Secretary for Education and Lifelong Learning is responsible to the Scottish Parliament for education, with day to day administration and funding of state schools being the responsibility of Local Authorities. Scotland first legislated for universal provision of education in 1696. The proportion of children in Scotland attending private schools is just over 4% though it has been rising slowly in recent years.[39] Scottish students who attend Scottish universities pay neither tuition fees nor graduate endowment charges as the fees were abolished in 2001 and the graduate endowment scheme was abolished in 2008.[40]
The National Assembly for Wales has responsibility for education in Wales. A significant number of students in Wales are educated either wholly or largely through the medium of Welsh and lessons in the language are compulsory for all until the age of 16. There are plans to increase the provision of Welsh Medium schools as part of the policy of having a fully bi-lingual Wales.
The Northern Ireland Assembly is responsible for education in Northern Ireland though responsibility at a local level is administered by 5 Education and Library Boards covering different geographical areas.
See also
- Demography of England
- Demography of Scotland
- Demography of Wales
- Demography of Northern Ireland
- Northern Irish people
- Genetic history of Britain
- Geography of the United Kingdom
- Census in the United Kingdom
- Office for National Statistics
- Lists of UK locations with large ethnic minority populations
References
- ^ Education (Scotland) Act 1872
- ^ Review of "The Tribes of Britain" James Owen, National Geographic 19 July 2005.
- ^ Stephen Oppenheimer, Myths of British ancestry, Prospect, October 2006. Retrieved 21 September 2006.
- ^ Mabel C. Buer, Health, Wealth and Population in the Early Days of the Industrial Revolution, London: George Routledge & Sons, 1926, page 30 ISBN 0-415-38218-1
- ^ The UK population: past, present and future, statistics.gov.uk
- ^ A portrait of Britain in 2031, The Independent, 24 October 2007
- ^ Statistics | Counting the Emigrants, Public Record Office of Northern Ireland
- ^ History and Lessons of Potato Late Blight, University of California
- ^ 1841: A window on Victorian Britain, The Independent
- ^ Irish-Catholic Immigration, The Library of Congress
- ^ Undiscovered Scotland: Timeline of Scottish History: 1800 to 1850
- ^ The Irish Potato Famine
- ^ Ireland – Population Summary
- ^ a b National Statistics Online
- ^ National Statistics Online
- ^ uk Statistics Online – Census 2001 – Population Pyramids – United Kingdom
- ^ southeast Statistics Online – Census 2001 – Population Pyramids – Bracknell Forest UA
- ^ southeast Statistics Online – Census 2001 – Population Pyramids – Isle of Wight UA
- ^ Population Trends, Office for National Statistics
- ^ http://www.localfutures.com/Home/Our_Network/Intelligence/Future_Drivers/Demographics/default.aspx
- ^ "Fertility: UK fertility highest since 1980". Office for National Statistics. 2007-08-22. http://www.statistics.gov.uk/cci/nugget.asp?id=951. Retrieved 2007-09-22.
- ^ a b http://www.statistics.gov.uk/pdfdir/birth0711.pdf
- ^ a b c http://www.statistics.gov.uk/cci/nugget.asp?id=951
- ^ Charles F. Westoff and Tomas Frejka, Fertility and religiousness among European Muslims, 21 February 2007. Retrieved 22 September 2007.
- ^ http://www.ons.gov.uk/ons/rel/vsob1/characteristics-of-Mother-1--england-and-wales/2010/stb-live-births-in-england-and-wales-by-characteristics-of-mother-2010.html
- ^ Moser, Kath; Stanfield, Kristina M. and Leon, David A. (2008). "Birthweight and gestational age by ethnic group, England and Wales 2005: Introducing new data on births". Health Statistics Quarterly 39 (39): 22–31. PMID 18810886. http://www.statistics.gov.uk/articles/hsq/HSQ39Birthwt&Gest_ethnicity.pdf.
- ^ http://www.gro-scotland.gov.uk/files1/stats/scotlands-population-2007-the-register-generals-annual-review-153rd-edition/j994405.htm
- ^ http://www.statistics.gov.uk/pdfdir/birth1010.pdf
- ^ http://www.nisra.gov.uk/archive/demography/publications/births_deaths/births_2010.pdf
- ^ a b http://www.gro-scotland.gov.uk/files2/stats/annual-review-2010/rgar2010.pdf
- ^ http://www.statistics.gov.uk/pdfdir/cohfer1210.pdf
- ^ a b Travis, Alan (2010-09-23). "1.5% of Britons say they are gay or bisexual, ONS survey finds". The Guardian. http://www.guardian.co.uk/world/2010/sep/23/gay-bisexual-population-uk. Retrieved 2010-09-23.
- ^ http://www.pinknews.co.uk/2010/09/24/1.5-figure-is-wrong-says-gay-website-with-2.2.-million-members/
- ^ 2001 census data (by ethnicity)
- ^ "United Kingdom". Humana. http://www.humana.org/Article.asp?TxtID=223&SubMenuItemID=183&MenuItemID=43. Retrieved 2006-05-18.
- ^ Private school pupil numbers in decline guardian.co.uk 9 November 2007
- ^ More state pupils in universities BBC News, 19 July 2007
- ^ "The top 200 world universities". Times Higher Education. 2007-11-09. http://www.timeshighereducation.co.uk/hybrid.asp?typeCode=144. Retrieved 2008-02-19.
- ^ in private school intake BBC News 17 April 2007
- ^ MSPs vote to scrap endowment fee BBC News, 28 February 2008
Bibliography
- "Census 2001". Religion in Britain. http://www.statistics.gov.uk/cci/nugget.asp?id=293. Retrieved 6 September 2005.
- "Census 2001". 390,000 Jedis There Are. http://www.statistics.gov.uk/CCI/nugget.asp?ID=297&Pos=&ColRank=2&Rank=1000. Retrieved 6 September 2005.
- Census 2001 website
- Abstract (1833). Abstract of the Answers and Returns made pursuant to an act passed in the eleventh year of the reign of His Majesty King George IV intituled an act for taking an account of the population of Great Britain, and the increase and diminution thereof. Population Register Abstract 1831. British Parliamentary Papers, 38.
- Arkell, T. (1992). An Examination of the Poll Taxes of the late Seventeenth Century, the Marriage Duty Act and Gregory King.
- K. Schürer, & T. Arkell (eds.), Surveying the People: the interpretation and use of document sources for the study of population in the late seventeenth century (pp. 142–177). Oxford: Leopard’s Hill Press.
- Boulton, J. (1992). "The Marriage Duty Act and parochial registration in London, 1695–1706". In: K. Schürer, & T. Arkell (eds.), Surveying the People: the interpretation and use of document sources for the study of population in the late seventeenth century; pp. 222–252. Oxford: Leopard’s Hill Press.
- Boulton, J. (1993). "Clandestine marriage in London: an examination of the neglected urban variable", in: Urban History; 20, pp. 191–210.
External links
- Population Trends
- Social Trends
- Population and migration Office for National Statistics
- Population cartogram of the United Kingdom
Demographics of Europe Sovereign
states- Albania
- Andorra
- Armenia
- Austria
- Azerbaijan
- Belarus
- Belgium
- Bosnia and Herzegovina
- Bulgaria
- Croatia
- Cyprus
- Czech Republic
- Denmark
- Estonia
- Finland
- France
- Georgia
- Germany
- Greece
- Hungary
- Iceland
- Ireland
- Italy
- Kazakhstan
- Latvia
- Liechtenstein
- Lithuania
- Luxembourg
- Macedonia
- Malta
- Moldova
- Monaco
- Montenegro
- Netherlands
- Norway
- Poland
- Portugal
- Romania
- Russia
- San Marino
- Serbia
- Slovakia
- Slovenia
- Spain
- Sweden
- Switzerland
- Turkey
- Ukraine
- United Kingdom
- (England
- Northern Ireland
- Scotland
- Wales)
- Vatican City
States with limited
recognition- Abkhazia
- Kosovo
- Nagorno-Karabakh
- Northern Cyprus
- South Ossetia
- Transnistria
Dependencies
and other territories- Åland
- Faroe Islands
- Gibraltar
- Guernsey
- Jan Mayen
- Jersey
- Isle of Man
- Svalbard
Other entities - European Union
 United Kingdom topics
Geography Administrative Physical Lakes and lochs · Mountains · Rivers · Volcanoes · Great Britain · Geology of Great Britain · Geology of Northern Ireland
History Maritime · Economic · Military · British Empire · Timeline
Politics · Government Economy Pound sterling · London Stock Exchange · Banks (Bank of England) · Taxation · Transport · Communications · Economic geography · Mining · Energy · Budget
Military Society · Demography Cities · Crime · Ethnic groups · Immigration · Languages · Poverty · Social structure · Towns
Culture Art · Cinema · Cuisine · Identity · Literature · Media · Music · Sport · Television · Theatre · Public holidays
England Northern Ireland Scotland Wales History · Welsh Government · Welsh Assembly · First Minister · Politics · Education · Health care · Religion · Tourism
 Category ·
  Portal ·
  WikiProjectCategories:
- Demographics of the United Kingdom
Wikimedia Foundation. 2010.

