- World economy
-
Economy of the world
During 2003 unless otherwise statedPopulation 7,000,000,000 (October 31, 2011)[1] GDP Currency: US$61.96 trillion, €55.8 trillion (2010 est.)[2]
PPP: US$74.00 trillion, €60 trillion (2010 est.)[2]GDP growth Per capita (PPP): -0.8% (2009 est.) GDP per capita Currency: US$7,178, €5,000
PPP: US$10,500, €7,500Millionaires (US$) ~10 million i.e. ~0.15% (2009) Unemployment 30% combined unemployment and underemployment in many non-industrialized countries. Developed countries typically 4-12% unemployment. Billionaires (US$) 1,011 (2010)[3] People paid below US$2 per day ~3.25 billion (~50%) Trailing-ten-years. Most numbers are from the UNDP from 2002, some numbers exclude certain countries for lack of information.
See also: Economy of the world – Economy of Africa – Economy of Asia – Economy of Europe – Economy of North America – Economy of Oceania – Economy of South AmericaThe world economy, or global economy, generally refers to the economy, which is based on economies of all of the world's countries, national economies. Also global economy can be seen as the economy of global society and national economies – as economies of local societies, making the global one. It can be evaluated in various kind of ways. For instance, depending on the model used, the valuation that is arrived at can be represented in a certain currency, such as 2006 US dollars or 2005 euros.
It is inseparable from the geography and ecology of Earth, and is therefore somewhat of a misnomer, since, while definitions and representations of the "world economy" vary widely, they must at a minimum exclude any consideration of resources or value based outside of the Earth. For example, while attempts could be made to calculate the value of currently unexploited mining opportunities in unclaimed territory in Antarctica, the same opportunities on Mars would not be considered a part of the world economy—even if currently exploited in some way—and could be considered of latent value only in the same way as uncreated intellectual property, such as a previously unconceived invention.
Beyond the minimum standard of concerning value in production, use, and exchange on the planet Earth, definitions, representations, models, and valuations of the world economy vary widely.
It is common to limit questions of the world economy exclusively to human economic activity, and the world economy is typically judged in monetary terms, even in cases in which there is no efficient market to help valuate certain goods or services, or in cases in which a lack of independent research or government cooperation makes establishing figures difficult. Typical examples are illegal drugs and other black market goods, which by any standard are a part of the world economy, but for which there is by definition no legal market of any kind.
However, even in cases in which there is a clear and efficient market to establish a monetary value, economists do not typically use the current or official exchange rate to translate the monetary units of this market into a single unit for the world economy, since exchange rates typically do not closely reflect worldwide value, for example in cases where the volume or price of transactions is closely regulated by the government.
Rather, market valuations in a local currency are typically translated to a single monetary unit using the idea of purchasing power. This is the method used below, which is used for estimating worldwide economic activity in terms of real US dollars or euros. However, the world economy can be evaluated and expressed in many more ways. It is unclear, for example, how many of the world's 6.8 billion people have most of their economic activity reflected in these valuations.
In 2011, the largest economies in the world with more than $2 trillion, €1.25 trillion by nominal GDP are the United States, China, Japan, Germany, France, the United Kingdom, Brazil, and Italy. The largest economies in the world with more than $2 trillion, €1.25 trillion by GDP (PPP) are the United States, China, Japan, India, Germany, Russia, the United Kingdom, Brazil, and France.
Contents
Economy – overview
1980 – 1990 - United States and Japan lead expansion
At exchange rates, the economic output of 112 markets expanded by $10.7 trillion from 1980 to 1990. The economic output of 34 markets contracted by $276.9 billion from 1980 to 1990. The five largest contributors to global output contraction are Argentina at 24%, Saudi Arabia at 17%, Nigeria at 11%, Venezuela at 8%, and Vietnam at 8%. At purchasing power parity, the economic output of 145 markets expanded by $12.1 trillion from 1980 to 1990. The economic output of 2 markets contracted by $3.5 billion from 1980 to 1990. The two contributors to global output contraction are Lebanon at 70% and Libya at 30%. The following two tables are lists of twenty largest economies by incremental GDP from 1980 to 1990 by International Monetary Fund.
List of Economies by Incremental Nominal GDP from 1980 to 1990[4] List of Economies by Incremental GDP (PPP) from 1980 to 1990[5] Rank Country Incremental GDP (billions of US$) Share of Global Incremental GDP — World 11,472.974 100.00% —  European Union
3,390.679 29.55% 1  United States
3,012.375 26.26% 2  Japan
Japan1,987.042 17.32% 3  Germany
720.884 6.28% 4  Italy
Italy674.913 5.88% 5  France
557.067 4.86% 6  United Kingdom
475.340 4.14% 7  Brazil
345.169 3.01% 8  Canada
313.846 2.74% 9  Spain
Spain296.214 2.58% 10  South Korea
206.020 1.80% 11  China
China187.820 1.64% 12  Australia
162.357 1.42% 13  India
India142.111 1.24% 14  Switzerland
128.368 1.12% 15  Taiwan
122.749 1.07% 16  Netherlands
114.563 1.00% 17  Sweden
111.469 0.97% 18  Turkey
108.118 0.94% 19  Finland
86.180 0.75% 20  Austria
85.041 0.74% — Remaining Countries 1,635.328 14.25% Rank Country Incremental GDP (billions of US$) Share of Global Incremental GDP — World 12,167.955 100.00% — European Union3,179.570 26.13% 1 United States3,012.375 24.76% 2 Japan1,349.389 11.09% 3 Germany684.548 5.63% 4 China663.033 5.45% 5 France494.476 4.06% 6 United Kingdom476.685 3.92% 7 Italy465.212 3.82% 8 India458.522 3.77% 9 Brazil338.756 2.78% 10 Spain279.151 2.29% 11  Mexico
275.781 2.27% 12 Canada270.732 2.22% 13 South Korea247.859 2.04% 14 Turkey175.159 1.44% 15  Indonesia
169.242 1.39% 16 Australia158.145 1.30% 17 Taiwan137.332 1.13% 18 Netherlands132.426 1.09% 19  Iran
Iran130.678 1.07% 20  Thailand
113.166 0.93% — Remaining Countries 2,135.288 17.55% 1990 – 2000 - United States dominates expansion
At exchange rates, the economic output of 122 markets expanded by $10.7 trillion from 1990 to 2000. The economic output of 29 markets contracted by $94.2 billion from 1990 to 2000. The five largest contributors to global output contraction are Italy at 37%, Finland at 18%, Bulgaria at 9%, Algeria at 8%, and the Democratic Republic of Congo at 5%.
At purchasing power parity, the economic output of 148 markets expanded by $16.9 trillion from 1990 to 2000. The economic output of 3 markets contracted by $17.8 billion from 1990 to 2000. The three contributors to global output contraction are Bulgaria at 64%, the Democratic Republic of Congo at 29% and Sierra Leone at 7%.
List of Economies by Incremental Nominal GDP from 1990 to 2000[6] List of Economies by Incremental GDP (PPP) from 1990 to 2000[7] Rank Country Incremental GDP (billions of US$) Share of Global Incremental GDP — World 10,033.659 100.00% 1 United States4,150.950 41.37% 2 Japan1,609.410 16.04% — European Union1,453.165 14.48% 3 China808.200 8.05% 4 United Kingdom462.735 4.61% 5 Mexico384.126 3.83% 6 Germany344.908 3.44% 7 South Korea262.980 2.62% 8 Taiwan161.188 1.61% 9 India152.823 1.52% 10  Argentina
143.142 1.43% 11 Canada142.179 1.42% 12 Brazil134.634 1.34% 13  Poland
109.179 1.09% —  Hong Kong
92.231 0.92% 14 Netherlands90.960 0.91% 15 France83.886 0.84% 16 Australia73.788 0.74% 17  Saudi Arabia
71.915 0.72% 18  Israel
69.805 0.70% 19  Venezuela
68.760 0.69% 20 Turkey64.063 0.64% — Remaining Countries 551.797 5.50% Rank Country Incremental GDP (billions of US$) Share of Global Incremental GDP — World 18,778.927 100.00% 1 United States4,150.950 22.10% — European Union3,829.220 20.39% 2 China2,104.502 11.21% 3 Japan886.513 4.72% 4 India826.837 4.40% 5 Germany697.450 3.71% 6 United Kingdom554.819 2.95% 7 France503.128 2.68% 8 Mexico452.924 2.41% 9 Brazil451.897 2.41% 10 South Korea440.124 2.34% 11 Italy425.005 2.26% 12 Spain348.795 1.86% 13 Canada345.817 1.84% 14 Taiwan250.858 1.34% 15 Indonesia224.138 1.19% 16 Australia222.367 1.18% 17 Turkey221.496 1.18% 18 Netherlands191.528 1.02% 19 Iran188.268 1.00% 20 Poland173.232 0.92% — Remaining Countries 5,118.279 27.26% 2000 – 2010 – Rise of Developing and Emerging Economies
2000 – 2006 – United States still leads, but China is catching up
At exchange rates, the economic output of 176 markets expanded by $17.4 trillion from 2000 to 2006. The five largest contributors to global output expansion are the United States at 20%, China at 9%, Germany at 6%, the United Kingdom at 6%, and France at 5%. The economic output of 4 markets contracted by $94.2 billion from 2000 to 2006. The three largest contributors to global output contraction are Japan at 80%, Argentina at 19%, and the Uruguay at 1%.
At purchasing power parity, the economic output of 180 markets expanded by $19.2 trillion from 2000 to 2006. The five largest contributors to global output expansion are the United States at 18%, China at 17%, India at 6%, Japan at 5%, and Russia at 4%.
2007 – China leads expansion
The economic output by nominal GDP of 183 markets expanded by $6.4 trillion during 2007. China accounted for 12% while the United States accounted for 10%, Germany accounted for 6%, and the United Kingdom accounted for 6% of the global output expansion.
2008 – credit crisis begins
The economic output of 171 markets expanded by $5.8 trillion during 2008. China accounted for one-sixth of the global output expansion. The economic output of 11 markets contracted by $267 billion during 2008. The United Kingdom accounted for one-half while South Korea accounted for two-fifth of the global output contraction. Though the crisis first affected most countries in 2008, it was not yet deep enough to reverse growth.
2009 – credit crisis spreads
At exchange rates, the economic output of 127 markets contracted by $4.1 trillion during 2009. The United Kingdom was the largest victim accounting for 12% while Russia accounted for 11% and Germany accounted for 8% of the global output contraction. The economic output of 56 markets expanded by $767.1 billion during 2009. China accounted for 61% while Japan accounted for 20% and Indonesia accounted for 4% of the global output expansion.
At purchasing power parity, the economic output of 79 markets contracted by $1.4 trillion during 2009. The United States was the largest victim accounting for 18% while Japan accounted for 17% and Russia accounted for 10% of the global output contraction. The economic output of 104 markets expanded by $1.5 trillion during 2009. China accounted for 56% while India accounted for 17% and Indonesia accounted for 3% of the global output expansion.
2010 – recovery
At exchange rates, the economic output of 148 markets expanded by $5.3 trillion during 2010. The five largest contributors to global output expansion are China at 17%, the United States at 10%, Brazil at 9%, Japan at 8%, and India at 5%. The economic output of 35 markets contracted by $338.5 billion during 2010. The five largest contributors to global output contraction are France at 22%, Italy at 18%, Spain at 17%, Venezuela at 10%, and Germany at 7%.
At purchasing power parity, the economic output of 169 markets expanded by $4.2 trillion during 2010. The five largest contributors to global output expansion are China at 25%, the United States at 13%, India at 10%, Japan at 5%, and Brazil at 4%. The economic output of 14 markets contracted by $17.8 billion during 2010. The five largest contributors to global output contraction are Greece at 67%, Venezuela at 19%, Romania at 5%, Haiti at 3%, and Croatia at 2%.
IMF's economic outlook for 2010 noted that banks faced a "wall" of maturing debt, which presents important risks for the normalization of credit conditions. There has been little progress in lengthening the maturity of their funding and, as a result, over $4 trillion in debt is due to be refinanced in the next 2 years.[8]`
The following two tables are lists of twenty largest economies by incremental GDP from 2000 to 2010 by International Monetary Fund.
List of Economies by Incremental Nominal GDP from 2000 to 2010[9] List of Economies by Incremental GDP (PPP) from 2000 to 2010[10] Rank Country Incremental GDP (billions of US$) Share of Global Incremental GDP — World 30,694.784 100.00% — European Union7,746.655 25.24% 1 China4,679.779 15.25% 2 United States4,575.075 14.91% 3 Brazil1,447.896 4.72% 4 Germany1,394.517 4.54% 5 France1,230.874 4.01% 6  Russia
1,220.123 3.98% 7 India1,155.620 3.76% 8 Italy954.551 3.11% 9 Canada852.126 2.78% 10 Australia836.375 2.72% 11 Spain827.569 2.70% 12 Japan791.349 2.58% 13 United Kingdom769.682 2.51% 14 Indonesia541.231 1.76% 15 South Korea481.097 1.57% 16 Turkey469.048 1.53% 17 Netherlands394.138 1.28% 18 Mexico362.379 1.18% 19 Iran310.942 1.01% 20 Poland298.138 0.97% — Remaining Countries 7,102.275 23.14% Rank Country Incremental GDP (billions of US$) Share of Global Incremental GDP — World 32,120.264 100.00% 1 China7,104.468 22.12% — European Union4,644.825 14.46% 2 United States4,575.075 14.24% 3 India2,486.325 7.74% 4 Russia1,110.081 3.46% 5 Japan1,108.850 3.45% 6 Brazil944.114 2.94% 7 Germany800.073 2.49% 8 South Korea690.370 2.15% 9 United Kingdom665.196 2.07% 10 France600.626 1.87% 11 Indonesia531.966 1.66% 12 Mexico499.665 1.56% 13 Spain472.438 1.47% 14 Turkey455.658 1.42% 15 Iran455.302 1.42% 16 Canada445.591 1.39% 17 Italy381.207 1.19% 18 Taiwan372.688 1.16% 19 Australia356.136 1.11% 20 Poland326.560 1.02% — Remaining Countries 7,737.875 24.09% 2010 – 2016 The BRICs lead economic growth.
At exchange rates, the economic output of the world is expected to expand by US$28.7 trillion, €20 trillion from 2010 to 2016.[11] At purchasing power parity, the economic output of 183 markets is expected to expand by US$29.1 trillion, €25 trillion from 2010 to 2016.[12] The following two tables are predictive lists of forty largest economies by incremental GDP from 2010 to 2016 by International Monetary Fund.
Predictive List of Economies by Incremental Nominal GDP from 2010 to 2016[13] Predictive List of Economies by Incremental GDP (PPP) from 2010 to 2016[14] Rank Country Incremental GDP (billions of US$) Share of Global Incremental GDP — World 28,664.160 100.00% 1 China5,901.722 20.59% — European Union4,808.275 16.77% 2 United States3,724.097 12.99% 3 Russia1,608.236 5.61% 4 India1,394.939 4.87% 5 Japan1,324.140 4.62% 6 Brazil1,282.701 4.47% 7 United Kingdom973.522 3.40% 8 France704.864 2.46% 9 Indonesia674.918 2.35% 10 South Korea671.361 2.34% 11 Germany642.659 2.24% 12 Australia571.037 1.99% 13 Canada528.798 1.84% 14 Mexico470.710 1.64% 15 Italy421.204 1.47% 16 Turkey397.580 1.39% 17 Spain353.651 1.23% 18 Taiwan337.235 1.18% 19 Sweden325.283 1.13% 20 Saudi Arabia288.458 1.01% 21 Switzerland237.156 0.83% 22 Poland224.310 0.78% 23 Iran222.480 0.78% 24 Thailand219.045 0.76% 25 Netherlands187.052 0.65% 26 Argentina179.994 0.63% 27  Kazakhstan
177.049 0.62% 28  South Africa
171.913 0.60% 29  United Arab Emirates
162.645 0.57% 30  Nigeria
156.766 0.55% 31  Belgium
154.013 0.54% 32  Colombia
141.267 0.49% 33  Norway
132.653 0.46% — Hong Kong130.731 0.46% 34  Romania
127.647 0.45% 35  Pakistan
126.254 0.44% 36  Malaysia
123.778 0.43% 37  Egypt
Egypt123.282 0.43% 38 Austria118.493 0.41% 39  Ukraine
117.496 0.41% 40  Singapore
115.901 0.40% — Remaining Countries 2,717.120 9.48% Rank Country Incremental GDP (billions of US$) Share of Global Incremental GDP — World 29,103.681 100.00% 1 China8,547.378 29.37% 2 United States3,724.097 12.80% — European Union3,080.774 10.59% 3 India2,861.687 9.83% 4 Russia809.035 2.78% 5 Brazil787.335 2.71% 6 Japan744.838 2.56% 7 Indonesia609.759 2.10% 8 Germany538.678 1.85% 9 South Korea538.172 1.85% 10 Mexico514.450 1.77% 11 United Kingdom488.910 1.68% 12 France430.078 1.48% 13 Taiwan362.361 1.25% 14 Turkey353.993 1.22% 15 Iran313.617 1.08% 16 Canada306.830 1.05% 17 Argentina273.311 0.94% 18 Australia256.857 0.88% 19 Saudi Arabia254.129 0.87% 20 Spain246.887 0.85% 21 Thailand244.185 0.84% 22 Poland231.544 0.80% 23 Italy225.945 0.78% 24 Nigeria210.561 0.72% 25 Egypt190.444 0.65% 26 Malaysia186.781 0.64% 27 Pakistan180.020 0.62% 28 Colombia176.371 0.61% 29 South Africa176.073 0.60% 30  Vietnam
166.087 0.57% 31  Philippines
160.398 0.55% 32  Bangladesh
151.617 0.52% 33  Peru
Peru144.616 0.50% — Hong Kong134.821 0.46% 34 Netherlands126.172 0.43% 35 Ukraine119.600 0.41% 36 Singapore113.837 0.39% 37  Chile
Chile111.057 0.38% 38 Sweden109.062 0.37% 39 Kazakhstan106.157 0.36% 40  Iraq
Iraq103.853 0.36% — Remaining Countries 2,772.078 9.52% Statistical indicators
Economy
- GDP (GWP) (gross world product): (purchasing power parity exchange rates) – $59.38 trillion (2005 est.), $51.48 trillion (2004), $23 trillion (2002)
- GDP (GWP) (gross world product):[15] (market exchange rates) – $60.69 trillion (2008)
- GDP – real growth rate: 3.2% (2008), 3.1% p.a. (2000–07), 2.4% p.a. (1990–99), 3.1% p.a. (1980–89)
- GDP – per capita: purchasing power parity – $9,300, €7,500 (2005 est.), $8,200, €6,800 (92) (2003), $7,900, €5,000 (2002)
- World median income: purchasing power parity $1,041, €950 (1993)[16]
- GDP – composition by sector: agriculture: 4%; industry: 32%; services: 64% (2004 est.)
- Inflation rate (consumer prices): developed countries 1% to 4% typically; developing countries 5% to 60% typically; national inflation rates vary widely in individual cases, from declining prices in Japan to hyperinflation in several Third World countries (2003)
- Derivatives OTC outstanding notional amount: $601 trillion (Dec 2010) ([12])
- Derivatives exchange traded outstanding notional amount: $82 trillion (June 2011) ([13])
- Global debt issuance: $5.187 trillion, €3 trillion (2004), $4.938 trillion, €3.98 trillion (2003), $3.938 trillion (2002) (Thomson Financial League Tables)
- Global equity issuance: $505 billion, €450 billion (2004), $388 billion. €320 billion (2003), $319 billion, €250 trillion (2002) (Thomson Financial League Tables)
Employment
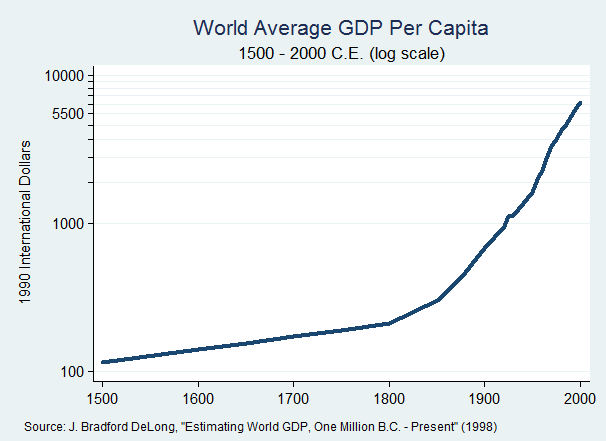
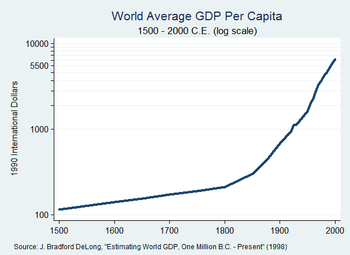 World GDP per capita between 1500–2000 (log scale)
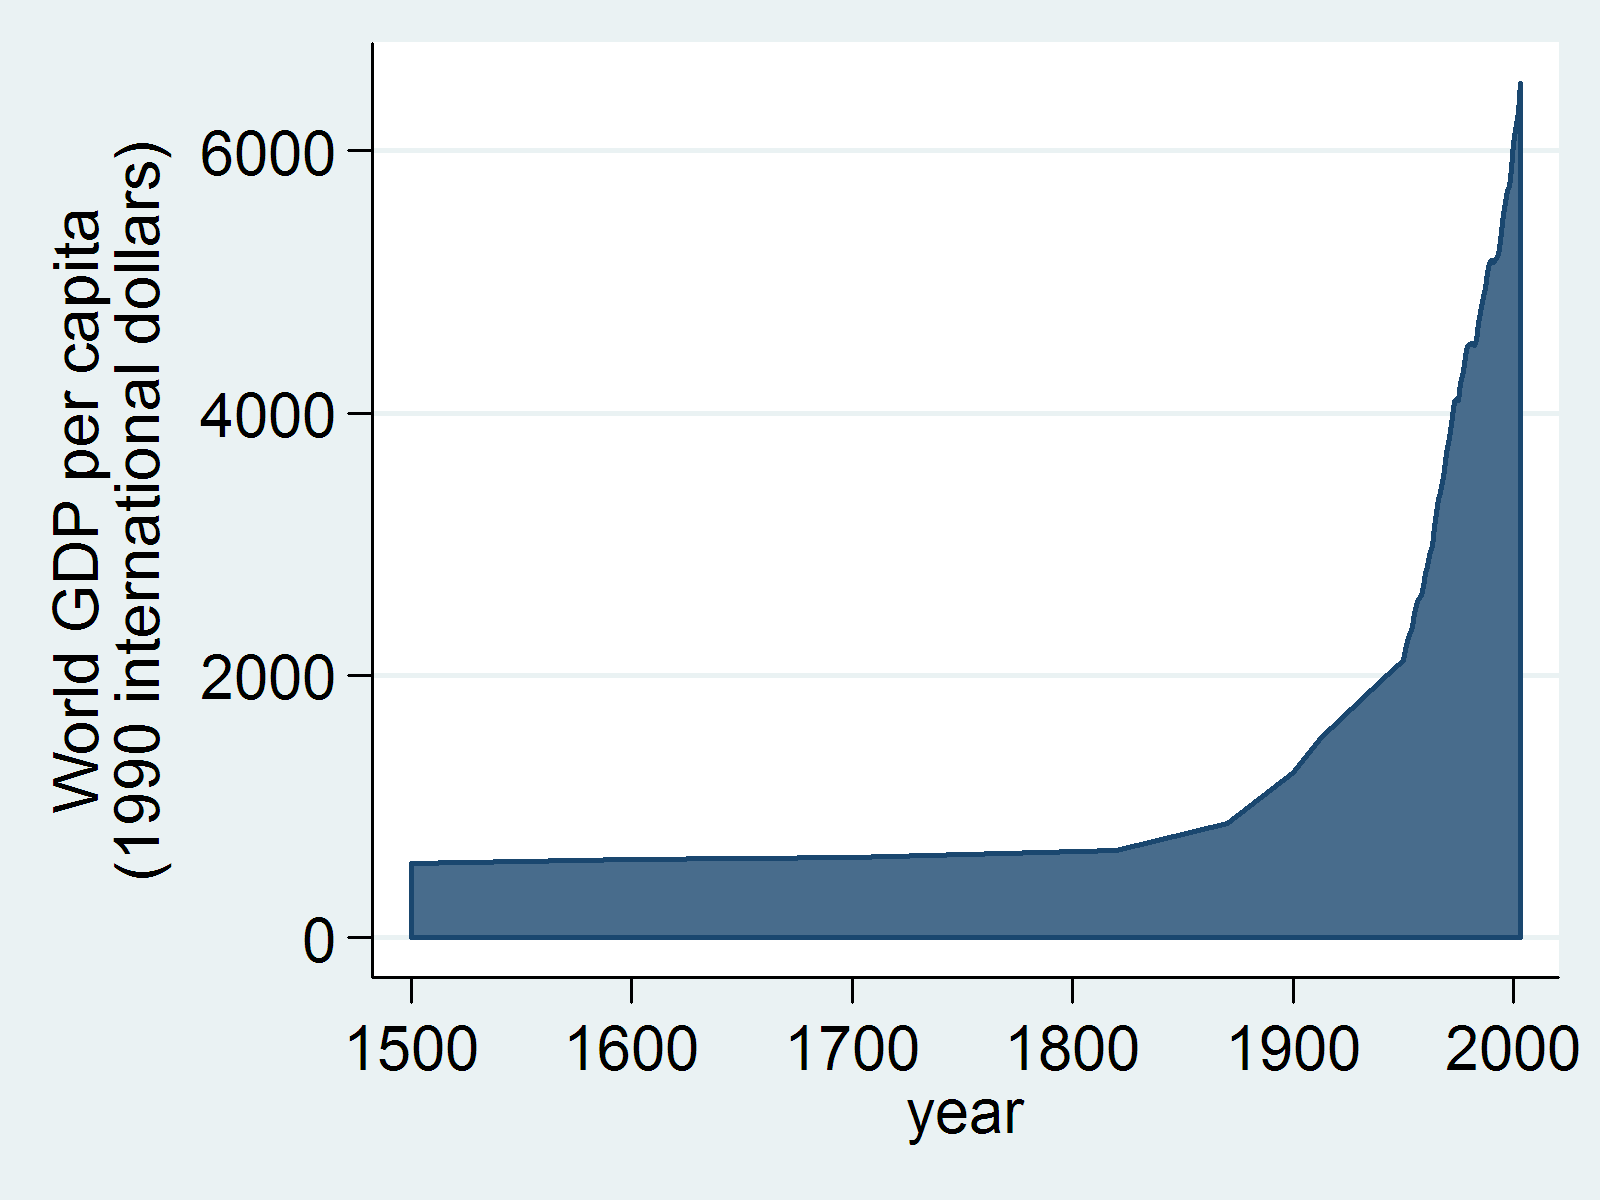
 World GDP per capita between 1500–2003
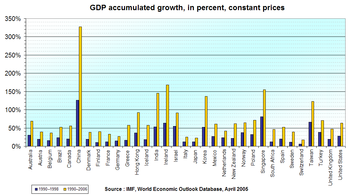 GDP increase, 1990–1998 and 1990–2006, in major countries.
- Unemployment rate: 8.7% (2009 est.). 30% (2007 est.) combined unemployment and underemployment in many non-industrialized countries; developed countries typically 4%–12% unemployment.
Industries
- Industrial production growth rate: 3% (2002 est.)
Energy
- Yearly electricity – production: 15,850,000 GWh (2003 est.), 14,850,000 GWh (2001 est.)
- Yearly electricity – consumption: 14,280,000 GWh (2003 est.), 13,930,000 GWh (2001 est.)
- Oil – production: 79,650,000 bbl/d (12,663,000 m3/d) (2003 est.), 75,460,000 barrels per day (11,997,000 m3/d) (2001)
- Oil – consumption: 80,100,000 bbl/d (12,730,000 m3/d) (2003 est.), 76,210,000 barrels per day (12,116,000 m3/d) (2001)
- Oil – proved reserves: 1.025 trillion barrel (163 km³) (2001 est.)
- Natural gas – production: 2,569 km³ (2001 est.)
- Natural gas – consumption: 2,556 km³ (2001 est.)
- Natural gas – proved reserves: 161,200 km³ (1 January 2002)
Cross-border
- Yearly exports: $12.4 trillion, €8.75 trillion (2009 est.)
- Exports – commodities: the whole range of industrial and agricultural goods and services
- Exports – partners: US 12.7%, Germany 7.1%, China 6.2%, France 4.4%, Japan 4.2%, UK 4.1% (2008)
- Yearly imports: $12.29 trillion, €9 trillion (2009 est.)
- Imports – commodities: the whole range of industrial and agricultural goods and services
- Imports – partners: China 10.3%, Germany 8.6%, US 8.1%, Japan 5% (2008)
- Debt – external: $56.9 trillion, €40 trillion (31 December 2009 est.)
Gift economy
- Yearly economic aid – recipient: Official Development Assistance (ODA) $50 billion, €39.5 billion
Communications
Telephones – main lines in use: 843,923,500 (2007)
4,263,367,600 (2008)- Telephones – mobile cellular: 3,300,000,000 (Nov. 2007)[17]
- Internet Service Providers (ISPs): 10,350 (2000 est.)
- Internet users: 1,311,050,595 (January 18, 2008 [14] est.), 1,091,730,861 (December 30, 2006 [15] est.), 604,111,719 (2002 est.)
Transport
Transportation infrastructure worldwide includes:
- Airports
- Total: 49,973 (2004)
- Roadways (in kilometres)
- Total: 32,345,165 km
- Paved: 19,403,061 km
- Unpaved: 12,942,104 km (2002)
- Railways
- Total: 1,122,650 km includes about 190,000 to 195,000 km of electrified routes of which 147,760 km are in Europe, 24,509 km in the Far East, 11,050 km in Africa, 4,223 km in South America, and 4,160 km in North America.
Military
- Military expenditures – dollar figure: aggregate real expenditure on arms worldwide in 1999 remained at approximately the 1998 level, about $750 billion, about 1/2 of which was the United States (1999)
- Military expenditures – percent of GDP: roughly 2% of gross world product (1999).
Economic Studies
To promote exports, many government agencies publish on the web economic studies by sector and country. Among these agencies include the USCS (US DoC) and FAS (USDA) in the United States, EDC and AAFC in Canada, Ubifrance in France, UKTI in the UK, HKTDC and JETRO in Asia, Austrade and NZTE in Oceania. Through Partnership Agreements, The Federation of International Trade Associations publishes studies from several of these agencies (USCS, FAS, AAFC, UKTI, HKTDC), as well as other non-governmental organizations on its website GlobalTrade.net.
See also
- Economic history of the world
- Common Wealth: Economics for a Crowded Planet (book)
- Global workforce
- Globality
- Globalization
- Trade route
- World Trade Report
- The World Economy: Historical Statistics
Regional economies:
- Economy of Africa
- Economy of Asia
- Economy of Europe
- Economy of North America
- Economy of Oceania
- Economy of South America
Events:
- 2007–2008 world food price crisis
- Late 2000s recession
- Oil price increases since 2003
Lists:
- List of countries by GDP sector composition
- List of world's largest economies (nominal) – based on current currency market exchange rates
- List of world's largest economies (PPP) – based on purchasing power parity
- Historical list of world's largest economies (nominal) – for the years between 1998 and 2003
- Historical list of world's largest economies (PPP) – for the years between 1 and 1998
- List of world production
References
- ^ [1]
- ^ a b [2]
- ^ [3]
- ^ [4] IMF nominal GDP Data (September 2011)
- ^ [5] IMF GDP (PPP) Data (September 2011)
- ^ [6] IMF nominal GDP Data (September 2011)
- ^ [7] IMF GDP (PPP) Data (September 2011)
- ^ p.11
- ^ [8] IMF nominal GDP Data (September 2011)
- ^ [9] IMF GDP (PPP) Data (September 2011)
- ^ IMF GDP Data (September 2011)
- ^ IMF World GDP Data (September 2011)
- ^ [10] IMF nominal GDP Data (September 2011)
- ^ [11] IMF GDP (PPP) Data (September 2011)
- ^ IMF World Economic Outlook, Crisis and Recovery, April 2009
- ^ B. Milanovic (January 2002). "True World Income Distribution, 1988 and 1993: First Calculation Based on Household Surveys Alone". http://siteresources.worldbank.org/INTDECINEQ/Resources/trueworld.pdf. Retrieved 13 May 2011.
- ^ global cellphone penetration reaches 50 percent
External links
Categories:- Economies
- World economy

Wikimedia Foundation. 2010.