- Demography of England
-
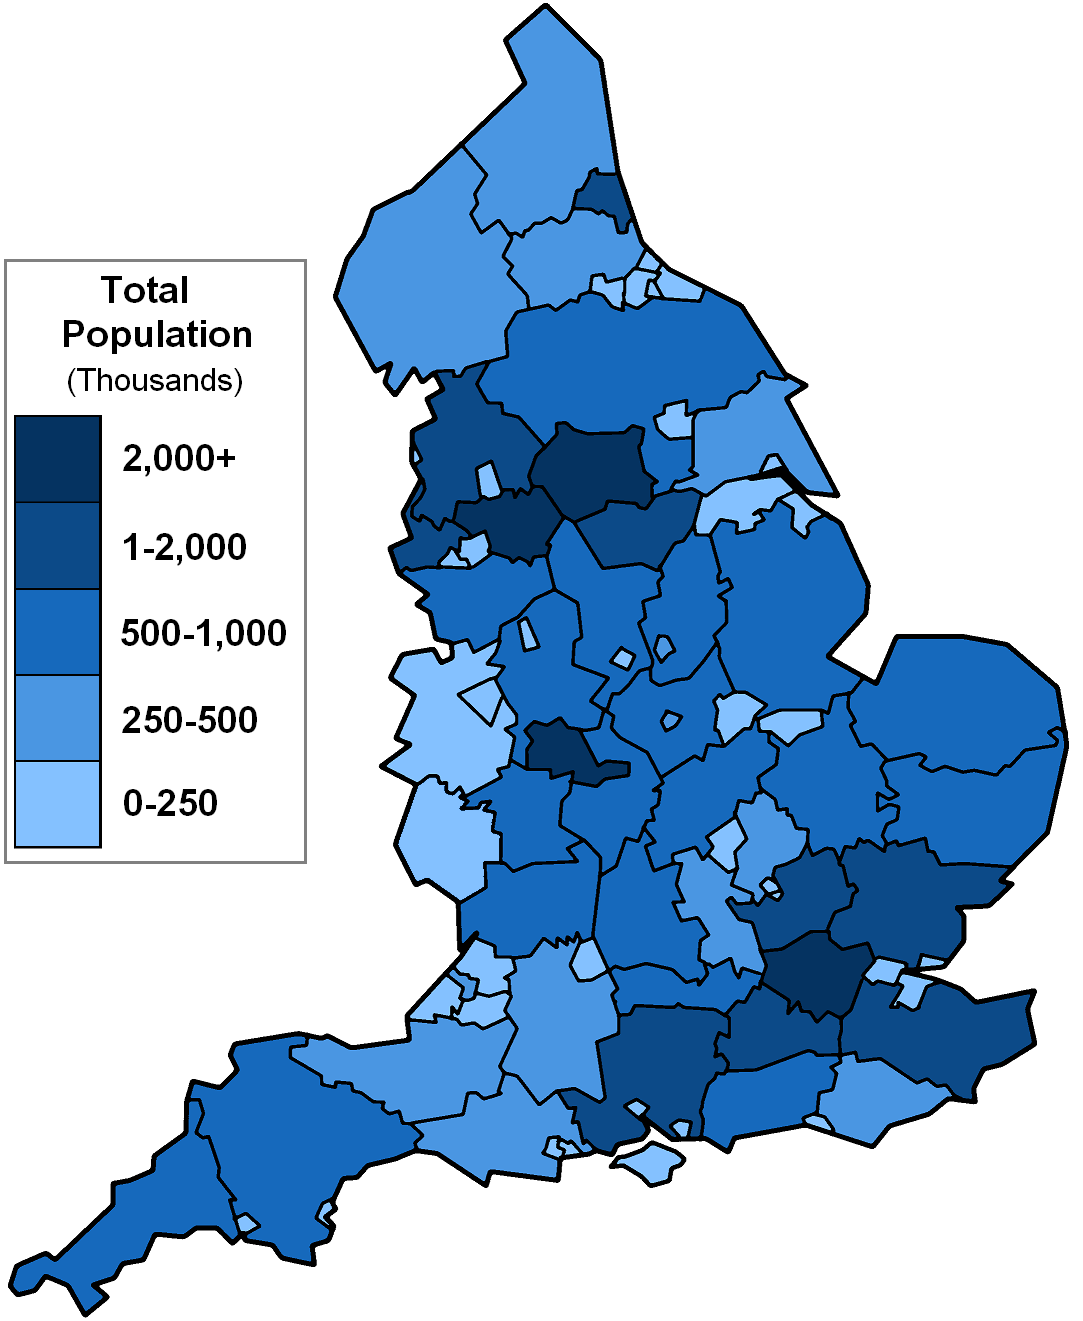
 The non-metropolitan counties and unitary authorities of England, colour-coded to show population. The City of London is not included.
The demography of England has since 1801 been measured by the decennial national census, and is marked by centuries of population growth and urbanisation. Due to the lack of authoritative contemporary sources, estimates of the population of England for dates prior to the first census in 1801 vary considerably.
Contents
Population
See also: Population of the countries of the United KingdomThe population at the time of the 2001 census was 49,138,831
- Total Fertility Rate: 1.97[1] (higher than Germany - 1.42 & Italy - 1.40, lower than France - 2.02)
Historical Population
- 1100 - Between 1.5 and 2.5 million.[2]
- 1315 - Between 4 and 6 million.[2]
- 1350 - 3 million or less.[3]
- 1541 - 2,774,000 [note 1][4]
- 1601 - 4,110,000 [4]
- 1651 - 5,228,000 [4]
- 1701 - 5,058,000 [4]
- 1751 - 5,772,000 [4]
- 1801 - 8,308,000 at the time of the first (one off) census (probably underestimated) Census officials estimated at the time that there had been an increase of 77% in the preceding 100 years. In each county women were in the majority.[5] Wrigley and Schofield estimate 8,664,000 based on birth and death records.[4]
- 1811 - 9,496,000
- 1821 - 11,158,000
- 1831 - 12,993,000
- 1841 - 14,866,000 (beginning of regular censuses)
- 1851 - 16,769,400
- 1861 - 18,776,300
- 1871 - 21,298,000
- 1881 - 24,402,700
- 1891 - 27,231,200
- 1901 - 30,515,000
- 1911 - 33,651,600
- 1921 - 35,230,200
- 1931 - 37,359,000
- 1951 - 41,042,200
- 1961 - 43,983,300
- 1971 - 45,870,100
- 1981 - 46,623,500
- 1991 - 48,067,300
- 2001 - 49,138,831[6]
- 2002 - 49,652,000[7]
- 2003 - 49,866,000[7]
- 2004 - 50,111,000[7]
- 2005 - 50,466,000[8]
- 2006 - 50,762,900[9]
- 2007 - 51,092,000[10]
- 2008 - 51,456,400[11]
Place of birth
Age
The data below is based on the 2001 census.[12] In 2001, the mean age of England's population was 38.60, and the median age was 37.00.
Ages attained
(years)Population % of total
population% per year
of age band0 - 4 2,926,238 5.96 1.19 5 - 7 1,838,668 3.74 1.25 8 - 9 1,283,861 2.61 1.31 10 - 14 3,229,047 6.57 1.32 15 623,767 1.27 1.27 16 - 17 1,231,266 2.51 1.25 18 - 19 1,177,571 2.40 1.20 20 - 24 2,952,719 6.01 1.20 25 - 29 3,268,660 6.65 1.33 30 - 44 11,127,511 22.65 1.51 45 - 59 9,279,693 18.88 1.26 60 - 64 2,391,830 4.87 0.97 65 - 74 4,102,841 8.35 0.84 75 - 84 2,751,135 5.60 0.56 85 - 89 637,701 1.30 0.26 90+ 316,323 0.64 - Life expectancy at birth[13]
- January 2001 - December 2003
- Males: 76.24 years
- Females: 80.72 years
- January 2002 - December 2004
- Males: 76.55 years
- Females: 80.91 years
- January 2003 - December 2005
- Males: 76.92 years
- Females: 81.14 years
Ethnicity
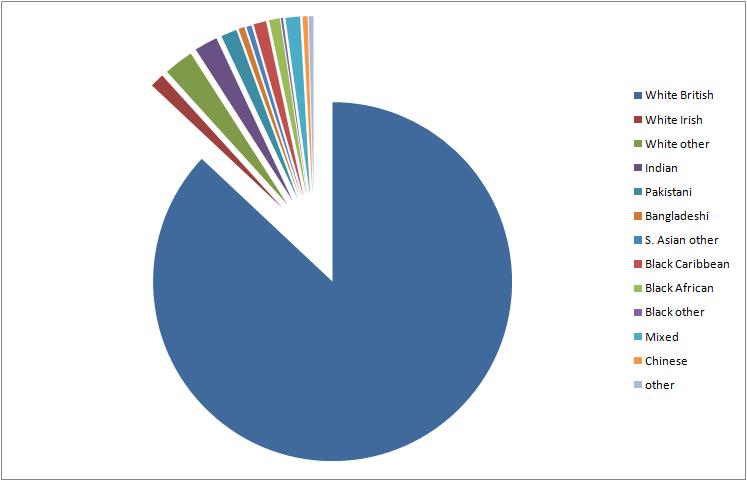
-
2001 ethnicity of the English population
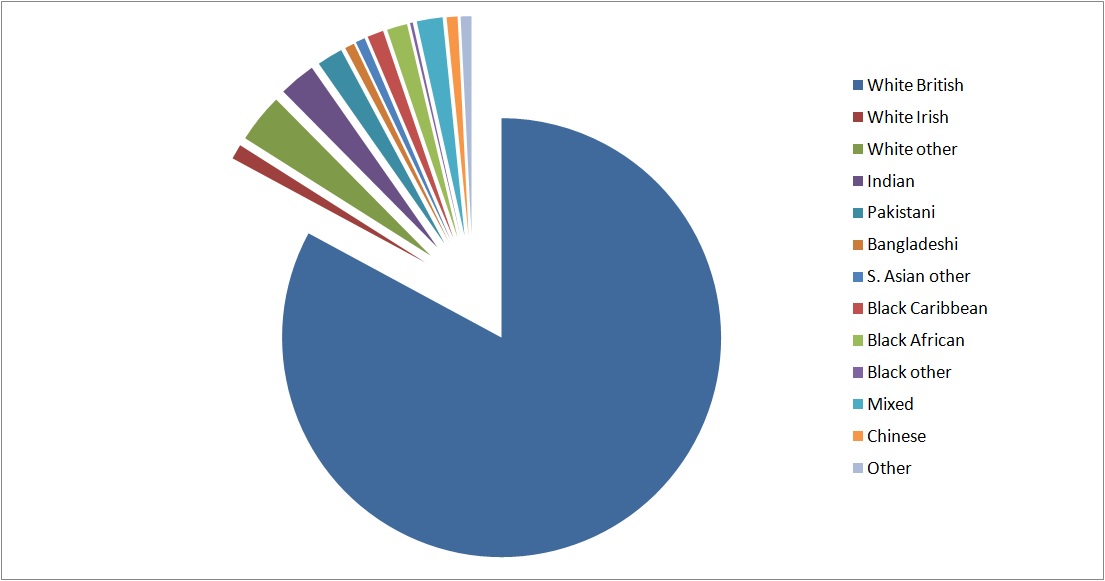
-

2009 ethnicity of the English population
The 2001 census and 2009 estimates state the following ethnic groups:
Ethnic group 2001 population 2001 percentage 2009 population 2009 percentage White: British 42,747,136 86.99% 42,893,400 82.8% White: Irish 624,115 1.27% 558,100 1.1% White: Other 1,308,110 2.66% 1,861,800 3.6% Asian or Asian British: Indian 1,028,546 2.09% 1,414,100 2.7% Asian or Asian British: Pakistani 706,539 1.44% 990,700 1.9% Asian or Asian British: Bangladeshi 275,394 0.56% 384,300 0.7% Asian or Asian British: Other South Asian 237,810 0.48% 377,700 0.7% Black or Black British: Caribbean 561,246 1.14% 609,400 1.2% Black or Black British: African 475,938 0.97% 787,500 1.5% Black or Black British: Other 95,324 0.19% 124,500 0.2% Mixed 643,373 1.31% 956,700 1.9% Chinese or Other: Chinese 220,681 0.45% 439,500 0.8% Chinese or Other: Other 214,619 0.44% 412,100 0.8% Total 49,138,831 100% 51,809,700 100% These groups are often combined into broader categories:
Ethnic group 2001 population 2001 percentage 2009 population 2009 percentage White 44,679,361 90.92% 45,313,300 87.5% Asian or Asian British 2,248,289 4.58% 3,166,800 6.0% Black or Black British 1,132,508 2.30% 1,521,400 2.9% Mixed 643,373 1.31% 956,700 1.9% Chinese 220,681 0.45% 439,500 0.8% Other 214,619 0.44% 412,100 0.8% - Source: KS06 Ethnic group: Census 2001, Key Statistics for local Authorities and KS06 Ethnic group: Estimates 2009.
Religion
Main article: Religion in England- Christian: 71.75%
- No religion: 14.81%[14]
- Not stated: 15%
- Muslim: 2.97%
- Hindu: 1.06%
- Sikh: 0.63%
- Jewish: 0.5%
- Other: 0.29%
- Buddhist: 0.28%
- Source: UK census - Table KS07 Religion.
See also
- Demographics of the United Kingdom
- United Kingdom Census 2011
- National Statistics Socio-economic Classification
- Census 2001 Ethnic Codes
- Ethnic groups in the United Kingdom
Lists:
- Lists of U.K. locations with large ethnic populations
- List of English districts by population
- List of urban areas in England by population
- List of towns and cities in England by historical population
Notes
- ^ Estimates for 1541-1751 have been rounded to the nearest thousand
References
- ^ "National Statistics Online - Live births". Statistics.gov.uk. http://www.statistics.gov.uk/cci/nugget.asp?id=369. Retrieved 2010-07-09.
- ^ a b John Hatcher and Mark Bailey, Modelling the Middle Ages, Oxford University press, 2001, pg. 29
- ^ Stuart James Borsch, The Black Death in Egypt and England: a comparative study, University of Texas Press, 2005.
- ^ a b c d e f Wrigley and Schofield, "The Population History of England, 1541-1871. A reconstruction.", Harvard University Press, 1981, Table 7.8, pgs. 208-9, [1]
- ^ Notes for 1801 taken from Kent 1800-1899 - A Chronicle of the Nineteenth Century Bob Ogley (Froglets Publications 2003) ISBN 1-872337-51-1
- ^ National Statistics, 2001 Census
- ^ a b c http://www.statistics.gov.uk/downloads/theme_population/Population_trends_132.pdf
- ^ National Statistics, UK population grows to more than 60m (2006-08-24)
- ^ "National Statistics Online - Population Estimates". Statistics.gov.uk. http://www.statistics.gov.uk/CCI/nugget.asp?ID=6. Retrieved 2010-07-09.
- ^ "National Statistics Online - Product". Statistics.gov.uk. http://www.statistics.gov.uk/statbase/Product.asp?vlnk=15106. Retrieved 2010-07-09.
- ^ http://www.statistics.gov.uk/downloads/theme_population/Current_QPEs_June95_Dec08.xls
- ^ Neighbourhood Statistics. "Age of English people in 2001". Neighbourhood.statistics.gov.uk. http://neighbourhood.statistics.gov.uk/dissemination/LeadTableView.do?a=3&b=276743&c=London&d=13&e=13&g=325264&i=1001x1003x1004&m=0&r=1&s=1196700298808&enc=1&dsFamilyId=276. Retrieved 2010-07-09.
- ^ Neighbourhood Statistics. "Life Expectancy at Birth for City of London, London, England". Neighbourhood.statistics.gov.uk. http://neighbourhood.statistics.gov.uk/dissemination/LeadTableView.do?adminCompAndTimeId=20465%3A237&a=3&b=276743&c=London&d=13&r=1&e=13&f=20536&o=242&g=325264&i=1001x1003x1004x1005&l=937&m=0&s=1196701459981&enc=1. Retrieved 2010-07-09.
- ^ Respondents who gave their religion as "Jedi" were counted in the "No Religion" category. Source: "Christianity is main religion in Britain". National Statistics. 2004-10-11. http://www.statistics.gov.uk/CCI/nugget.asp?ID=954&Pos=1&ColRank=2&Rank=224. Retrieved 2006-11-27. "No religion includes people who ticked 'None' at the religion question plus those who wrote in Jedi Knight, Agnostic, Atheist and Heathen and those who ticked 'Other' but did not write in any religion."
External links
- National Statistics
- Populstat population figure site - main source for 1801-1991
- Genealogical documents
- England map by county population
Demographics of Europe Sovereign
states- Albania
- Andorra
- Armenia
- Austria
- Azerbaijan
- Belarus
- Belgium
- Bosnia and Herzegovina
- Bulgaria
- Croatia
- Cyprus
- Czech Republic
- Denmark
- Estonia
- Finland
- France
- Georgia
- Germany
- Greece
- Hungary
- Iceland
- Ireland
- Italy
- Kazakhstan
- Latvia
- Liechtenstein
- Lithuania
- Luxembourg
- Macedonia
- Malta
- Moldova
- Monaco
- Montenegro
- Netherlands
- Norway
- Poland
- Portugal
- Romania
- Russia
- San Marino
- Serbia
- Slovakia
- Slovenia
- Spain
- Sweden
- Switzerland
- Turkey
- Ukraine
- United Kingdom
- (England
- Northern Ireland
- Scotland
- Wales)
- Vatican City
States with limited
recognition- Abkhazia
- Kosovo
- Nagorno-Karabakh
- Northern Cyprus
- South Ossetia
- Transnistria
Dependencies
and other territories- Åland
- Faroe Islands
- Gibraltar
- Guernsey
- Jan Mayen
- Jersey
- Isle of Man
- Svalbard
Other entities - European Union
Categories:- 2001 in England
- Demographics of England
- Ethnic groups in the United Kingdom
- History of England
- United Kingdom Census 2001
Wikimedia Foundation. 2010.