- Weather forecasting
-
"weather forecaster" redirects here. For other uses, see Weatherman (disambiguation).
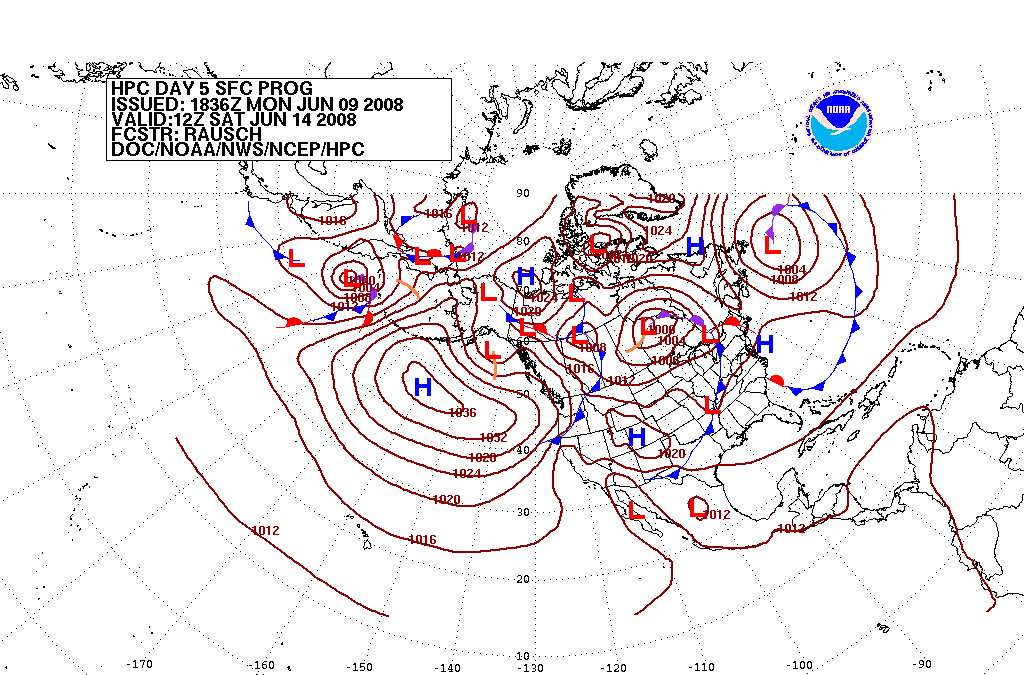
 Forecast of surface pressures five days into the future for the north Pacific, North America, and north Atlantic ocean.
Weather forecasting is the application of science and technology to predict the state of the atmosphere for a given location. Human beings have attempted to predict the weather informally for millennia, and formally since the nineteenth century. Weather forecasts are made by collecting quantitative data about the current state of the atmosphere and using scientific understanding of atmospheric processes to project how the atmosphere will evolve.
Once an all-human endeavor based mainly upon changes in barometric pressure, current weather conditions, and sky condition, weather forecasting now relies on computer-based models that take many atmospheric factors into account. Human input is still required to pick the best possible forecast model to base the forecast upon, which involves pattern recognition skills, teleconnections, knowledge of model performance, and knowledge of model biases. The chaotic nature of the atmosphere, the massive computational power required to solve the equations that describe the atmosphere, error involved in measuring the initial conditions, and an incomplete understanding of atmospheric processes mean that forecasts become less accurate as the difference in current time and the time for which the forecast is being made (the range of the forecast) increases. The use of ensembles and model consensus help narrow the error and pick the most likely outcome.
There are a variety of end uses to weather forecasts. Weather warnings are important forecasts because they are used to protect life and property. Forecasts based on temperature and precipitation are important to agriculture, and therefore to traders within commodity markets. Temperature forecasts are used by utility companies to estimate demand over coming days. On an everyday basis, people use weather forecasts to determine what to wear on a given day. Since outdoor activities are severely curtailed by heavy rain, snow and the wind chill, forecasts can be used to plan activities around these events, and to plan ahead and survive them.
Contents
History
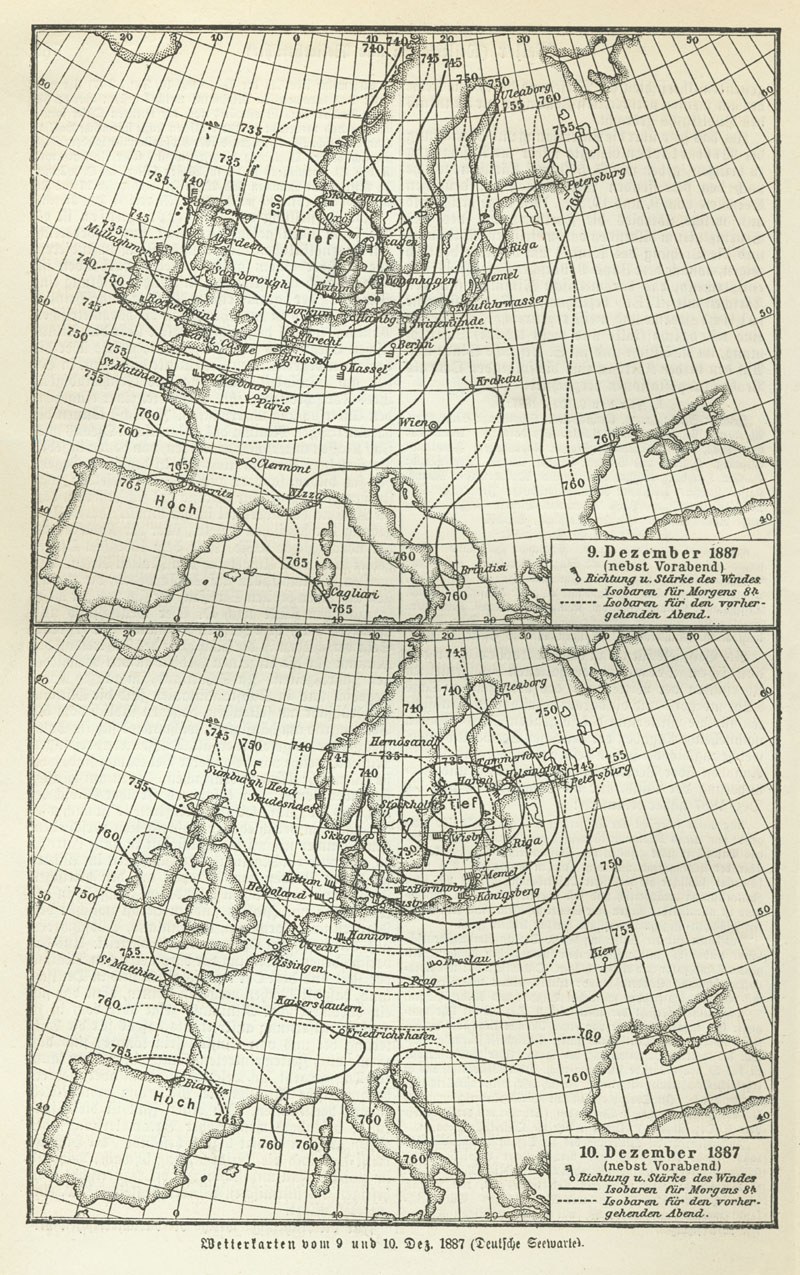
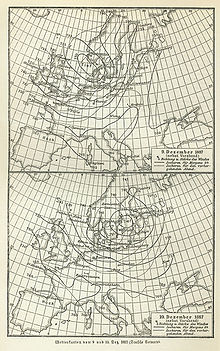 Weather map of Europe, 10 December 1887
For millennia people have tried to forecast the weather. In 650 BC, the Babylonians predicted the weather from cloud patterns as well as astrology.[1] In about 340 BC, Aristotle described weather patterns in Meteorologica.[2] Later, Theophrastus compiled a book on weather forecasting, called the Book of Signs.[3] Chinese weather prediction lore extends at least as far back as 300 BC,[4] which was also around the same time ancient Indian astronomers developed weather-prediction methods.[5] In 904 AD, Ibn Wahshiyya's Nabatean Agriculture discussed the weather forecasting of atmospheric changes and signs from the planetary astral alterations; signs of rain based on observation of the lunar phases; and weather forecasts based on the movement of winds.[6]
Ancient weather forecasting methods usually relied on observed patterns of events, also termed pattern recognition. For example, it might be observed that if the sunset was particularly red, the following day often brought fair weather. This experience accumulated over the generations to produce weather lore. However, not all of these predictions prove reliable, and many of them have since been found not to stand up to rigorous statistical testing.[7]
It was not until the invention of the electric telegraph in 1835 that the modern age of weather forecasting began.[8] Before this time, it was not widely practicable to transport information about the current state of the weather any faster than a steam train (and the train also was a very new technology at that time). By the late 1840s, the telegraph allowed reports of weather conditions from a wide area to be received almost instantaneously,[9] allowing forecasts to be made from knowledge of weather conditions further upwind. The two men most credited with the birth of forecasting as a science were Francis Beaufort (remembered chiefly for the Beaufort scale) and his protégé Robert Fitzroy (developer of the Fitzroy barometer). Both were influential men in British naval and governmental circles, and though ridiculed in the press at the time, their work gained scientific credence, was accepted by the Royal Navy, and formed the basis for all of today's weather forecasting knowledge.[10] To convey information accurately, it became necessary to have a standard vocabulary describing clouds; this was achieved by means of a series of classifications and, in the 1890s, by pictorial cloud atlases.
Great progress was made in the science of meteorology during the 20th century. The possibility of numerical weather prediction was proposed by Lewis Fry Richardson in 1922,[11] though computers did not exist to complete the vast number of calculations required to produce a forecast before the event had occurred. The first computerised weather forecast was performed by a team led by the mathematician John von Neumann; von Neumann publishing the paper Numerical Integration of the Barotropic Vorticity Equation in 1950.[12] Practical use of numerical weather prediction began in 1955,[13] spurred by the development of programmable electronic computers.
In the United States, the first public radio forecasts were made in 1925 by Edward B. "E.B." Rideout, on WEEI, the Edison Electric Illuminating station in Boston.[14] Rideout came from the U.S. Weather Bureau, as did WBZ weather forecaster G. Harold Noyes in 1931. Television forecasts followed with Jimmie Fidler in Cincinnati in 1940 or 1947 on the DuMont Television Network.[14][15] The Weather Channel is a 24-hour cable network that began broadcasting in May 1982.
How models create forecasts
 An example of 500 mbar geopotential height prediction from a numerical weather prediction modelMain article: Numerical weather prediction
The basic idea of numerical weather prediction is to sample the state of the fluid at a given time and use the equations of fluid dynamics and thermodynamics to estimate the state of the fluid at some time in the future. The main inputs from country-based weather services are surface observations from automated weather stations at ground level over land and from weather buoys at sea. The World Meteorological Organization acts to standardize the instrumentation, observing practices and timing of these observations worldwide. Stations either report hourly in METAR reports,[16] or every six hours in SYNOP reports.[17] Sites launch radiosondes, which rise through the depth of the troposphere and well into the stratosphere.[18] Data from weather satellites are used in areas of where traditional data sources are not available.[19][20][21] Compared with similar data from radiosondes, the satellite data has the advantage of global coverage, however at a lower accuracy and resolution.[22] Meteorological radar provide information on precipitation location and intensity, which can be used to estimate precipitation accumulations over time.[23] Additionally, if a Pulse Doppler weather radar is used then wind speed and direction can be determined.[24]
 Modern weather predictions aid in timely evacuations and potentially save lives and property damage
Commerce provides pilot reports along aircraft routes,[25] and ship reports along shipping routes. Research flights using reconnaissance aircraft fly in and around weather systems of interest such as tropical cyclones.[26][27] Reconnaissance aircraft are also flown over the open oceans during the cold season into systems which cause significant uncertainty in forecast guidance, or are expected to be of high impact 3–7 days into the future over the downstream continent.[28]
Models are initialized using this observed data. The irregularly spaced observations are processed by data assimilation and objective analysis methods, which perform quality control and obtain values at locations usable by the model's mathematical algorithms (usually an evenly spaced grid). The data are then used in the model as the starting point for a forecast.[29] Commonly, the set of equations used to predict the known as the physics and dynamics of the atmosphere are called primitive equations. These equations are initialized from the analysis data and rates of change are determined. The rates of change predict the state of the atmosphere a short time into the future. The equations are then applied to this new atmospheric state to find new rates of change, and these new rates of change predict the atmosphere at a yet further time into the future. This time stepping procedure is continually repeated until the solution reaches the desired forecast time. The length of the time step is related to the distance between the points on the computational grid. Time steps for global climate models may be on the order of tens of minutes, while time steps for regional models may be a few seconds to a few minutes.
Essentially, a model is a computer program that produces meteorological information for future times at given locations and altitudes. Within any modern model is a set of equations, known as the primitive equations, used to predict the future state of the atmosphere.[30] These equations—along with the ideal gas law—are used to evolve the density, pressure, and potential temperature scalar fields and the velocity vector field of the atmosphere through time. Additional transport equations for pollutants and other aerosols are included in some primitive-equation mesoscale models as well.[31] The equations used are nonlinear partial differential equations which are impossible to solve exactly through analytical methods,[32] with the exception of a few idealized cases.[33] Therefore, numerical methods obtain approximate solutions. Different models use different solution methods: some global models use spectral methods for the horizontal dimensions and finite difference methods for the vertical dimension, while regional models and other global models usually use finite-difference methods in all three dimensions.[32]
These equations are initialized from the analysis data and rates of change are determined. These rates of change predict the state of the atmosphere a short time into the future; the time increment for this prediction is called a time step. The equations are then applied to this new atmospheric state to find new rates of change, and these new rates of change predict the atmosphere at a yet further time step into the future. This time stepping is repeated until the solution reaches the desired forecast time. The length of the time step chosen within the model is related to the distance between the points on the computational grid, and is chosen to maintain numerical stability.[34] Time steps for global models are on the order of tens of minutes,[35] while time steps for regional models are between one and four minutes.[36] The global models are run at varying times into the future. The UKMET Unified Model is run six days into the future,[37] the European Centre for Medium-Range Weather Forecasts model is run out to 10 days into the future,[38] while the Global Forecast System model run by the Environmental Modeling Center is run 16 days into the future.[39] The visual output produced by a model solution is known as a prognostic chart, or prog.[40] The raw output is often modified before being presented as the forecast. This can be in the form of statistical techniques to remove known biases in the model, or of adjustment to take into account consensus among other numerical weather forecasts.[41] MOS or model output statistics is a technique used to interpret numerical model output and produce site-specific guidance. This guidance is presented in coded numerical form, and can be obtained for nearly all National Weather Service reporting stations in the United States. As proposed by Edward Lorenz in 1963, long range forecasts, those made at a range of two weeks or more, are impossible to definitively predict the state of the atmosphere, owing to the chaotic nature of the fluid dynamics equations involved. Extremely small errors in the initial input, such as temperatures and winds, within numerical models doubles every five days.[42]
Techniques
Persistence
The simplest method of forecasting the weather, persistence, relies upon today's conditions to forecast the conditions tomorrow. This can be a valid way of forecasting the weather when it is steady state, such as during the summer season in the tropics. This method of forecasting strongly depends upon the presence of a stagnant weather pattern. It can be useful in both short range forecasts and long range forecasts.[43]
Use of a barometer
Measurements of barometric pressure and the pressure tendency (the change of pressure over time) have been used in forecasting since the late 19th century.[44] The larger the change in pressure, especially if more than 3.5 hPa (2.6 mmHg), the larger the change in weather can be expected. If the pressure drop is rapid, a low pressure system is approaching, and there is a greater chance of rain. Rapid pressure rises are associated with improving weather conditions, such as clearing skies.[45]
Looking at the sky
 Marestail shows moisture at high altitude, signalling the later arrival of wet weather.
Along with pressure tendency, the condition of the sky is one of the more important parameters used to forecast weather in mountainous areas. Thickening of cloud cover or the invasion of a higher cloud deck is indicative of rain in the near future. At night, high thin cirrostratus clouds can lead to halos around the moon, which indicates an approach of a warm front and its associated rain.[46] Morning fog portends fair conditions, as rainy conditions are preceded by wind or clouds which prevent fog formation. The approach of a line of thunderstorms could indicate the approach of a cold front. Cloud-free skies are indicative of fair weather for the near future.[47] A bar can indicate a coming tropical cyclone. The use of sky cover in weather prediction has led to various weather lore over the centuries.[48]
Nowcasting
The term nowcasting is also used in economics.
The forecasting of the weather within the next six hours is often referred to as nowcasting.[49] In this time range it is possible to forecast smaller features such as individual showers and thunderstorms with reasonable accuracy, as well as other features too small to be resolved by a computer model. A human given the latest radar, satellite and observational data will be able to make a better analysis of the small scale features present and so will be able to make a more accurate forecast for the following few hours.[50]
Use of forecast models
 An example of 500 mbar geopotential height prediction from a numerical weather prediction model
In the past, the human forecaster was responsible for generating the entire weather forecast based upon available observations.[51] Today, human input is generally confined to choosing a model based on various parameters, such as model biases and performance.[52] Using a consensus of forecast models, as well as ensemble members of the various models, can help reduce forecast error.[53] However, regardless how small the average error becomes with any individual system, large errors within any particular piece of guidance are still possible on any given model run.[54] Humans are required to interpret the model data into weather forecasts that are understandable to the end user. Humans can use knowledge of local effects which may be too small in size to be resolved by the model to add information to the forecast. While increasing accuracy of forecast models implies that humans may no longer be needed in the forecast process at some point in the future, there is currently still a need for human intervention.[55]
Analog technique
The Analog technique is a complex way of making a forecast, requiring the forecaster to remember a previous weather event which is expected to be mimicked by an upcoming event. What makes it a difficult technique to use is that there is rarely a perfect analog for an event in the future.[56] Some call this type of forecasting pattern recognition. It remains a useful method of observing rainfall over data voids such as oceans,[57] as well as the forecasting of precipitation amounts and distribution in the future. A similar technique is used in medium range forecasting, which is known as teleconnections, when systems in other locations are used to help pin down the location of another system within the surrounding regime.[58] An example of teleconnections are by using El Niño-Southern Oscillation (ENSO) related phenomena.[59]
- Analog model – A model based on similarities between the system under study and another system or process.
- Analytical model – A model that uses classic methods such as calculus or algebra to solve a series of equations.
- Conceptual model – A simplified representation of the system being examined.
- Continuous model – A model that uses continuous simulation, as opposed to a single-event model.
- Deterministic model – A model that produces the same output for a given input without consideration for risk or uncertainty.
- Empirical model – A model represented by simplified processes based on observation, measurements, or practical experience rather than solely on principles or theory. A lumped model is an example.
- Explicit model – A numerical model that uses parameter values or unknown variables at the beginning of a time step in the computational algorithms.
- Implicit model – A numerical model that uses parameter values or unknown variables at the end of a time step in the computational algorithms.
- Mass balance model – A model based on the conservation of mass and focuses on balancing inputs and outputs from the model area. Also known as a zero-dimensional model.
- Numerical model – A model that uses a numerical method to solve a series of equations, as opposed to an analytical model. The results from numerical models are often approximations, while analytic models produce exact solutions.
- One-dimensional model – A model that includes only one space dimension.
- Pseudo-deterministic model – A semi-distributed model.
- Stochastic mathematical model – A model that includes statistical elements and produces a set of outputs for a given set of inputs. The output represents a set of expected values.
- Two-dimensional model – A model that includes two space dimensions, usually horizontal and vertical averaging.
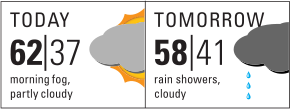 An example of a two-day weather forecast in the visual style that an American newspaper might use. Temperatures are given in Fahrenheit.
Most end users of forecasts are members of the general public. Thunderstorms can create strong winds and dangerous lightning strikes that can lead to deaths, power outages,[60] and widespread hail damage. Heavy snow or rain can bring transportation and commerce to a stand-still,[61] as well as cause flooding in low-lying areas.[62] Excessive heat or cold waves can sicken or kill those with inadequate utilities, and droughts can impact water usage and destroy vegetation.
Several countries employ government agencies to provide forecasts and watches/warnings/advisories to the public in order to protect life and property and maintain commercial interests. Knowledge of what the end user needs from a weather forecast must be taken into account to present the information in a useful and understandable way. Examples include the National Oceanic and Atmospheric Administration's National Weather Service (NWS)[63] and Environment Canada's Meteorological Service (MSC).[64] Traditionally, newspaper, television, and radio have been the primary outlets for presenting weather forecast information to the public. Increasingly, the internet is being used due to the vast amount of specific information that can be found.[65] In all cases, these outlets update their forecasts on a regular basis.
Public uses
Severe weather alerts and advisories
A major part of modern weather forecasting is the severe weather alerts and advisories which the national weather services issue in the case that severe or hazardous weather is expected. This is done to protect life and property.[66] Some of the most commonly known of severe weather advisories are the severe thunderstorm and tornado warning, as well as the severe thunderstorm and tornado watch. Other forms of these advisories include winter weather, high wind, flood, tropical cyclone, and fog.[67] Severe weather advisories and alerts are broadcast through the media, including radio, using emergency systems as the Emergency Alert System which break into regular programming.[68]
Air traffic
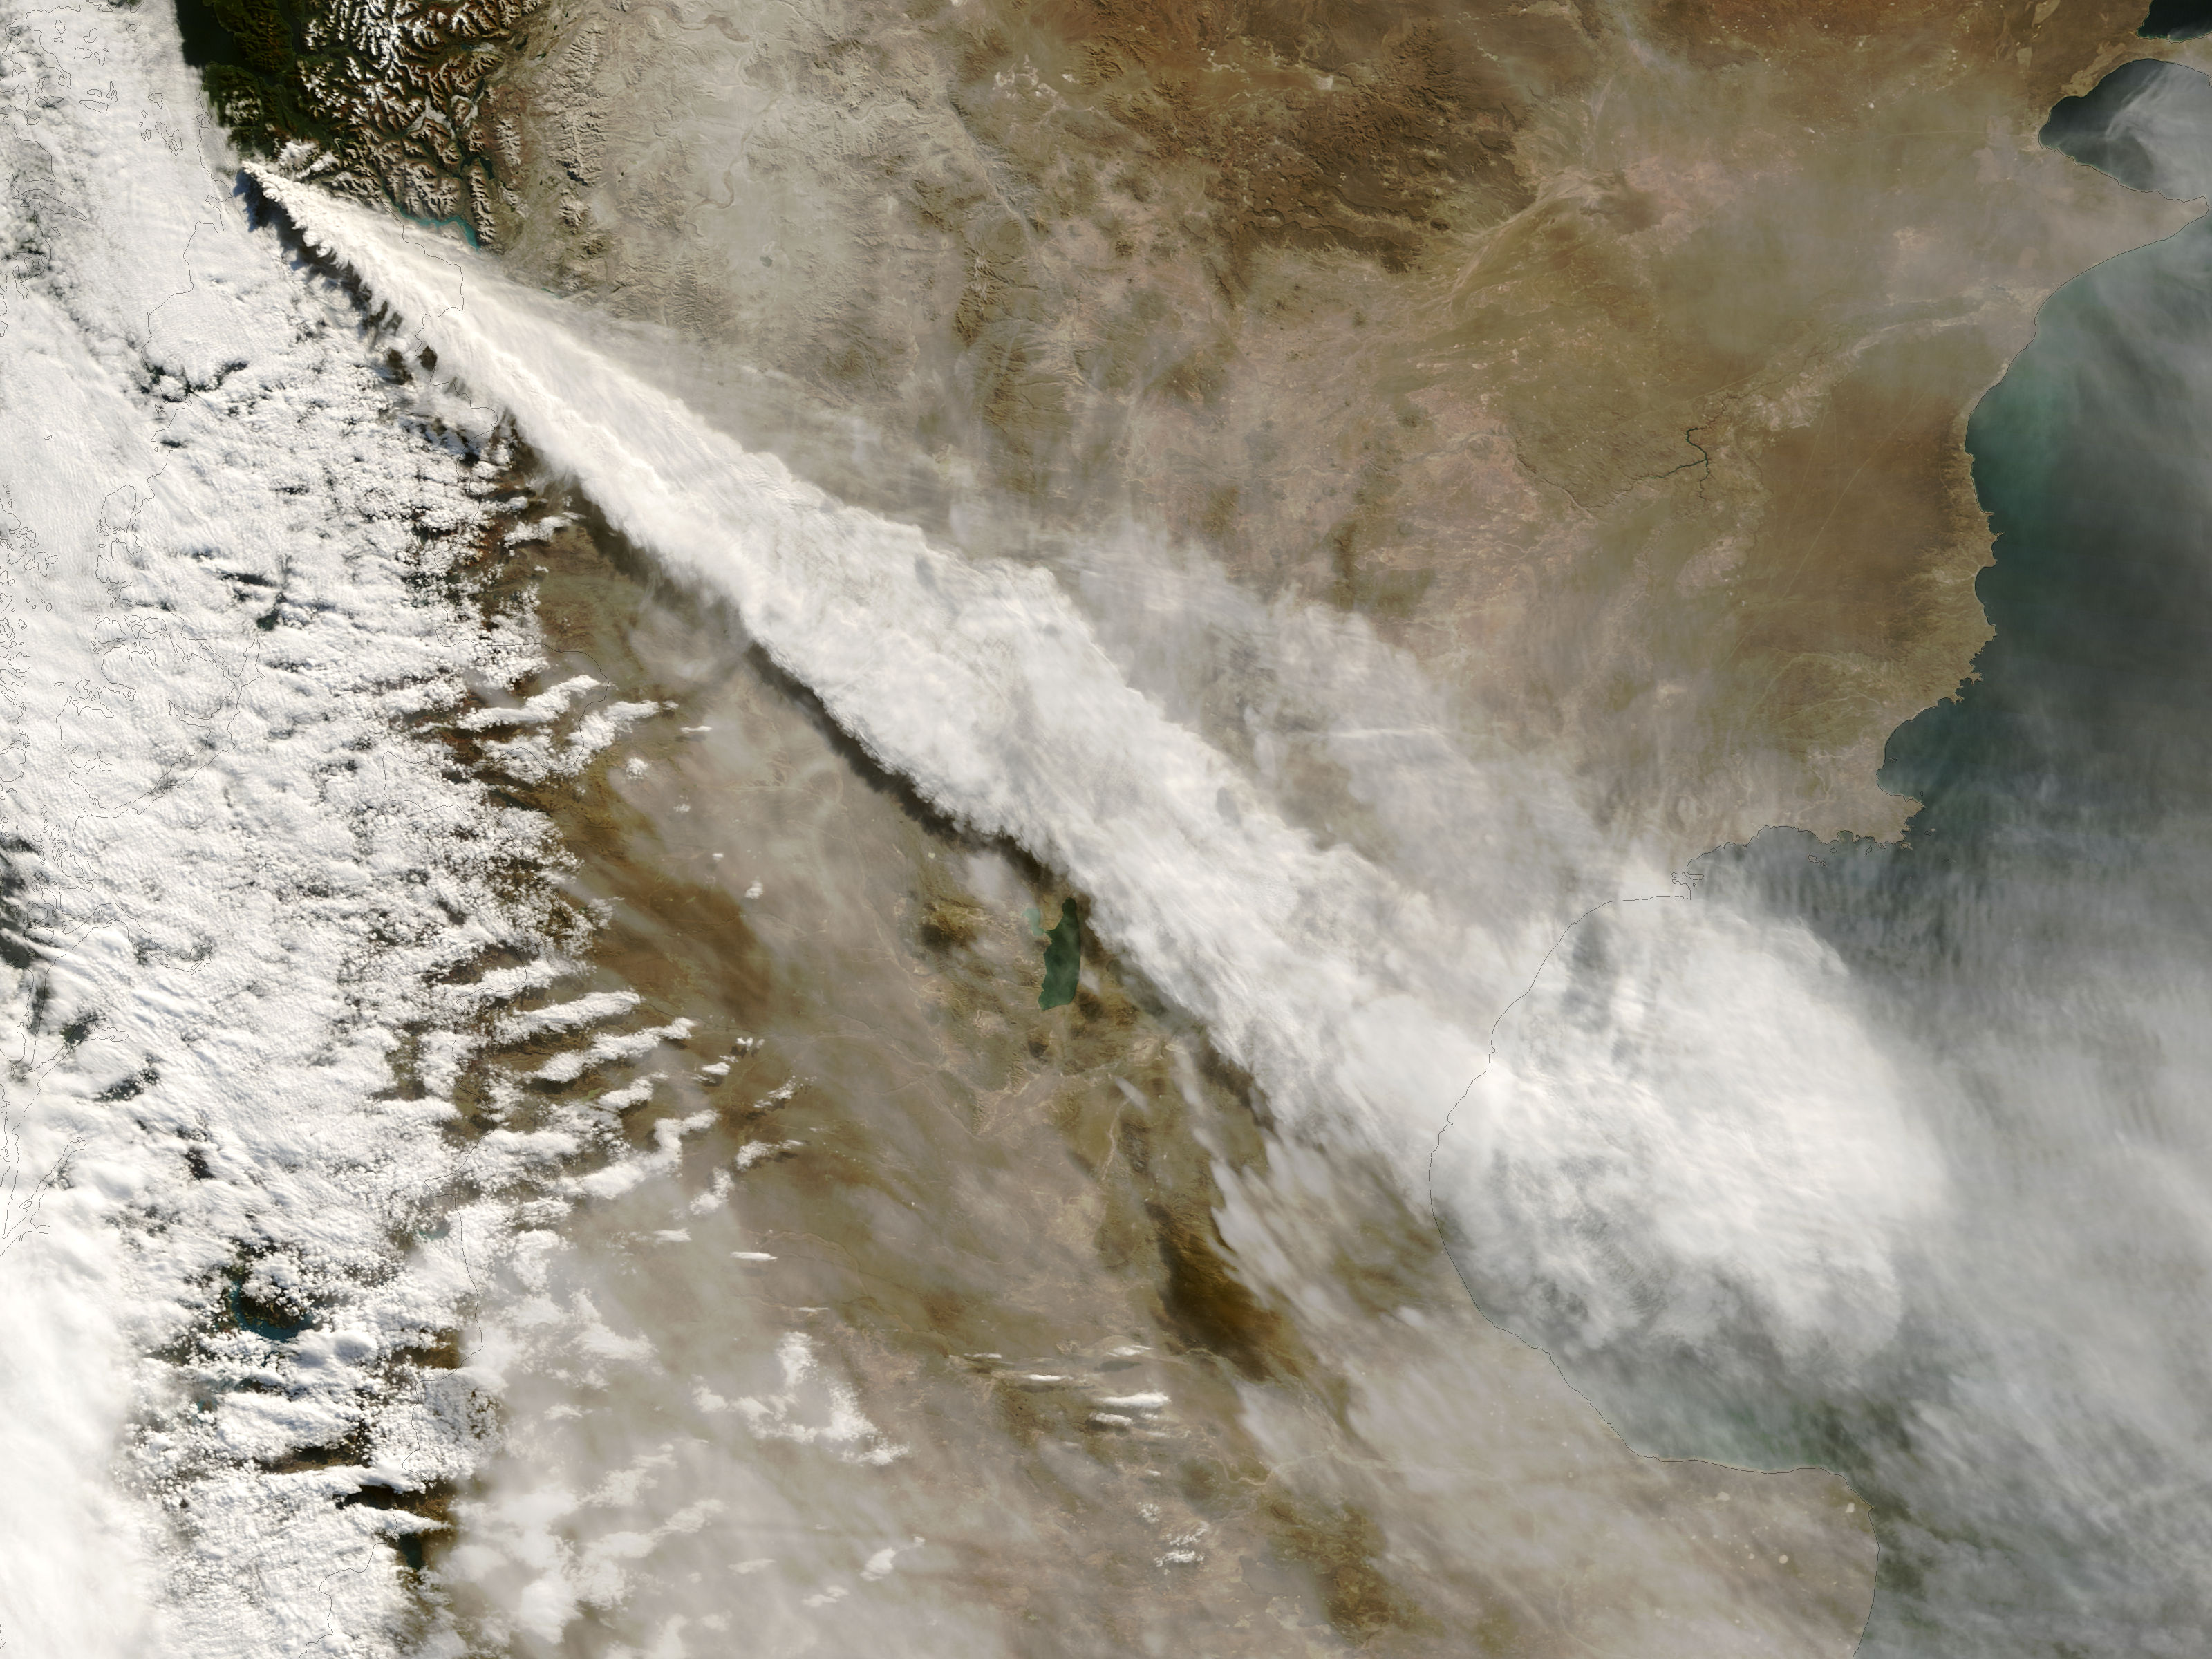
 Ash cloud from the 2008 eruption of Chaitén volcano stretching across Patagonia from the Pacific to the Atlantic OceanSee also: Terminal Aerodrome Forecast
Because the aviation industry is especially sensitive to the weather, accurate weather forecasting is essential. Fog or exceptionally low ceilings can prevent many aircraft from landing and taking off.[69] Turbulence and icing are also significant in-flight hazards.[70] Thunderstorms are a problem for all aircraft because of severe turbulence due to their updrafts and outflow boundaries,[71] icing due to the heavy precipitation, as well as large hail, strong winds, and lightning, all of which can cause severe damage to an aircraft in flight.[72] Volcanic ash is also a significant problem for aviation, as aircraft can lose engine power within ash clouds.[73] On a day to day basis airliners are routed to take advantage of the jet stream tailwind to improve fuel efficiency.[74] Aircrews are briefed prior to takeoff on the conditions to expect en route and at their destination.[75] Additionally, airports often change which runway is being used to take advantage of a headwind. This reduces the distance required for takeoff, and eliminates potential crosswinds.[76]
Marine
Commercial and recreational use of waterways can be limited significantly by wind direction and speed, wave periodicity and heights, tides, and precipitation. These factors can each influence the safety of marine transit. Consequently, a variety of codes have been established to efficiently transmit detailed marine weather forecasts to vessel pilots via radio, for example the MAFOR (marine forecast).[77] Typical weather forecasts can be received at sea through the use of RTTY, Navtex and Radiofax.
Agriculture
Farmers rely on weather forecasts to decide what work to do on any particular day. For example, drying hay is only feasible in dry weather. Prolonged periods of dryness can ruin cotton, wheat,[78] and corn crops. While corn crops can be ruined by drought, their dried remains can be used as a cattle feed substitute in the form of silage.[79] Frosts and freezes play havoc with crops both during the spring and fall. For example, peach trees in full bloom can have their potential peach crop decimated by a spring freeze.[80] Orange groves can suffer significant damage during frosts and freezes, regardless of their timing.[81]
Forestry
Weather forecasting of wind, precipitations and humidity is essential for preventing and controlling wildfires. Different indices, like the Forest fire weather index and the Haines Index, have been developed to predict the areas more at risk to experience fire from natural or human causes. Conditions for the development of harmful insects can be predicted by forecasting the evolution of weather, too.
Utility companies
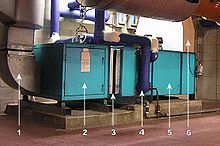 An air handling unit is used for the heating and cooling of air in a central location (click on image for legend).Main article: Degree day
Electricity and gas companies rely on weather forecasts to anticipate demand which can be strongly affected by the weather. They use the quantity termed the degree day to determine how strong of a use there will be for heating (heating degree day) or cooling (cooling degree day). These quantities are based on a daily average temperature of 65 °F (18 °C). Cooler temperatures force heating degree days (one per degree Fahrenheit), while warmer temperatures force cooling degree days.[82] In winter, severe cold weather can cause a surge in demand as people turn up their heating.[83] Similarly, in summer a surge in demand can be linked with the increased use of air conditioning systems in hot weather.[84] By anticipating a surge in demand, utility companies can purchase additional supplies of power or natural gas before the price increases, or in some circumstances, supplies are restricted through the use of brownouts and blackouts.[85]
Private sector
Increasingly, private companies pay for weather forecasts tailored to their needs so that they can increase their profits or avoid large losses.[86] For example, supermarket chains may change the stocks on their shelves in anticipation of different consumer spending habits in different weather conditions. Weather forecasts can be used to invest in the commodity market, such as futures in oranges, corn, soybeans, and oil.[87]
Military applications
United States Armed Forces
 Emblem of JTWC Joint Typhoon Warning Center
Similarly to the private sector, military weather forecasters present weather conditions to the war fighter community. Military weather forecasters provide pre-flight and in-flight weather briefs to pilots and provide real time resource protection services for military installations. Naval forecasters cover the waters and ship weather forecasts. The United States Navy provides a special service to both themselves and the rest of the federal government by issuing forecasts for tropical cyclone across the Pacific and Indian Oceans through their Joint Typhoon Warning Center.[88]
US Air Force
Within the United States, Air Force Weather provides weather forecasting for the Air Force and the Army. Air Force forecasters cover air operations in both wartime and peacetime operations and provide Army support;[89] United States Coast Guard marine science technicians provide ship forecasts for ice breakers and other various operations within their realm;[90] and Marine forecasters provide support for ground- and air-based United States Marine Corps operations.[91] All four military branches take their initial enlisted meteorology technical training at Keesler Air Force Base.[92] Military and civilian forecasters actively cooperate in analyzing, creating and critiquing weather forecast products.
See also
References
- ^ Mistic House. Astrology Lessons, History, Prediction, Skeptics, and Astrology Compatibility. Retrieved on 2008-01-12.
- ^ Meteorology by Lisa Alter
- ^ Weather: Forecasting from the Beginning
- ^ University of California Museum of Paleontology. Aristotle (384-322 B.C.E.). Retrieved on 2008-01-12.
- ^ David Pingree. "THE INDIAN AND PSEUDO-INDIAN PASSAGES IN GREEK AND LATIN ASTRONOMICAL AND ASTROLOGICAL TEXTS". pp. 141–195 [143–4]. http://brepols.metapress.com/content/6861608670636388/fulltext.pdf. Retrieved 2010-03-01
- ^ Fahd, Toufic. "Botany and agriculture". p. 842, in Rashed, Roshdi; Morelon, Régis (1996). Encyclopedia of the History of Arabic Science. 3. Routledge. pp. 813–852. ISBN 0415124107
- ^ Jerry Wilson. Skywatch Signs of the Weather. Retrieved on 2007-04-15.
- ^ "Joseph Henry: Inventor of the Telegraph? Smithsonian Institution". Archived from the original on June 26, 2006. http://web.archive.org/web/20060626163000/http://www.si.edu/archives/ihd/jhp/joseph20.htm. Retrieved 2006-06-29.
- ^ Encyclopædia Britannica. Telegraph. Retrieved on 2007-05-05.
- ^ Eric D. Craft. An Economic History of Weather Forecasting. Retrieved on 2007-04-15.
- ^ Lynch, P. (2006). The Emergence of Numerical Weather Prediction. Cambridge U.P.
- ^ Charney, Fjörtoft and von Neumann, 1950, Numerical Integration of the Barotropic Vorticity Equation Tellus, 2, 237-254
- ^ Paul N. Edwards. Atmospheric General Circulation Modeling. Retrieved on 2007-02-16.
- ^ a b http://www.encyclopedia.com/doc/1G2-3401802621.html
- ^ "Answers: Understanding weather forecasts". USA Today. 2006-02-08. http://www.usatoday.com/weather/wforund.htm.
- ^ National Climatic Data Center. Key to METAR Surface Weather Observations. Retrieved on 2008-03-09.
- ^ UNISYS. SYNOP Data Format (FM-12): Surface Synoptic Observations. Retrieved on 2008-05-25.
- ^ Gaffen, Dian J. (2007-06-07). Radiosonde Observations and Their Use in SPARC-Related Investigations. Retrieved on 2008-05-25.
- ^ NASA. Interactive Global Composite Weather Satellite Images. Retrieved on 2008-05-25.
- ^ NOAA. Goes Eastern US Sector Infrared Image. Retrieved on 2008-05-25.
- ^ Met Office. Satellite applications. Retrieved on 2008-05-25.
- ^ Tony Reale. ATOVS Sounding Products (ITSVC-12). Retrieved on 2008-05-25.
- ^ Andrew Treloar and Peter Brookhouse. The use of accumulated rainfall maps from weather radar systems to assist wildfire detection reconnaissance. Retrieved on 2008-05-25.
- ^ University of Washington. An improving forecast. Retrieved on 2007-04-15.
- ^ Ballish, Bradley A. and V. Krishna Kumar (2008-05-23). Investigation of Systematic Differences in Aircraft and Radiosonde Temperatures with Implications for NWP and Climate Studies. Retrieved on 2008-05-25.
- ^ 403rd Wing (2011). "The Hurricane Hunters". 53rd Weather Reconnaissance Squadron. http://www.hurricanehunters.com. Retrieved 2006-03-30.
- ^ Lee, Christopher. "Drone, Sensors May Open Path Into Eye of Storm". The Washington Post. http://www.washingtonpost.com/wp-dyn/content/article/2007/10/07/AR2007100700971_pf.html. Retrieved 2008-02-22.
- ^ National Oceanic and Atmospheric Administration (2010-11-12). "NOAA Dispatches High-Tech Research Plane to Improve Winter Storm Forecasts". http://www.noaanews.noaa.gov/stories2010/20100112_plane.html. Retrieved 2010-12-22.
- ^ University Corporation for Atmospheric Research (2007-08-14). The WRF Variational Data Assimilation System (WRF-Var). Retrieved on 2008-05-25.
- ^ Pielke, Roger A. (2002). Mesoscale Meteorological Modeling. Academic Press. pp. 48–49. ISBN 0-12-554766-8.
- ^ Pielke, Roger A. (2002). Mesoscale Meteorological Modeling. Academic Press. pp. 18–19. ISBN 0-12-554766-8.
- ^ a b Strikwerda, John C. (2004). Finite difference schemes and partial differential equations. SIAM. pp. 165–170. ISBN 978-0-89871-567-5. http://books.google.com/?id=SH8R_flZBGIC&pg=PA165&lpg=PA165&dq=numerical+weather+prediction+partial+differential+equations+book#v=onepage&q=numerical%20weather%20prediction%20partial%20differential%20equations%20book&f=false. Retrieved 2010-12-31.
- ^ Pielke, Roger A. (2002). Mesoscale Meteorological Modeling. Academic Press. pp. 65. ISBN 0-12-554766-8.
- ^ Pielke, Roger A. (2002). Mesoscale Meteorological Modeling. Academic Press. pp. 285–287. ISBN 0-12-554766-8.
- ^ Sunderam, V. S.; van Albada, G. Dick; Peter, M. A.; Sloot, J. J. Dongarra (2005). Computational Science – ICCS 2005: 5th International Conference, Atlanta, GA, USA, May 22–25, 2005, Proceedings, Part 1. Springer. p. 132. ISBN 9783540260325. http://books.google.com/?id=JZikIbXzipwC&pg=PA131&lpg=PA131&dq=time+step+numerical+weather+prediction#v=onepage&q=time%20step%20numerical%20weather%20prediction&f=false. Retrieved 2011-01-02.
- ^ Zwieflhofer, Walter; Kreitz, Norbert; European Centre for Medium Range Weather Forecasts (2001). Developments in teracomputing: proceedings of the ninth ECMWF Workshop on the Use of High Performance Computing in Meteorology. World Scientific. p. 276. ISBN 9789810247614. http://books.google.com/?id=UV6PnF2z5_wC&pg=PA276&dq=time+step+WRF+weather#v=onepage&q=time%20step%20WRF%20weather&f=false. Retrieved 2011-01-02.
- ^ Chan, Johnny C. L. and Jeffrey D. Kepert (2010). Global Perspectives on Tropical Cyclones: From Science to Mitigation. World Scientific. pp. 295–296. ISBN 9789814293471. http://books.google.com/?id=6gFiunmKWWAC&pg=PA297&dq=hours+time+used+to+run+ECMWF+model#v=onepage&q=hours%20time%20used%20to%20run%20ECMWF%20model&f=false. Retrieved 2011-02-24.
- ^ Holton, James R. (2004). An introduction to dynamic meteorology, Volume 1. Academic Press. p. 480. ISBN 9780123540157. http://books.google.com/?id=fhW5oDv3EPsC&pg=PA474&dq=time+used+to+run+ECMWF+model#v=onepage&q&f=false. Retrieved 2011-02-24.
- ^ Brown, Molly E. (2008). Famine early warning systems and remote sensing data. Springer. p. 121. ISBN 9783540753674. http://books.google.com/?id=mTZvR3R6YdkC&pg=PA121&dq=how+long+does+it+take+to+run+the+GFS+global+weather+model+book#v=onepage&q&f=false. Retrieved 2011-02-24.
- ^ Ahrens, C. Donald (2008). Essentials of meteorology: an invitation to the atmosphere. Cengage Learning. p. 244. ISBN 978-0-495-11558-8. http://books.google.com/?id=2Yn29IFukbgC&pg=PA244&lpg=PA244&dq=regional+weather+forecast+model+characteristics+book#v=onepage&q&f=false. Retrieved 2011-02-11.
- ^ Daniel Andersson. Improved accuracy of surrogate models using output postprocessing. Retrieved on 2008-05-25.
- ^ Cox, John D. (2002). Storm Watchers. John Wiley & Sons, Inc.. pp. 222–224. ISBN 047138108X.
- ^ University of Illinois at Urbana-Champaign. Persistence Forecasting: Today equals Tomorrow. Retrieved on 2007-02-16.
- ^ USA Today. Understanding air pressure. Retrieved on 2008-05-25.
- ^ Weather Doctor. Applying The Barometer To Weather Watching. Retrieved on 2008-05-25.
- ^ Dennis Eskow (March 1983). "Make Your Own Weather Forecasts". Popular Mechanics 159 (3): 148. http://books.google.com/books?id=KtkDAAAAMBAJ&pg=PA148&dq=halo+use+in+weather+forecasting+book&hl=en&ei=1qmXTdWELoTqgQeB4djQCA&sa=X&oi=book_result&ct=result&resnum=3&ved=0CDYQ6AEwAg#v=onepage&q=halo%20use%20in%20weather%20forecasting%20book&f=false. Retrieved 2011-04-02.
- ^ Mark Moore. Field Forecasting - A Short Summary. Retrieved on 2008-05-25.
- ^ Jerry Wilson. Skywatch: Signs of the Weather. Retrieved on 2008-05-25.
- ^ Glossary of Meteorology. Nowcast. Retrieved on 2008-05-25.
- ^ E-notes.com. Weather and Climate | What Is Nowcasting? Retrieved on 2011-09-08.
- ^ NASA. Weather Forecasting Through the Ages. Retrieved on 2008-05-25.
- ^ Klaus Weickmann, Jeff Whitaker, Andres Roubicek and Catherine Smith (2001-12-01). The Use of Ensemble Forecasts to Produce Improved Medium Range (3-15 days) Weather Forecasts. Climate Diagnostics Center. Retrieved on 2007-02-16.
- ^ Todd Kimberlain. Tropical cyclone motion and intensity talk (June 2007). Retrieved on 2007-07-21.
- ^ Richard J. Pasch, Mike Fiorino, and Chris Landsea. TPC/NHC’S Review of the NCEP Production Suite for 2006. Retrieved on 2008-05-05.
- ^ Roebber P. J. and Bosart L. F. The complex relationship between forecast skill and forecast value : A real-world analysis. Retrieved on 2008-05-25.
- ^ Other Forecasting Methods: climatology, analogue and numerical weather prediction. Retrieved on 2006-02-16.
- ^ Kenneth C. Allen. Pattern Recognition Techniques Applied to the NASA-ACTS Order-Wire Problem. Retrieved on 2007-02-16.
- ^ Weather Associates, Inc. The Role of Teleconnections & Ensemble Forecasting in Extended- to Medium-Range Forecasting. Retrieved on 2007-02-16.
- ^ Thinkquest.org. Teleconnections: Linking El Niño with Other Places. Retrieved on 2007-02-16.
- ^ University of Illinois at Urbana-Champaign. Lightning. Retrieved on 2007-02-16.
- ^ Associated Press. Upstate N.Y. residents dig out from heavy snow. Retrieved on 2008-05-25.
- ^ National Flood Insurance Program. Flood Risk Scenarios: Flash Flood. Retrieved on 2008-05-25.
- ^ National Weather Service. About NOAA's National Weather Service. Retrieved on 2007-02-16.
- ^ Environment Canada. Main website. Retrieved on 2007-02-16.
- ^ Canadian Heritage. Primary Sources of Local Information. Retrieved on 2008-05-26.
- ^ National Weather Service. National Weather Service Mission Statement. Retrieved on 2008-05-25.
- ^ Environment Canada. Canadian Weather Alerts. Retrieved on 2008-05-26.
- ^ Federal Communications Commission. Emergency Alert System. Retrieved on 2008-05-26.
- ^ Government Printing Office. Title 14: Aeronautics and Space. Retrieved on 2008-05-26.
- ^ Aircraft Owners and Pilots Association. Aircraft Icing. Retrieved on 2008-05-26.
- ^ National Weather Service Forecast Office Dodge City, Kansas. Aviation Hazards They Didn’t Tell You About. Retrieved on 2008-05-26.
- ^ Bureau of Meteorology. Aviation Hazards: Thunderstorms and Deep Convection. Retrieved on 2008-05-26.
- ^ Volcanic Ash Aviation Hazard. Retrieved on 2008-05-26.
- ^ Ned Rozell. Amazing flying machines allow time travel. Retrieved on 2008-05-08.
- ^ National Weather Service. A Pilot's Guide to Aviation Weather Services. Retrieved on 2008-05-26.
- ^ Eric C. King. Takeoff Tools Crosswind Calculator Instructions. Retrieved on 2008-05-26.
- ^ Great Lakes and Seaway Shipping. MAFOR Weather Code. Retrieved on 2008-05-27.
- ^ Blair Fannin. Dry weather conditions continue for Texas. Retrieved on 2008-05-26.
- ^ Dr. Terry Mader. Drought Corn Silage. Retrieved on 2008-05-26.
- ^ Kathryn C. Taylor. Peach Orchard Establishment and Young Tree Care. Retrieved on 2008-05-26.
- ^ Associated Press. After Freeze, Counting Losses to Orange Crop. Retrieved on 2008-05-26.
- ^ Climate Prediction Center. Degree Day Explanation. Retrieved on 2008-05-25.
- ^ The New York Times. Futures/Options; Cold Weather Brings Surge in Prices of Heating Fuels. Retrieved on 2008-05-25.
- ^ BBC. Heatwave causes electricity surge. Retrieved on 2008-05-25.
- ^ Toronto Catholic Schools. The Seven Key Messages of the Energy Drill Program. Retrieved on 2008-05-25.
- ^ CSIRO. Providing specialized weather forecasts. Retrieved on 2008-05-25.
- ^ Stephen Jewson and Rodrigo Caballero. The Use of Weather Forecasts in the Pricing of Weather Derivatives. Retrieved on 2008-05-25.
- ^ Joint Typhoon Warning Center. Joint Typhoon Warning Center Mission Statement. Retrieved on 2008-05-27.
- ^ United States Air Force.Air Force Weather Agency. Retrieved on 2008-05-26.
- ^ United States Military. US Coast Guard Jobs - Enlisted Occupations. Retrieved on 2008-05-26.
- ^ Rod Powers. United States Marine Corps Enlisted Job Descriptions and Qualification Factors: Field 68 - Meteorology and Oceanography (METOC). Retrieved on 2008-05-26.
- ^ Keesler Air Force Base. Military officers usually received their education from a civilian institution. Keesler News: March 9, 2006. United States Air Force Retrieved on 2008-05-26.
External links
Meteorological agencies
These are academic or governmental meteorology organizations. Most provide at least a limited forecast for their area of interest on their website.
- The World Meteorological Organization
- European Centre for Medium Range Weather Forecasting (ECMWF)
- Australian Bureau of Meteorology
- Royal Meteorological Institute of Belgium
- Environment Canada Weather Office
- Finnish Meteorological Institute
- French National Meteorological Service
- Indian Meteorological Department(IMD)
- National Centre for Medium Range Weather Forecast (NCMRWF)
- Indian Institute of Tropical Meteorology (IITM)
- National Atmospheric Research Laboratory (NARL)
- Pakistan Meteorological Department
- The Hellenic National Meteorological Service (Greece)
- Hong Kong Observatory
- Met Éireann (Ireland)
- Italian Air Force (Aeronautica Militare) Meteorological Service
- Korea Meteorological Administration
- New Zealand MetService
- South African Weather Service
- Meteo Suisse (Swiss Weather Agency) (English)
- The Met Office of the UK
- yr.no (a joint online weather service from the Norwegian Meteorological Institute (met.no) and the Norwegian Broadcasting Corporation (NRK))
- Unidad de Meteorología - IVIC (Meteorology Unit - Venezuela Institute of Scientific Research) (Spanish)
- Instituto Nacional de Hidrometeorología (Spanish)
Other external links
- Economic history and impact of weather forecasting from EH.net
- Dynamic Weather Forecaster Iowa State University's online educational tool for weather forecasting
- "World Weather News by Radio" Popular Mechanics, January 1930, pp.50-55, article on international weather report systems set up after World War One, using wireless broadcasting from various stations and ships world wide
Meteorological data and variables General Adiabatic processes · Lapse rate · Lightning · Surface solar radiation · Surface weather analysis · Visibility · Vorticity · WindCondensation Convection Temperature Dew point (Td) · Equivalent temperature (Te) · Forest fire weather index · Haines Index · Heat index · Humidex · Humidity · Potential temperature (θ) · Equivalent potential temperature (θe) · Sea surface temperature (SST) · Wet-bulb temperature · Wet-bulb potential temperature · Wind chillPressure Earth-based meteorological equipment and instrumentation Anemometer · Barograph · Barometer · Ceiling balloon · Ceiling projector · Ceilometer · Dark adaptor goggles · Disdrometer · Field mill · Hygrometer · Ice Accretion Indicator · LIDAR · Lightning detector · Nephelometer · Nephoscope · Pan evaporation · Pyranometer · Radiosonde · Rain gauge · Snowboard · Snow gauge · SODAR · Solarimeter · Sounding rocket · Stevenson screen · Sunshine recorders · Thermograph · Thermometer · Transmissometer · Weather balloon · Weather radar · Weather vane · Windsock · Wind profilerEarth-based meteorological observation systems and weather stations By region WorldwideArgo · Global Atmosphere Watch (GAW) · Aircraft Communication Addressing and Reporting System (ACARS) · Aircraft Meteorological Data Relay (AMDAR) · Global Sea Level Observing System (GLOSS) · Deep-ocean Assessment and Reporting of Tsunamis (DART) · FluxNet Project (FluxNet)United StatesCitizens Weather Observer Program (CWOP) · Coastal-Marine Automated Network (C-MAN) · NEXRAD radar · Remote Automated Weather Station (RAWS) · Tropospheric Airborne Meteorological Data Reporting (TAMDAR)Meteorological remote sensing systems in Earth orbit Concepts Current projects A-train satellitesOther satellitesCBERS · COSMIC (FORMOSAT-3) · COSMO-SkyMed · DMSP · DMC · Elektro-L · Envisat · EROS · ERS · Fengyun · FORMOSAT-2 · GOES · IKONOS · Landsat · MetOp · Meteor · Meteosat · MTSAT · NOAA-N' · QuickBird · RADARSAT-1 · RADARSAT-2 · SMOS · SPOT · TerraSAR-X · THEOSFormer projects CompletedFailedNational Meteorological Organisations Europe Central Institute for Meteorology and Geodynamics (Austria) · Royal Meteorological Institute (Belgium) · Czech Hydrometeorological Institute · Croatian Meteorological and Hydrological Service · Danish Meteorological Institute · Estonian Meteorological and Hydrological Institute · Finnish Meteorological Institute · Météo-France · Deutscher Wetterdienst (Germany) · Hellenic National Meteorological Service (Greece) · Icelandic Meteorological Office · Met Éireann (Ireland) · Servizio Meteorologico (Italy) · Latvian Environment, Geology and Meteorology Centre · Instituto de Meteorologia (Portugal) · Royal Netherlands Meteorological Institute · Norwegian Meteorological Institute · Administraţia Naţionala de Meteorologie (Romania) · Hydrometeorological Centre of Russia · Agencia Estatal de Meteorología (Spain) · Swedish Meteorological and Hydrological Institute · Meteo Swiss · Turkish State Meteorological Service · Met Office (United Kingdom)
Asia Afghanistan Meteorological Authority · China Meteorological Administration · Central Weather Bureau (Taiwan) · Hong Kong Observatory · India Meteorological Department · Japan Meteorological Agency · Macao Meteorological and Geophysical Bureau · Philippine Atmospheric, Geophysical and Astronomical Services Administration · Hydrometeorological Centre of Russia · Pakistan Meteorological Department · Korea Meteorological Administration
Americas Meteorological Service of Canada · Institute of Hydrology, Meteorology and Environmental Studies (Colombia) · Instituto Nacional Meteorologia e Hidrologia (Ecuador) · Instituto Nacional de Sismología, Vulcanología, Metereología e Hidrología (Guatemala) · Servicio Meteorológico Nacional (Mexico) · National Weather Service (United States)
Oceania Africa Categories:- Broadcasting
- Weather prediction


Wikimedia Foundation. 2010.