- Cherry Valley, California
-
Cherry Valley — census-designated place — Location in Riverside County and the state of California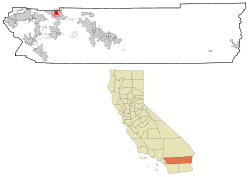
Coordinates: 33°58′29″N 116°58′13″W / 33.97472°N 116.97028°WCoordinates: 33°58′29″N 116°58′13″W / 33.97472°N 116.97028°W Country  United States
State  California
County Riverside Area[1] – Total 8.087 sq mi (20.944 km2) – Land 8.087 sq mi (20.944 km2) – Water 0 sq mi (0 km2) 0% Elevation 2,822 ft (860 m) Population (2010) – Total 6,362 – Density 786.7/sq mi (303.8/km2) Time zone PST (UTC-8) – Summer (DST) PDT (UTC-7) ZIP code 92223 Area code(s) 951 FIPS code 06-12916 GNIS feature ID 1660476 Cherry Valley is a census-designated place (CDP) in Riverside County, California, United States. The population was 6,362 at the 2010 census, up from 5,891 at the 2000 census. It is situated on the San Gorgonio Pass at its peak.
Contents
Geography
Cherry Valley is located at 33°58′29″N 116°58′13″W / 33.97472°N 116.97028°W (33.974848, -116.970300).[2]
With an elevation of 2,500-3,500 feet above sea level, Cherry Valley is at the highest point on the San Gorgonio Pass between San Bernardino, CA and Palm Springs, CA. According to the United States Census Bureau, the CDP has a total area of 8.1 square miles (21 km2), all of it land.
Demographics
2010
The 2010 United States Census[3] reported that Cherry Valley had a population of 6,362. The population density was 786.7 people per square mile (303.8/km²). The racial makeup of Cherry Valley was 5,450 (85.7%) White, 63 (1.0%) African American, 102 (1.6%) Native American, 87 (1.4%) Asian, 4 (0.1%) Pacific Islander, 451 (7.1%) from other races, and 205 (3.2%) from two or more races. Hispanic or Latino of any race were 1,347 persons (21.2%).
The Census reported that 6,203 people (97.5% of the population) lived in households, 98 (1.5%) lived in non-institutionalized group quarters, and 61 (1.0%) were institutionalized.
There were 2,612 households, out of which 540 (20.7%) had children under the age of 18 living in them, 1,375 (52.6%) were opposite-sex married couples living together, 236 (9.0%) had a female householder with no husband present, 98 (3.8%) had a male householder with no wife present. There were 115 (4.4%) unmarried opposite-sex partnerships, and 16 (0.6%) same-sex married couples or partnerships. 769 households (29.4%) were made up of individuals and 500 (19.1%) had someone living alone who was 65 years of age or older. The average household size was 2.37. There were 1,709 families (65.4% of all households); the average family size was 2.89.
The population was spread out with 1,057 people (16.6%) under the age of 18, 448 people (7.0%) aged 18 to 24, 1,039 people (16.3%) aged 25 to 44, 1,967 people (30.9%) aged 45 to 64, and 1,851 people (29.1%) who were 65 years of age or older. The median age was 51.9 years. For every 100 females there were 90.7 males. For every 100 females age 18 and over, there were 90.0 males.
There were 2,874 housing units at an average density of 355.4 per square mile (137.2/km²), of which 2,098 (80.3%) were owner-occupied, and 514 (19.7%) were occupied by renters. The homeowner vacancy rate was 4.4%; the rental vacancy rate was 5.5%. 4,853 people (76.3% of the population) lived in owner-occupied housing units and 1,350 people (21.2%) lived in rental housing units.
2000
As of the census[4] of 2000, there were 5,891 people, 2,434 households, and 1,740 families residing in the CDP. The population density was 714.6 people per square mile (276.0/km²). There were 2,627 housing units at an average density of 318.6 per square mile (123.1/km²). A law was passed in which there could only be 1 house per acre. The racial makeup of the CDP was 80.1% White, 0.1% Black or African American, 2.2% Native American, 2.1% Asian, 2.2% Pacific Islander, 4.3% from other races, and 2.5% from two or more races. 13.4% of the population were Hispanic or Latino of any race.
There were 2,434 households out of which 20.1% had children under the age of 18 living with them, 61.8% were married couples living together, 6.5% had a female householder with no husband present, and 28.5% were non-families. 24.5% of all households were made up of individuals and 15.7% had someone living alone who was 65 years of age or older. The average household size was 2.4 and the average family size was 2.8.
In the CDP the population was spread out with 18.8% under the age of 18, 5.7% from 18 to 24, 18.9% from 25 to 44, 26.8% from 45 to 64, and 29.8% who were 65 years of age or older. The median age was 50 years. For every 100 females there were 92.5 males. For every 100 females age 18 and over, there were 90.5 males.
The median income for a household in the CDP was $39,199, and the median income for a family was $45,777. Males had a median income of $37,281 versus $29,561 for females. The per capita income for the CDP was $21,669. About 3.3% of families and 5.8% of the population were below the poverty line, including 6.4% of those under age 18 and 5.7% of those age 65 or over.
Cherry Valley unsuccessfully attempted to incorporate into a city in the 1990s and early 2000s.
Politics
In the state legislature Cherry Valley is located in the 37th Senate District, represented by Republican Bill Emmerson, and in the 65th Assembly District, represented by Republican Paul Cook. Federally, Cherry Valley is located in California's 41st congressional district, which has a Cook PVI of R +9[5] and is represented by Republican Jerry Lewis.
References
- ^ U.S. Census
- ^ "US Gazetteer files: 2010, 2000, and 1990". United States Census Bureau. 2011-02-12. http://www.census.gov/geo/www/gazetteer/gazette.html. Retrieved 2011-04-23.
- ^ All data are derived from the United States Census Bureau reports from the 2010 United States Census, and are accessible on-line here. The data on unmarried partnerships and same-sex married couples are from the Census report DEC_10_SF1_PCT15. All other housing and population data are from Census report DEC_10_DP_DPDP1. Both reports are viewable online or downloadable in a zip file containing a comma-delimited data file. The area data, from which densities are calculated, are available on-line here. Percentage totals may not add to 100% due to rounding. The Census Bureau defines families as a household containing one or more people related to the householder by birth, opposite-sex marriage, or adoption. People living in group quarters are tabulated by the Census Bureau as neither owners nor renters. For further details, see the text files accompanying the data files containing the Census reports mentioned above.
- ^ "American FactFinder". United States Census Bureau. http://factfinder.census.gov. Retrieved 2008-01-31.
- ^ "Will Gerrymandered Districts Stem the Wave of Voter Unrest?". Campaign Legal Center Blog. http://www.clcblog.org/blog_item-85.html. Retrieved 2008-02-10.
External links
Municipalities and communities of Riverside County, California Cities Banning | Beaumont | Blythe | Calimesa | Canyon Lake | Cathedral City | Coachella | Corona | Desert Hot Springs | Eastvale | Hemet | Indian Wells | Indio | Jurupa Valley | La Quinta | Lake Elsinore | Menifee | Moreno Valley | Murrieta | Norco | Palm Desert | Palm Springs | Perris | Rancho Mirage | Riverside | San Jacinto | Temecula | Wildomar
CDPs Aguanga | Anza | Bermuda Dunes | Cabazon | Cherry Valley | Coronita | Crestmore Heights | Desert Center | Desert Edge | Desert Palms | East Hemet | El Cerrito | El Sobrante | French Valley | Garnet | Glen Avon | Good Hope | Green Acres | Highgrove | Home Gardens | Homeland | Idyllwild-Pine Cove | Indio Hills | Lake Mathews | Lake Riverside | Lakeland Village | Lakeview | March ARB | Mead Valley | Meadowbrook | Mecca | Mesa Verde | Mira Loma | Mountain Center | North Shore | Nuevo | Oasis | Pedley | Ripley | Romoland | Rubidoux | Sky Valley | Sunnyslope | Temescal Valley | Thermal | Thousand Palms | Valle Vista | Vista Santa Rosa | Warm Springs | Whitewater | Winchester | Woodcrest
Unincorporated
communitiesAlberhill | Alessandro | Arcilla | Arnold Heights | Belltown | Biskra Palms | Bly | Bonnie Bell | Box Springs | Cactus City | Cahuilla | Cahuilla Hills | Chiriaco Summit | East Blythe | Edgemont | El Cariso | Gilman Hot Springs | La Cresta | Lost Lake | Mortmar | Murrieta Hot Springs | River Bend Lodge | Sun City Palm Desert
Indian
reservationsAgua Caliente Indian Reservation | Cabazon Indian Reservation | Cahuilla Reservation | Colorado River Indian Reservation | Los Coyotes Reservation | Morongo Reservation | Ramona Indian Reservation | Santa Rosa Indian Reservation | Soboba Reservation | Torres-Martinez Indian Reservation
Ghost towns Alamo Bonito | Auld | Bergman | Caleb | Eagle Mountain | Hell | La Placita | Midland | Pinacate | Saahatpa | Terra Cotta
Categories:- Census-designated places in Riverside County, California


Wikimedia Foundation. 2010.