- Demographics of Asian Americans
-

The demographics of Asian Americans describe a heterogeneous group of people in the United States who can trace their ancestry to one or more countries in Asia. Because Asian Americans total less than 5% of the entire U.S. population, the diversity of the group is often disregarded in media and news discussions of "Asians" or of "Asian Americans."
Contents
Census population counts and estimates
As of 2009[update], U.S. census figures showed that about 14.9 million people were reporting themselves as having either full or partial Asian heritage, around 5.0% of the U.S. population.[1] The largest ethnic subgroups are Chinese (3.53 million),[2] Filipinos (3.05 million),[3] Indians (2.77 million),[4] Vietnamese (1.64 million),[5] Koreans (1.56 million),[6] and Japanese (1.22 million).[7] Other sizable groups are Cambodian/Khmer (244,000), Pakistanis (214,000),[8] Laotians (198,000), Hmong (186,000), Thais (150,000),[9] Taiwanese (100,608),[10] and Bangladeshi (75,000).[11]
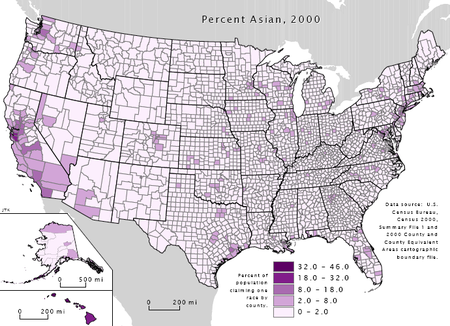
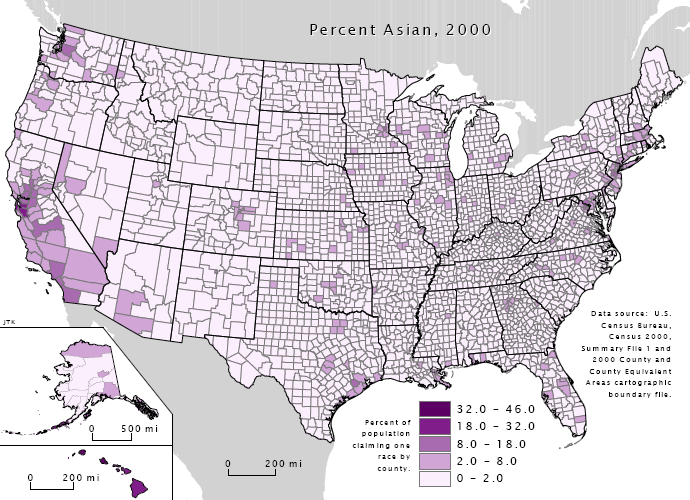
During the 2000 U.S. census recorded 11.9 million people who reported themselves as having either full or partial Asian heritage, 4.2% of the U.S. population. The largest ethnic subgroups were Chinese (2.7 million), Filipinos (2.4 million), Asian Indians (1.9 million), Vietnamese (1.2 million), Koreans (1.2 million), and Japanese (1.1 million). Other sizable groups are Cambodians (206,000), Pakistanis (204,000), Laotians (198,000), Hmong (186,000), and Thais (150,000).[12] About one-half of the Asian American population lived in the West, with California having the largest Asian American population (4.2 million).[12] As a proportionally to the total population, Hawaii had a majority Asian American population (58 percent);[12] furthermore Honolulu county had the highest percentage of Asian Americans (62 percent) of any county in the nation.[12] The Asian American population is heavily urbanized, with nearly three-quarters of Asian Americans living in metropolitan areas with population greater than 2.5 million. Asian Americans are concentrated in the largest U.S. cities, with 40% of all Asian Americans living in the metropolitan areas around Los Angeles, New York City, and San Francisco.
As of 2000[update], 69% of all Asian Americans were foreign born, although Japanese Americans stood out with about 60% being born in the United States.[13]
Settlement
Metropolitan Areas with the Highest Population of Asian Americans (greater than 250,000 people)(2005-2007 ACS Estimates)[14] Metropolitan Area Asian alone or in combination with one or more other races: Total Margin of error +/- Los Angeles-Long Beach-Santa Ana, CA Metro Area 1,868,359 3,274 New York-Northern New Jersey-Long Island, NY-NJ-PA Metro Area 1,782,421 4,307 San Francisco-Oakland-Fremont, CA Metro Area 979,894 2,747 San Jose-Sunnyvale-Santa Clara, CA Metro Area 547,877 2,000 Honolulu, HI Metro Area 543,423 1,840 Chicago-Naperville-Joliet, IL-IN-WI Metro Area 523,309 1,795 Washington-Arlington-Alexandria, DC-VA-MD-WV Metro Area 477,503 1,720 Seattle-Tacoma-Bellevue, WA Metro Area 387,113 1,715 San Diego-Carlsbad-San Marcos, CA Metro Area 346,632 1,477 Houston-Sugar Land-Baytown, TX Metro Area 324,012 1,038 Dallas-Fort Worth-Arlington, TX Metro Area 299,082 1,425 Boston-Cambridge-Quincy, MA-NH Metro Area 274,975 1,445 Philadelphia-Camden-Wilmington, PA-NJ-DE-MD Metro Area 262,856 1,290 Sacramento--Arden-Arcade--Roseville, CA Metro Area 260,161 1,638 Riverside-San Bernardino-Ontario, CA Metro Area 253,699 2,398 Metropolitan Areas with the Highest Proportion of Asian Americans (2000 Census)[15] Metropolitan Area Total population % of Asian Americans Honolulu, HI MSA 876,156 46.0 San Francisco Bay Area 7,039,362 18.4 Greater Los Angeles Area 16,373,645 10.4 Sacramento/Yolo, CA CMSA 1,796,857 9.0 San Diego, CA MSA 2,813,833 8.9 Seattle-Tacoma metropolitan area 3,554,760 7.9 New York metropolitan area 21,199,865 6.8 Portland 538,544 6.3 Anchorage, Alaska 270,951 5.5 Baltimore-Washington (AA demographics) 7,608,070 5.3 Greater Houston 4,669,571 4.9 Clark County, Nevada, NV/AZ MSA 1,563,282 4.7 The Asian American population is heavily urbanized, with nearly three-quarters of Asian Americans living in metropolitan areas with population greater than 2.5 million. The three metropolitan areas with the highest Asian American populations are the Greater Los Angeles Area (1.868 million in 2007), the New York–Northern New Jersey–Long Island Area (1.782 million in 2007), and the San Francisco Bay Area (979,000 in 2007).[16] New York City alone, according to the United States 2010 Census, has now become home to more than one million Asian Americans, greater than the combined totals of San Francisco and Los Angeles.[17] New York City contained the highest total Asian population of any U.S. city proper, and among the ten largest U.S. cities San Diego had the greatest proportion.[18] By American states, a large proportion of all Asian Americans live in California (5 million in 2007), New York (1.4 million in 2007), Texas (915,000 in 2007),[19] New Jersey, and Hawaii.
In regions with large numbers of Asian Americans, suburban communities have developed that are heavily or predominantly Asian. The schools in these areas may offer languages such as Mandarin as a second language. Since the 1970s, in addition to Chinatowns, "Little Manila", "Little Indias", "Little Pakistans", Koreatowns, "Little Saigons", and "Cambodia Towns" have appeared in several cities.
Since the 1970s, populations of Asian Americans have been visible and are growing. Large Japantowns once existed up and down the West Coast because of extensive Japanese immigration. The ones that remain are vestiges of once vibrant pre-World War II communities whose members, like other Americans, moved out into the suburbs and larger communities. They are "underrepresented" (against the national aggregate) in several of the largest areas, including Chicago, Philadelphia, Boston, and Dallas-Fort Worth, although sizable concentrations (double the national percentage) can be found in some urban neighborhoods, such as Albany Park in Chicago and Olney in Philadelphia. Additionally, similar Asian populations are found in suburbs of these cities such as Naperville and Evanston near Chicago; Millbourne, King of Prussia, and Cherry Hill near Philadelphia; Richardson, Carrollton, and Plano in Dallas-Fort Worth; Lowell and Lexington near Boston and Las Vegas. This pattern reflects their later arrival and response to changing economic conditions in some cities.
List of US States by Population of Asian Americans
State/Territory Asian American
Population (2010 Census)[20]Chinese Filipino Indian Japanese Korean Vietnamese Other Asian  Alabama
53,595 9,436 4,952 13,036 2,391 8,320 7,398 8,062  Alaska
38,135 2,061 19,394 1,218 1,476 4,684 960 8,342  Arizona
176,695 32,356 35,013 36,047 9,152 15,022 24,216 24,889  Arkansas
36,102 5,158 3,937 7,973 1,111 2,269 5,515 10,139  California
4,861,007 1,253,102 1,195,580 528,176 272,528 451,892 581,946 577,783  Colorado
139,028 20,369 25,215 14,448 11,097 20,433 20,899 26,567  Connecticut
135,565 31,404 11,998 46,415 3,574 9,619 9,341 23,214  Delaware
28,549 6,172 3,276 11,424 540 2,540 1,438 3,159  District of Columbia
21,056 5,231 2,690 5,214 1,172 2,290 1,567 2,892  Florida
454,821 72,248 90,223 128,735 13,224 26,205 58,470 65,716  Georgia
314,467 45,849 17,923 96,116 7,658 52,431 45,263 49,227  Hawaii
525,078 54,955 197,497 2,201 185,502 24,203 9,779 50,941  Idaho
Idaho19,069 4,039 3,022 2,152 2,620 1,670 1,707 3,859  Illinois
586,934 104,166 114,724 188,328 17,542 61,469 25,036 75,669  Indiana
102,474 22,553 10,652 27,598 4,896 10,322 6,845 19,608  Iowa
Iowa53,094 9,834 3,558 11,081 1,332 5,537 8,347 13,405  Kansas
67,762 11,188 5,545 13,848 1,671 5,234 14,015 16,261  Kentucky
48,930 9,051 5,188 12,501 4,124 4,917 5,046 8,103  Louisiana
70,132 10,017 6,416 11,174 1,464 3,367 28,352 9,342  Maine
Maine13,571 3,514 1,639 1,959 584 1,144 1,713 3,018  Maryland
318,853 69,381 43,923 79,051 6,749 48,592 23,635 47,522  Massachusetts
349,768 122,957 12,309 77,177 9,224 24,110 42,915 61,076  Michigan
238,199 44,496 22,047 77,132 10,911 24,186 16,787 42,640  Minnesota
214,234 24,643 9,464 33,031 3,611 14,982 23,544 104,959  Mississippi
25,742 4,474 3,562 5,494 807 1,537 7,025 2,843  Missouri
98,083 22,104 10,914 23,223 3,186 9,249 14,523 14,884  Montana
6,253 1,286 1,383 618 850 837 297 982  Nebraska
32,293 4,717 2,741 5,903 1,538 2,678 7,910 6,806  Nevada
195,436 28,929 98,351 11,671 10,873 13,896 9,892 21,824  New Hampshire
28,407 6,356 2,177 8,268 841 2,175 2,472 6,118  New Jersey
725,726 134,442 110,650 292,256 13,146 93,679 20,628 60,925  New Mexico
28,208 5,729 4,963 4,550 2,208 2,423 4,726 3,609  New York
1,420,244 576,952 104,287 313,620 37,780 140,994 28,764 217,847  North Carolina
208,962 34,169 18,643 57,400 6,411 19,221 27,304 45,814  North Dakota
6,909 1,515 924 1,543 276 609 640 1,402  Ohio
Ohio192,233 43,818 16,899 64,187 10,162 15,281 13,121 28,765  Oklahoma
65,076 9,120 5,901 11,906 2,113 5,949 16,258 13,829  Oregon
141,263 30,919 15,861 16,740 12,085 15,212 26,195 24,251  Pennsylvania
349,088 84,812 21,948 103,026 6,492 40,505 39,008 53,297  Rhode Island
30,457 6,860 2,621 4,653 639 2,138 1,326 12,220  South Carolina
59,051 9,686 10,053 15,941 2,413 4,876 6,801 9,281  South Dakota
7,610 1,297 1,048 1,152 290 834 762 2,227  Tennessee
91,242 15,415 9,247 23,900 3,962 9,818 10,033 18,867  Texas
Texas964,596 156,820 103,074 245,981 18,360 67,750 210,913 161,698  Utah
Utah55,285 11,186 5,600 6,212 6,087 5,379 8,025 12,796  Vermont
7,947 2,301 558 1,359 405 889 1,019 1,416  Virginia
439,890 59,777 66,963 103,916 9,471 70,577 53,529 75,657  Washington
481,067 94,198 91,367 61,124 35,008 62,374 66,575 70,421  West Virginia
12,406 2,719 1,939 3,304 586 1,039 901 1,918  Wisconsin
129,234 17,558 7,930 22,899 2,729 7,919 4,877 65,322  Wyoming
4,426 1,044 901 589 454 508 191 739  Puerto Rico
6,831 2,187 251 3,523 160 117 165 428  United States of America
14,674,252 3,347,229 2,555,923 2,843,391 763,325 1,423,784 1,548,449 2,192,151 The above list displaying the population of Asian Americans (not including Multiracial Asian Americans) in some of the US states and territories according to the 2010 United States Census. The list is incomplete as data for the overseas territory of Guam, and the Commonwealth of the Northern Mariana Islands are yet to be released by the US Census Bureau.
Demographic trends
Metropolitan Areas with the Highest Population of Asian Americans (greater than 250,000 people)(2005-2007 ACS Estimates)[14] Metropolitan Area Asian alone or in combination with one or more other races: Total Margin of error +/- Los Angeles-Long Beach-Santa Ana, CA Metro Area 1,868,359 3,274 New York-Northern New Jersey-Long Island, NY-NJ-PA Metro Area 1,782,421 4,307 San Francisco-Oakland-Fremont, CA Metro Area 979,894 2,747 San Jose-Sunnyvale-Santa Clara, CA Metro Area 547,877 2,000 Honolulu, HI Metro Area 543,423 1,840 Chicago-Naperville-Joliet, IL-IN-WI Metro Area 523,309 1,795 Washington-Arlington-Alexandria, DC-VA-MD-WV Metro Area 477,503 1,720 Seattle-Tacoma-Bellevue, WA Metro Area 387,113 1,715 San Diego-Carlsbad-San Marcos, CA Metro Area 346,632 1,477 Houston-Sugar Land-Baytown, TX Metro Area 324,012 1,038 Dallas-Fort Worth-Arlington, TX Metro Area 299,082 1,425 Boston-Cambridge-Quincy, MA-NH Metro Area 274,975 1,445 Philadelphia-Camden-Wilmington, PA-NJ-DE-MD Metro Area 262,856 1,290 Sacramento--Arden-Arcade--Roseville, CA Metro Area 260,161 1,638 Riverside-San Bernardino-Ontario, CA Metro Area 253,699 2,398 Asian Americans tend to have larger families and earn slightly less per capita than European American populations. However, they have higher median income than European Americans as well as higher percentage of home ownership and college graduation rate.[21] The proportion of Asian Americans at many selective educational institutions far exceeds the national population rate.
Many immigrants are often forced to work in minimum wage or below-minimum wage jobs, including menial sweatshop or restaurant labor, because they fear that mainstream employers will not hire them. If they are an illegal immigrant, employers will report them to the government.
Education
Asian Americans have the highest educational attainment of any racial group. About 49% of Asian Americans have at least a bachelor's degree.[22] Asian people often have the highest math averages in tests such as SAT, GRE etc. Since the 1990s, although verbal scores generally lag, combined SAT scores have also been higher than for white Americans.[citation needed] Asians constitute around 10-20% of those attending Ivy League and other elite universities.
Asian Americans are the largest racial group on all but one of the nine fully established University of California campuses. Chinese Americans make up 25% of the undergraduate student body. Asian Americans make up only 4% of the American population, but they are more likely to attend college, go to graduate school, and earn higher grades than any other ethnic group in the United States.
There was, and to some extent still are concerns that the goal of "diversity" has had a negative effect on Asians who are usually over-represented with charges of quotas and discrimination starting in the 1980s.[citation needed] Asian American test scores are also bi-modal, with disproportionate numbers of Asians not only at high scores, but also low scores.[citation needed] Asian education tradition is usually based on traditional respect for authority, memorization and hard work, but these values have not been a hindrance to their critical thinking or in solving problems and questions that don't have one correct answer.[citation needed]
Income
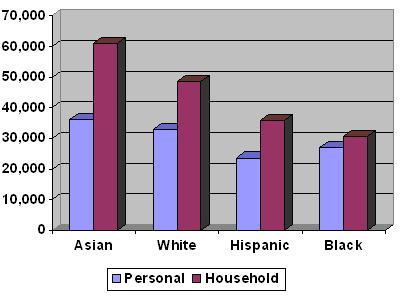
Further information: Income in the United StatesAsian Americans have household and personal income levels that exceed those of any other racial demographic, yet the Asian poverty rate is higher than for European Americans.[25] In 2005 the median personal income for Asian Americans was estimated to be $36,152, compared to $33,030 for Whites, $27,101 for African Americans and $23,613 for those identifying as Hispanic or Latino. Asian Americans had the highest household income levels of any racial demographic with a median household income of $61,094, compared to $48,554 among European American households. Additionally 28% of Asian American households had incomes exceeding $100,000, while only 18% of the overall population boasted such household incomes. The higher household income for Asian Americans is, however, somewhat offset by a larger household size (note that in many Asian cultures, children tend to live with their parents well into their late 20s and early 30s, even those who hold regular jobs), leading to the median income per household member being slightly lower for Asian American than for European American households.[26] As the differences between the personal income levels among Asian Americans and those of other races are smaller than the racial discrepancies in household income levels, it becomes apparent that Asian Americans have a higher percentage 2+ income earner households. Overall, the higher personal income levels are attributed mostly to higher educational attainment.
Personal and household income distribution, by race/ethnicity Race/ethnic group Type of income poverty <$25k $25k-
$50k$50k-
$75k$75k-
$100k>$100k European Americans Persons N/A 35.6% 35.2% 14.5% 6.9% 7.2% Households 8.6% 24.9% 26.3% 18.9% 11.6% 18.3% Asian Americans Persons N/A 33.5% 29.8% 18.1% 8.0% 10.6% Households 10.1% 20.9% 19.3% 19.2% 13.1% 27.5% Hispanic or Latino Persons N/A 49.4% 36.5% 9.0% 2.6% 2.6% Households 18.3% 37.7% 29.7% 17.2% 6.6% 8.8% African Americans Persons N/A 41.3% 37.0% 15.7% 3.5% 2.6% Households 22.3% 43.1% 26.8% 15.1% 7.3% 7.8% SOURCE: US Census Bureau, 2006[27]
As of 2008[update], Asian American households had the highest median income at $65,637; however, 11.8 percent of Asians were in poverty in 2004, higher than the 8.6 percent rate for non-Hispanic whites.[28] Much of this poverty is concentrated in ethnic enclaves such as Chinatowns in the cities[29] Census figures also show that a white male with a college diploma earns in excess of $66,000 a year, far more than similarly educated Asian men who earned more than $52,000 a year.[30] Asians however are more likely to complete higher education particularly and are the highest group by percentage with graduate degrees.[31]
Population growth
Asian American population growth is fueled by immigration. Natural population growth accounts for a small proportion of the increase. It is noteworthy that the Asian American population grew at over 43% in the last decade.[32]
Category Population (2000) (Asians alone)[32] Population of Multi-racial Asian Americans (2000) Population (2000) (including Asians alone and in any combination)[33] Population (2010)(Asians alone)[32] Population of Multi-racial Asian Americans (2010) Population (2010) (including Asians alone and in any combination)[34] Decadal Growth (2000-2010) (Asians alone) Decadal Growth (2000-2010) (including Asians alone or in any combination) Chinese 2,432,585 302,256 2,734,841 3,347,229 450,150 3,797,379 914,644 1,062,538 Filipino 1,850,351 514,464 2,364,815 2,555,923 861,362 3,417,285 705,572 1,052,470 Indian 1,678,765 220,063 1,898,828 2,843,391 345,147 3,188,538 1,164,626 1,289,710 Japanese 796,700 352,232 1,148,932 763,325 541,274 1,304,599 -33,375 155,667 Korean 1,076,872 151,555 1,228,427 1,423,784 283,243 1,707,027 346,912 478,600 Vietnamese 1,122,528 101,208 1,223,736 1,548,449 189,216 1,737,665 425,921 513,929 Other 1,285,197 14,052 1,299,249 2,192,151 607,297 2,799,448 892,902 1,500,199 All Asians 10,242,998(Asians alone)[35] 1,655,830 11,898,828(including Asians alone or in any combination)[35] 14,674,252 (Asians alone)[35] 2,646,604 17,951,941(including Asians alone or in any combination)[35] 4,431,254(Asians alone)[35] 5,422,028(including Asians alone or in any combination)[35] All Americans 281,421,906 308,745,538 27,323,632 The table above provides a disaggregated picture of the population growth of Asian Americans over the last decade. Please note that data for Multi-racial Asian Americans has not yet been released and so is not included in this table for the 2010 figure, except where stated.
Language
As of 2000[update], the more prominent languages of the community include the Chinese languages (Cantonese, Taishanese, Hokkien), Tagalog, Vietnamese, Korean, Japanese, Hindi, Urdu, and Gujarati.[36] Currently, Chinese languages, Japanese, Korean, Tagalog, and Vietnamese are all used in elections in Alaska, California, Hawaii, Illinois, New York, Texas, and Washington.[37]
See also
- List of U.S. cities with Asian American majority populations
References
- ^ Asian American Population Estimates United States Census Bureau. Retrieved 7 June 2009.
- ^ Chinese American Population Estimates United States Census Bureau. Retrieved 7 June 2009.
- ^ Filipino American Population Estmates United States Census Bureau. Retrieved 7 June 2009.
- ^ Asian Indian Population Estimates United States Census Bureau. Retrieved 7 June 2009.
- ^ Vietnamese American Population Estimates United States Census Bureau. Retrieved 7 June 2009.
- ^ Korean American Population Estimates United States Census Bureau. Retrieved 7 June 2009.
- ^ Japanese American Population Estimates United States Census Bureau. Retrieved 7 June 2009.
- ^ Pakistan American Population Estimates United States Census Bureau. Retrieved 2 October 2010.
- ^ Jessica S. Barnes and Claudette E. Bennett. The Asian Population: 2000. Census Bureau publication c2kbr01-16. Issued February 2002.
- ^ Taiwanese American population estimates
- ^ Bangladeshi American Population Estimates United States Census Bureau. Retrieved 9 November 2010.
- ^ a b c d Jessica S. Barnes and Claudette E. Bennett. The Asian Population: 2000. Issued February 2002.
- ^ "We the People: Asians in the United States". U.S. Census Bureau. United States Department of Commerce. December 2004. http://www.census.gov/prod/2004pubs/censr-17.pdf. Retrieved 10 March 2011.
- ^ "Custom Table - American Fact Finder". 2005-2007 American Community Survey 3-Year Estimates. U.S. Census Bureau. http://factfinder.census.gov/servlet/CTTable?_lang=en&_ts=269166097803. Retrieved 24 August 2009.
- ^ Anchorage (municipality) QuickFacts from the US Census Bureau
- ^ "Selected Population Profile in the United States". U.S. Census. U.S. Department of Commerce. http://factfinder.census.gov/servlet/IPTable?_bm=y&-context=ip&-reg=ACS_2007_3YR_G00_S0201:031;ACS_2007_3YR_G00_S0201PR:031;ACS_2007_3YR_G00_S0201T:031;ACS_2007_3YR_G00_S0201TPR:031&-qr_name=ACS_2007_3YR_G00_S0201&-qr_name=ACS_2007_3YR_G00_S0201PR&-qr_name=ACS_2007_3YR_G00_S0201T&-qr_name=ACS_2007_3YR_G00_S0201TPR&-ds_name=ACS_2007_3YR_G00_&-tree_id=3307&-geo_id=31000US16980&-geo_id=31000US19100&-geo_id=31000US31100&-geo_id=31000US35620&-geo_id=31000US41740&-geo_id=31000US41860&-search_results=01000US&-format=&-_lang=en. Retrieved 2011-06-25.
- ^ Kirk Semple (2011-06-23). "Asian New Yorkers Seek Power to Match Numbers". The New York Times Company. http://www.nytimes.com/2011/06/24/nyregion/asian-new-yorkers-asian-new-yorkers-seek-power-to-match-surging-numbers.html?scp=1&sq=asians&st=cse. Retrieved 2011-06-24. "Asians, a group more commonly associated with the West Coast, are surging in New York, where they have long been eclipsed in the city’s kaleidoscopic racial and ethnic mix. For the first time, according to census figures released in the spring, their numbers have topped one million — nearly 1 in 8 New Yorkers — which is more than the Asian population in the cities of San Francisco and Los Angeles combined."
- ^ "Asian American Statistics". © 2011 Améredia Incorporated. http://www.ameredia.com/resources/demographics/asian_american.html. Retrieved 2011-06-25.
- ^ Bernstein, Robert (1 May 2008). "U.S. Hispanic Population Surpasses 45 Million". U.S. Census Bureau News (U.S. Department of Commerce). Archived from the original on 2008-05-06. http://web.archive.org/web/20080506111621/http://www.census.gov/Press-Release/www/releases/archives/population/011910.html. Retrieved 24 August 2009.
- ^ http://factfinder2.census.gov/faces/tableservices/jsf/pages/productview.xhtml?pid=DEC_10_DP_DPDP1&prodType=table
- ^ "Broad racial disparities persist". http://www.msnbc.msn.com/id/15704759/. Retrieved 2006-12-18.
- ^ Stoops, Nicole. "Educational Attainment in the United States, 2003." U.S. Census Bureau, Current Population Reports publication P20-550, June 2004. Accessed 16 Feb 2007.
- ^ "Table PINC-03. Educational Attainment--People 25 Years Old and Over, by Total Money Earnings in 2005, Work Experience in 2005, Age, Race, Hispanic Origin and Sex.". Annual Demographic Servey. U.S. Census. 29 August 2006. http://pubdb3.census.gov/macro/032006/perinc/new03_000.htm. Retrieved 20 June 2011.
- ^ "Table HINC-06. Income Distribution to $250,000 or More for Households: 2005". Annual Demographic Servey. U.S. Census. 29 August 2006. http://pubdb3.census.gov/macro/032006/hhinc/new06_000.htm. Retrieved 20 June 2011.
- ^ US Census Bureau publication p60-231 "Income, Poverty and Health Insurance in the United States: 2005" (PDF). http://www.census.gov/prod/2006pubs/p60-231.pdf. Retrieved 2006-12-18.
- ^ US Census Bureau, "Asians and Pacific Islanders Have Nation's Highest Median Household Income in 1997, Census Bureau Reports". Archived from the original on 2006-12-08. http://web.archive.org/web/20061208211712/http://www.census.gov/Press-Release/cb98-177.html. Retrieved 2006-12-18..
- ^ Carmen DeNavas-Walt; Bernadette D. Proctor, Jessica Smith (August 2007). "Income, Poverty, and Health Insurance Coverage in the United States: 2006". U.S. Census Bureau. U.S. Department of Commerce. http://www.census.gov/prod/2007pubs/p60-233.pdf. Retrieved 20 June 2011.
- ^ "Income, Poverty, and Health Insurance Coverage in the United States: 2008". U.S. Census Bureau. 2009. p. 9. http://www.census.gov/prod/2009pubs/p60-236.pdf.
- ^ Financing Affordable Housing: A Primer By Rick Liu, Sampan (archived from the original on 2008-06-16)
- ^ MSNBC March. 27, 2005 "Black, Asian women make income gains"
- ^ "Educational Attainment in the United States: 2007". U.S. Census Bureau. 2009. http://www.census.gov/prod/2009pubs/p20-560.pdf.
- ^ a b c http://www.indiawest.com/readmore.aspx?id=3430&sid=1
- ^ Jessica S. Barnes; Claudette E. Bennett (February 2000). "The Asian Population: 2000". U.S. Census Bureau. U.S. Department of Commerece. http://www.census.gov/prod/2002pubs/c2kbr01-16.pdf. Retrieved 9 June 2011.
- ^ http://factfinder2.census.gov/faces/tableservices/jsf/pages/productview.xhtml?pid=DEC_10_SF1_PCT7&prodType=table
- ^ a b c d e f 2010 United States Census statistics
- ^ Language Use and English-Speaking Ability: 2000: Census 2000 Brief
- ^ EAC Issues Glossaries of Election Terms in Five Asian Languages Translations to Make Voting More Accessible to a Majority of Asian American Citizens. Election Assistance Commission. 06/20/2008. (archived from the original on 2008-07-31)
External links
- Asian-Nation Asian American Socioeconomic Statistics and Comparisons
Asian Americans East Asian 
South Asian2 Southeast Asian Burmese · Cambodian · Filipino · Hmong · Indonesian · Laotian · Laotian Chinese · Mien · Singaporean · Thai · VietnameseOther History 1 The US Census Bureau reclassifies anyone identifying as "Tibetan American" as "Chinese American". [1].
2 The US Census Bureau considers Afghanistan a South Asian country, but does not classify Afghan Americans as Asian. [2]Categories:- Demographics of the United States
- Asian American issues


Wikimedia Foundation. 2010.