- Oil depletion
-
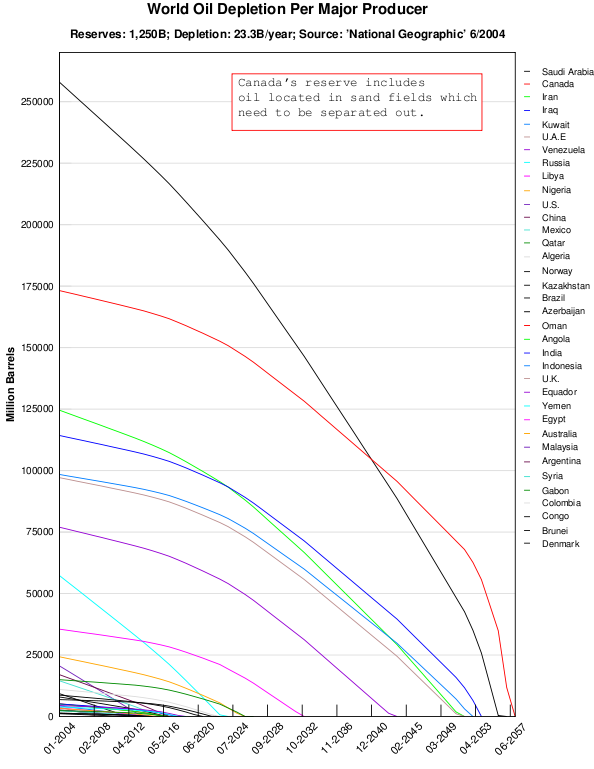
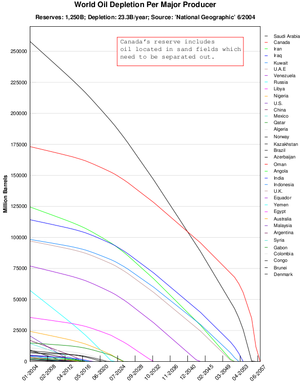 Oil depletion per major producing country. This model assumes world oil depletion remains constant at the 2004 level of 80 million barrels per day.[1] However, world oil depletion is currently (as of 2008) at 85 million barrels per day.[2] This model also assumes production will increase in the high-capacity countries as low-capacity countries become depleted.
Oil depletion occurs in the second half of the production curve of an oil well, oil field, or the average of total world oil production. The Hubbert peak theory makes predictions of production rates based on prior discovery rates and anticipated production rates. Hubbert curves predict that the production curves of non-renewing resources approximate a bell curve. Thus, when the peak of production is passed, production rates enter an exponential decline.[3]
The American Petroleum Institute estimated in 1999 the world's oil supply would be depleted between 2062 and 2094, assuming total world oil reserves at between 1.4 and 2 trillion barrels (220 and 320 km3) and consumption at 80 million barrels per day (13,000,000 m3/d).[4] In 2004, total world reserves were estimated to be 1.25 trillion barrels (199 km3) and daily consumption was about 85 million barrels (13,500,000 m3), shifting the estimated oil depletion year to 2057.[1] A study published in the journal Energy Policy by researchers from Oxford University, however, predicted demand would surpass supply by 2015 (unless constrained by strong recession pressures caused by reduced supply or government intervention).[5]
The United States Energy Information Administration predicted in 2006 that world consumption of oil will increase to 98.3 million barrels per day (15,630,000 m3/d) (mbd) in 2015 and 118 mbd in 2030.[6] With 2009 world oil consumption at 84.4 mbd,[7] reaching the projected 2015 level of consumption would represent an average annual increase between 2009 and 2015 of 2.7% per year while EIA's own figures show declining consumption[7] and declining supplies[8] during the 2005-2009 period.
Contents
Resource availability
Main article: Oil reservesThe world's oil supply is fixed because petroleum is naturally formed far too slowly to be replaced at the rate at which it is being extracted. Over many millions of years, plankton, bacteria, and other plant and animal matter become buried in sediments on the ocean floor. When conditions are right – a lack of oxygen for decomposition, and sufficient depth and temperature of burial – these organic remains are converted into petroleum compounds, while the sediment accompanying them is converted into sandstone, siltstone, and other porous sedimentary rock. When capped by impermeable rocks such as shale, salt, or igneous intrusions, they form the petroleum reservoirs which are exploited today.[1][9]
Production decline models
Main article: Hubbert peak theoryOil production decline occurs in a predictable manner based on geological circumstances, governmental policies, and engineering practices. The shape of the decline curve varies depending upon whether one considers a well, a field, a set of fields, or the world.
Oil well production decline
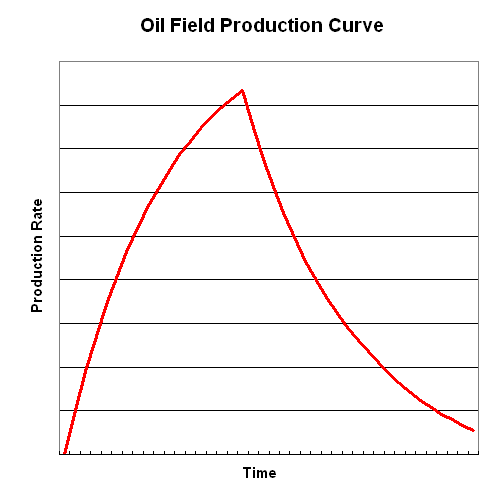
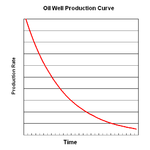 Theoretical oil well production curve.
Oil well production curves typically end in an exponential decline.[3] At natural rates, oil well production curves appear similar to a bell curve, a phenomenon known as the Hubbert curve. The typical decline is a rapid drop in production, and eventually a leveling off to a point at which they no longer produce profitable amounts.[3] Such wells are referred to as marginal or stripper wells.
The shape of production curve of an oil well can be affected by a number of factors:
-
- Well may be restricted by choice by lack of market demand or government regulation. This flattens the peak of the curve, but will not change the well's total production significantly.
- Hydraulic fracturing (fracing) or acidizing may be used to cause a sharp spike in production, and may increase the recoverable reserves of a given well.
- The field may undergo a secondary or tertiary recovery project, discussed in the next section.
Oil field production decline
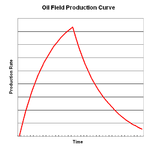 Typical oil field production curve[citation needed].
Each individual oil well is a portion of a larger fixed area oil field. As with individual wells, discovery and production amounts of oil fields generally average to a similar bell shaped production curve. Eventually, when the field is completely drilled out, a field's production goes into a sharp decline as the average production of its wells enter decline. As this decline levels off, production can continue at relatively low rates. A number of oil fields in the U.S. have been producing for over 100 years.[citation needed]
Oil field production curves can be modified by a number of factors:
-
- Production may be restricted by market conditions or government regulation.
- A secondary recovery project, such as water or gas injection, can repressurize the field and improve the production rate temporarily. However, it will not change the total production amount over the life of the field. Eventually the field will go into a steeper than normal decline.
- the field may undergo an enhanced oil recovery project, such as drilling of wells for injection of solvents, carbon dioxide, or steam. This can be very expensive but allows more oil to be coaxed out of the rock, increasing the ultimate production of the field.
Multi-field production decline
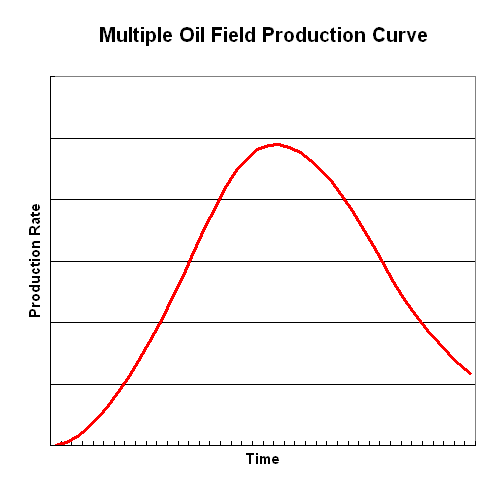
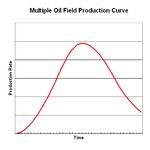 Multiple oil field production curve.
Most oil is found in a small number of very large oil fields. If oil fields are discovered at a constant rate until they have all been found, the combined production of fields will yield a curve such as the one at right. Production starts off slowly, rises faster and faster, then slows down and flattens until it reaches a peak. After the production peak, production enters an exponential decline, eventually flattening out. Oil production may never actually reach zero, but eventually becomes very low. Factors which can modify this curve include:
-
- Inadequate demand for oil, which reduces steepness of the curve and pushes its peak into the future.
- Sharp price increases when the production peak is reached, as production fails to meet demand. If price increases cause a sharp drop in demand, a dip in the top of the curve may occur.
- Development of new drilling technology or marketing of unconventional oil can reduce the steepness of the decline as more oil is produced than initially anticipated.
United States production decline
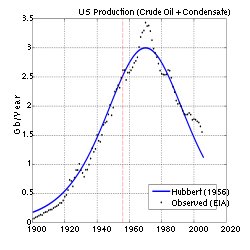 U.S. oil production (crude oil only) and Hubbert's high estimate (a multi-field projection)
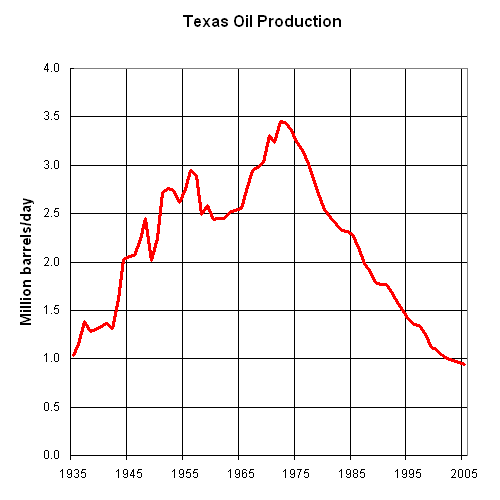
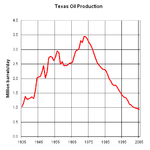 Texas oil field production decline curve.
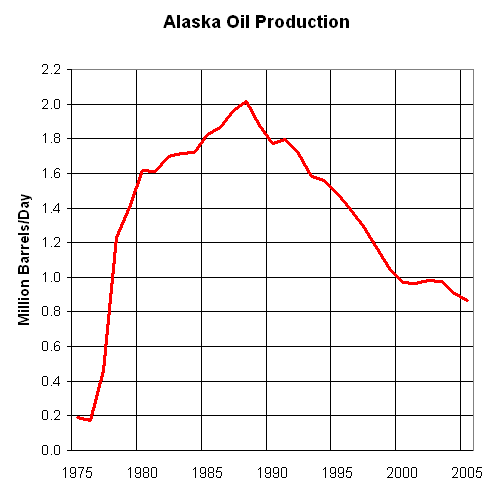
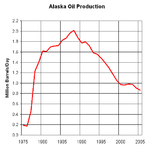 Alaska oil field production decline curve.
Oil production in the United States has followed the theoretical Hubbert curve. U.S. oil production reached its peak in 1970 and by the mid-2000s it had fallen to 1940s levels. In 1950, the United States produced over half the world's oil, but by 2005 that proportion had dropped to about 8%. In 2005, U.S. crude oil imports were twice as high as domestic production.
The production peak in 1970 was predicted in 1956 by Hubbert. By 1972 all import quotas and controls on U.S. domestic production had been removed. Oil companies began drilling large numbers of oil wells on a nationwide scale. Despite this, and despite the quadrupling of prices during the 1973 oil crisis, the production decline has, to date, proven irreversible.
The actual U.S. production curve does deviate from Hubbert's 1956 curve in some significant ways:
-
- When oil surpluses created a glut on the market and low prices began causing demand and production curves to rise, regulatory agencies such as the Texas Railroad Commission stepped in to restrain production.[1]
- The curve peaked at a sharp point rather than gradually flattening out. This occurred because as consumption began to approach production limits, oil companies drilled out all their existing fields as fast as they could, and many of those fields peaked simultaneously.
- Production fell after 1970, but started to recover and reached a lower secondary peak in 1988. This occurred because the supergiant Prudhoe Bay field in Alaska was only discovered in 1968, and the Trans-Alaska Pipeline System (TAPS) was not completed until 1977. After 1988, Alaska production peaked and total U.S. production began to decline again. By 2005, Prudhoe Bay had produced over 75% of its oil.
World oil production
Further information: Peak oil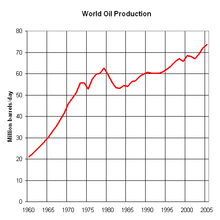 World oil field production curve.
World oil production has followed a typical Hubbert curve, rising over the past century with only a few dips. The 1970 production peak in the U.S. caused many people to begin to question when the world production peak would occur. The peak of world production is known as Peak oil. By the mid-2000s, all of the world's major oil producing countries except Saudi Arabia were producing at maximum capacity (many having peaked in production), and some experts such as Matthew Simmons were questioning whether even Saudi Arabia had any reserve capacity left.
Industry observers have pointed to the similarities between the global production curve in mid-2000s and that of the United States in the 1970s.
- The oil price increases since 2003 were preceded by a decade of production cutbacks in OPEC countries in an attempt to keep prices high despite an oil glut. This is similar to production cutbacks in Texas and other states to maintain prices despite an oil glut in the decade prior to the 1973 oil crisis.
- World oil prices reached record inflation adjusted highs beginning in 2008, but new oil did not appear on the market, as the theory of supply and demand would predict. This is reminiscent of price increases in the United States in the 1970s when U.S. oil production started to decline despite record high prices and record drilling by oil companies.
- There are serious doubts about whether OPEC countries really have the oil reserves they claim. This is similar to the illusionary oil reserves that U.S. oil companies claimed to have in the decade prior to the 1973 and 1979 oil crisis. In the 1970s, those companies were unable to produce as much oil as they had predicted, and production went down instead of up.
Implications of a world peak
Further information: Possible effects and consequences of Peak OilA peak in oil production could result in a worldwide oil shortage, or it could not even be noticed as demand decreases in conjunction with increased prices. While past shortages stemmed from a temporary insufficiency of supply, crossing Hubbert's Peak would mean that the production of oil would continue to decline, and that demand for these products must be reduced to meet supply. The effects of such a shortage would depend on the rate of decline and the development and adoption of effective alternatives.
If alternatives were not forthcoming, it has been speculated that the numerous products produced with oil would become scarcer, leading to at the very least lower living standards in developed and developing countries alike, and possibly in the worst case to the collapse of the entire international banking system, which could not likely sustain itself without the prospect of growth[citation needed]. The political situation may change dramatically, with potential wars between countries over access to dwindling supplies. Accordingly, inequalities between various countries and regions of the world may become exacerbated.
Catastrophe
Economic growth and prosperity since the industrial revolution have, in large part, been due to increased efficiencies in the use of better and higher concentrations of energy in fossil fuels.[citation needed] The use of fossil fuels allows humans to participate in takedown, which is the consumption of energy at a greater rate than it is being replaced. Some believe that decreasing oil production portends a drastic impact on human culture and modern technological society, which is currently heavily dependent on oil as a fuel and chemical feedstock. For example, over 90% of transportation in the United States relies on oil.
Some envisage a Malthusian catastrophe occurring as oil becomes increasingly inefficient to produce, others have learned from the examples demonstrated in mature basins and applied those operational procedures to these basins to preserve their operational tempo. Since the 1940s, agriculture has dramatically increased its productivity, due largely to the use of chemical pesticides, fertilizers, and increased mechanisation. This process has been called the Green Revolution. The increase in food production has allowed world population to grow dramatically over the last 50 years. Pesticides rely upon oil as a critical ingredient, and fertilizers require natural gas. Farm machinery also requires oil.
Arguing that in today's world every joule one eats requires 5–15 joules to produce and deliver, some have speculated that decreasing supply of oil will cause modern industrial agriculture to collapse, leading to a drastic decline in food production, food shortages and possibly even mass starvation. However, most or all of the uses of fossil fuels in agriculture can be replaced with alternatives. For example, by far the biggest fossil fuel input to agriculture is the use of natural gas as a hydrogen source for the Haber-Bosch fertilizer-creation process.[10] Natural gas is used simply because it is the cheapest currently-available source of hydrogen; were that to change, other sources, such as electrolysis powered by solar energy, could be used to provide the hydrogen for creating fertilizer without relying on fossil fuels.
Oil shortages may force a move to lower input "organic agriculture" methods, which may be more labor-intensive and require a population shift from urban to rural areas, reversing the trend towards urbanisation which has predominated in industrial societies; however, some organic farmers using modern organic-farming methods have reported yields as high as those available from conventional farming, but without the use of fossil-fuel-intensive artificial fertilizers or pesticides.[11][12][13][14]
Another possible effect would derive from modern transportation and housing infrastructure. A large proportion of the developed world's population live in suburbs, a type of low-density settlement designed with the automobile in mind. Commentators such as James Howard Kunstler argue that because of its reliance on the automobile, the suburb is an unsustainable living arrangement; the implications of peak oil would leave many suburb-dwellers unable to afford fuel for their cars, and force them to move to higher density, more walkable areas. In effect, surburbia would comprise the "slums of the future." A movement to deal with this problem early, called "New Urbanism," seeks to develop the suburbs into higher density neighborhoods and use high density, mixed-use forms for new building projects.
Recession
A more modest scenario, assuming a slower rate of depletion and a smooth transition to alternative energy sources could cause substantial economic hardship such as a recession or depression due to higher energy prices. Historically, there is a close correlation in the timing of oil price spikes and economic downturns. Inflation has also been linked to oil price spikes. However, economists disagree on the strength and causes of this association. Conversely, the recessions of the early 1970s and early 1980s were associated with a relatively brief period of somewhat dwindling energy availability; the possible future increase in oil prices might be much higher and last longer. See Energy crisis.
Rising food prices
Main article: food vs fuelRising oil prices cause rising food prices in three ways. First, increased equipment fuel costs drive higher prices. Second, transportation costs increase retail prices. Third, higher oil prices are causing farmers to switch from producing food crops to producing biofuel crops. [15][16] The law of supply and demand predicts that if fewer farmers are producing food the price of food will rise.[17]
See also
- Energy law
- Oil Megaprojects
- ACEGES
Further reading
- Kenneth S. Deffeyes. Hubbert's Peak : The Impending World Oil Shortage, Princeton University Press (August 11, 2003), ISBN 0–691–11625–3.
- Richard Heinberg. The Party's Over: Oil, War, and the Fate of Industrial Societies, New Society Press ISBN 0–86571–482–7
- Mathew R. Simmons. Twilight in the Desert: The Coming Saudi Oil Shock and the World Economy, Wiley (June 10, 2005), ISBN 0–471–73876-X
References
- ^ a b c d "The End of Cheap Oil". National Geographic. June 2004. http://ngm.nationalgeographic.com/ngm/0406/feature5/fulltext.html.
- ^ "Tapped Out". http://ngm.nationalgeographic.com/2008/06/world-oil/roberts-text. Retrieved 2008-06-18.
- ^ a b c M. King Hubbert (1956-06). "Nuclear Energy and the Fossil Fuels 'Drilling and Production Practice'" (PDF). API. p. 36. http://www.hubbertpeak.com/hubbert/1956/1956.pdf. Retrieved 2008-04-18.
- ^ "FYI". Popular Science. March 1999.
- ^ Nick A. Owen, Oliver R. Inderwildi, David A. King (2010). "The status of conventional world oil reserves—Hype or cause for concern?". Energy Policy 38 (8): 4743. doi:10.1016/j.enpol.2010.02.026.
- ^ http://www.eia.doe.gov/oiaf/ieo/pdf/ieoreftab_4.pdf
- ^ a b Total Consumption of Petroleum Products (Thousand Barrels Per Day)
- ^ Total Oil Supply (Thousand Barrels Per Day)
- ^ Abhijit Y. Dandekar. Petroleum reservoir rock and fluid properties. CRC Press, 2006. p. 1. ISBN 0849330432
- ^ http://www.carbohydrateeconomy.org/library/admin/uploadedfiles/How_Much_Energy_Does_it_Take_to_Make_a_Gallon_.html
- ^ http://www.biotech-info.net/Alex_Avery.html
- ^ http://extension.agron.iastate.edu/organicag/researchreports/nk01ltar.pdf
- ^ http://www.cnr.berkeley.edu/~christos/articles/cv_organic_farming.html
- ^ http://www.terradaily.com/news/farm-05c.html
- ^ Food versus fuel debate escalates
- ^ How Food and Fuel Compete for Land by Lester Brown – The Globalist > > Global Energy
- ^ "The Economist – The End Of Cheap Food". December 6, 2007. http://www.economist.com/research/articlesBySubject/displaystory.cfm?subjectid=7216688&story_id=10252015.
External links
- http://www.oilposter.org – Free for teachers.
- Evolutionary psychology and peak oil: A Malthusian inspired "heads up" for humanity by Dr. Michael Mills
- Can The United States Drill Its Way to Energy Security? (from the December 2008 issue of the Journal of Energy Security)
- Peak Oil and Natural Gas Depletion: The world most serious question (Published June 12, 2003)
- Energy Export Databrowser - A visual review of production and consumption trends for individual nations; data from the British Petroleum Statistical Review.
Peak Oil Core issues 
Results/responses Hirsch report · Oil Depletion Protocol · Price of petroleum · 2000s energy crisis · Energy crisis · Export Land Model · Food vs fuel · Oil reserves · Pickens Plan · Swing producer · Transition TownsPeople Books Films A Crude Awakening · Collapse · The End of Suburbia · Oil Factor · PetroApocalypse Now? · How Cuba Survived Peak Oil · What a Way to GoOrganizations Other "peaks" Categories:- History of the petroleum industry
- Economic theories
- Futurology
- Peak oil
- Economic problems
-


Wikimedia Foundation. 2010.