- Price of petroleum
-
This article is about the price of crude oil. For information about derivative motor fuels, see gasoline and diesel usage and pricing. For detailed history of price movements since 2003, see 2003 to 2011 world oil market chronology.
 Brent barrel petroleum spot prices, May 1987 – April 2011. Due to exchange rate fluctuations, the real price line is only relevant to the United States and countries with a currency tied to the U.S. dollar at a constant rate throughout the period.
 Weekly reports on crude oil inventories or total stockpiles in storage facilities like these tanks have a strong bearing on oil prices
The price of petroleum as quoted in news generally refers to the spot price per barrel (159 liters) of either WTI/light crude as traded on the New York Mercantile Exchange (NYMEX) for delivery at Cushing, Oklahoma, or of Brent as traded on the Intercontinental Exchange (ICE, into which the International Petroleum Exchange has been incorporated) for delivery at Sullom Voe.
The price of a barrel of oil is highly dependent on both its grade, determined by factors such as its specific gravity or API and its sulphur content, and its location. Other important benchmarks include Dubai, Tapis, and the OPEC basket. The Energy Information Administration (EIA) uses the imported refiner acquisition cost, the weighted average cost of all oil imported into the US, as its "world oil price".
The demand for oil is highly dependent on global macroeconomic conditions. According to the International Energy Agency, high oil prices generally have a large negative impact on the global economic growth.[1]
The Organization of the Petroleum Exporting Countries (OPEC) was formed in 1960[2] to try and counter the oil companies cartel, which had been controlling posted prices since the so-called 1927 Red Line Agreement and 1928 Achnacarry Agreement, and had achieved a high level of price stability until 1972.
The price of oil underwent a significant decrease after the record peak of US$145 it reached in July 2008. On December 23, 2008, WTI crude oil spot price fell to US$30.28 a barrel, the lowest since the financial crisis of 2007–2010 began, and traded at between US$35 a barrel and US$82 a barrel in 2009.[3] On 31 January 2011, the Brent price hit $100 a barrel for the first time since October 2008, on concerns about the political unrest in Egypt.[4]
Contents
History
Further information: 1967 Oil Embargo, 1973 oil crisis, 1979 energy crisis, 1980s oil glut, and Oil price increase of 1990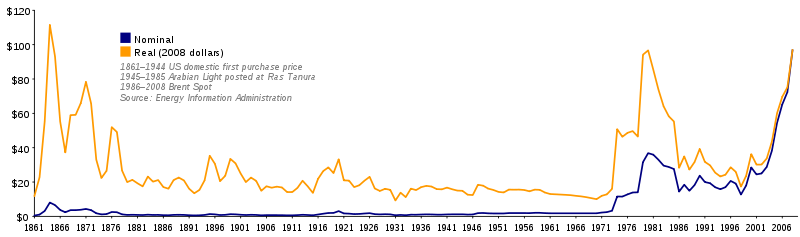 Long-term oil prices, 1861-2008 (orange line adjusted for inflation, blue not adjusted). Due to exchange rate fluctuations, the orange line represents the price experience of U.S. consumers only.
Price history before 2003
A low point was reached in January 1999 of 17 USD per barrel, after increased oil production from Iraq coincided with the Asian Financial Crisis, which reduced demand. Prices then increased rapidly, more than doubling by September 2000 to $35, then fell until the end of 2001 before steadily increasing, reaching $40–50 by September 2004.[5]
Price history from 2003 onwards
Main article: 2003 to 2011 world oil market chronologyFurther information: 2000s energy crisisBenchmark pricing
Main article: Benchmark (crude oil)After the collapse of the OPEC-administered pricing system in 1985, and a short lived experiment with netback pricing, oil-exporting countries adopted a market-linked pricing mechanism.[6] First adopted by PEMEX in 1986, market-linked pricing received wide acceptance and by 1988 became and still is the main method for pricing crude oil in international trade.[6] The current reference, or pricing markers, are Brent, WTI , and Dubai/Oman.[6]
Market listings
Main article: Commodities marketsOil is marketed among other products in commodities markets. See above for details. Widely traded oil futures, and related natural gas futures, include:[7]
- Petroleum
- Nymex Crude Future
- Dated Brent Spot
- WTI Cushing Spot
- Nymex Heating Oil Future
- Nymex RBOB Gasoline Future
- Natural gas
- Nymex Henry Hub Future
- Henry Hub Spot
- New York City Gate Spot
Most of the above oil futures have delivery dates in all 12 months of the year.[8]
Speculation
The surge in oil prices in the past several years has led some experts to argue that at least some of the rise is due to speculation in the futures markets.[9][10] This has led to an investigation, which reached an interim conclusion that speculation was largely not responsible for the rise. Economist James K. Galbraith believes that much of the rise is due to the "Enron loophole" drafted in a rider by former Texas senator Phil Gramm, which allowed energy futures to avoid Commodity Futures Trading Commission oversight. Galbraith cites Masters, a hedge fund manager, who observed that index speculation tied to commodities by pension funds and other investment vehicles rose from $13 billion in 2003 to $250 billion in 2008. Galbraith observed that with Goldman Sachs predicting a rise in the price to $200 and Gazprom $250, suppliers may react to the rise by restricting supply until they can sell their product at a higher price.[11] In 2009, Seismic Micro-Technology conducted a survey of geophysicists and geologists about the future of crude oil. Of the survey participants 80 percent predicted the price for a barrel of oil will rise to be somewhere between $50 and $100 per barrel by June 2010.[12] Another 50 percent saying it will rise even further to $100 to $150 a barrel in the next five years.[12]
Oil prices could go to $200- $300 a barrel if the world's top crude exporter Saudi Arabia is hit by serious political unrest, according to former Saudi oil minister Sheikh Yamani. Yamani has said that underlying discontent remained unresolved in Saudi Arabia. "If something happens in Saudi Arabia it will go to $200 to $300. I don't expect this for the time being, but who would have expected Tunisia?" Yamani told Reuters on the sidelines of a conference of the Centre for Global Energy Studies (CGES) which he chaired on April 5th 2011.[13]
Futures investigation
The U.S. Commodity Futures Trading Commission (CFTC) announced "Multiple Energy Market Initiatives" on May 29, 2008. Part 1 is "Expanded International Surveillance Information for Crude Oil Trading." The CFTC announcement stated it has joined with the United Kingdom Financial Services Authority and ICE Futures Europe in order to expand surveillance and information sharing of various futures contracts.[14] This announcement has received wide coverage in the financial press, with speculation about oil futures price manipulation.[15] [16] [17]
The interim report by the Interagency Task Force, released in July, found that speculation had not caused significant changes in oil prices and that fundamental supply and demand factors provide the best explanation for the crude oil price increases. The report found that the primary reason for the price increases was that the world economy had expanded at its fastest pace in decades, resulting in substantial increases in the demand for oil, while the oil production grew sluggishly, compounded by production shortfalls in oil-exporting countries.
The report stated that as a result of the imbalance and low price elasticity, very large price increases occurred as the market attempted to balance scarce supply against growing demand, particularly in the last three years. The report forecast that this imbalance would persist in the future, leading to continued upward pressure on oil prices, and that large or rapid movements in oil prices are likely to occur even in the absence of activity by speculators. The task force continues to analyze commodity markets and intends to issue further findings later in the year.
See also
- 2007–2008 world food price crisis
- Chronology of world oil market events (1970-2005)
- Asymmetric price transmission
- Elasticity (economics)
- Energy crisis
- Efficient energy use
- Food vs fuel
- Gasoline usage and pricing
- Peak oil
- Simmons–Tierney bet
- Stagflation
- Supply and Demand
References
- ^ http://www.iea.org/Textbase/Papers/2004/High_Oil_Prices.pdf
- ^ http://www.slate.com/id/2170040/nav/tap3/ , http://wps.aw.com/aw_carltonper_modernio_4/0,9313,1424964-content,00.html
- ^ http://tonto.eia.doe.gov/dnav/pet/hist/rwtcd.htm
- ^ Brent crude oil price hits $100 a barrel
- ^ Light Crude Oil (CL, NYMEX): Monthly Price Chart
- ^ a b c Mabro, Robert; Organization of Petroleum Exporting Countries (2006). Oil in the 21st century: issues, challenges and opportunities. Oxford Press. pp. 351. ISBN 0199207380, 9780199207381.
- ^ "Bloomberg Energy Prices". Bloomberg.com. http://www.bloomberg.com/markets/commodities/energyprices.html. Retrieved 2008-06-11.
- ^ List of Commodity Delivery Dates on Wikinvest
- ^ "Oil Prices Are All Speculation" by Ed Wallace in Business Week June 27, 2008
- ^ "‘Perhaps 60% of today’s oil price is pure speculation’" article by F. William Engdahl in Global Research May 2, 2008
- ^ Galbraith JK. (2008). How to Burn the Speculators. Mother Jones.
- ^ a b E&P Magazine, Geologists positive about future of oil and gas, June 10, 2009
- ^ http://af.reuters.com/article/energyOilNews/idAFLDE7340MU20110405?pageNumber=3&virtualBrandChannel=0&sp=true Retrieved April-07-2011
- ^ "CFTC Announces Multiple Energy Market Initiatives". CFTC. Release: 5503-08. May 29, 2008. Archived from the original on 2008-06-01. http://web.archive.org/web/20080601035005/http://www.cftc.gov/newsroom/generalpressreleases/2008/pr5503-08.html. Retrieved 2008-06-11.
- ^ "CFTC in talks to plug the 'London loophole'". The Financial Times. 2008-06-10. http://us.ft.com/ftgateway/superpage.ft?news_id=fto061020081403134150&page=2. Retrieved 2008-06-11.
- ^ Mufson, Steven (2008-05-30). "Probe of Crude Oil Trading Disclosed". Washington Post. http://www.washingtonpost.com/wp-dyn/content/article/2008/05/29/AR2008052903627.html. Retrieved 2008-06-11.
- ^ "Government investigates oil markets". CNN Money. 2008-05-30. http://money.cnn.com/2008/05/29/markets/oil_markets_investigation.ap/index.htm?postversion=2008052913. Retrieved 2008-06-11.
External links
- Gasoline and diesel fuel prices, EIA, Department of Energy.
- Gasoline and diesel fuel prices in Europe
- Skyrocketing oil prices pummel U.S. national security.
- FACTBOX-The World's Oil Shocks (Planet Ark)
- CME (formerly NYMEX) future prices for light sweet crude, Session Overview.
- History and Analysis of Crude Oil Prices.
- NYMEX:BZ is the most commonly quoted price for Brent crude oil
- [1] A fair price for motor fuel in the United States
- Official monthly oil price, supply and demand discussion from OPEC
- Current oil price per barrel and oil news.
- The Oil and Gas Value Chain
- Energy Futures Databrowser Current and historical charts of NYMEX energy futures chains.
- Live oil prices NYMEX Crude oil price chart
- Major Oil Stocks Largest oil stocks by volume streaming
- U.S. Energy Information Administration Part of the U.S. Department of Energy, official source of price and other statistical information
.
Categories:- Petroleum economics and industry
- Commodities market
- Pricing
- Petroleum


Wikimedia Foundation. 2010.