- Immigration to Brazil
-
Brazilian immigration (emigration to Brazil) refers to the movement of non-residents to Brazil. It should not be confused with the colonisation of the country by the Portuguese, or with the forcible bringing of people from Africa as slaves.
Immigration has been a very important demographic factor in the composition, structure and history of human population in Brazil, with all its attending factors and consequences in culture, economy, education, racial issues, etc. Brazil has received one of the largest numbers of immigrants in the Western Hemisphere, along with the United States, Argentina and Canada.[1]
Contents
Brief history
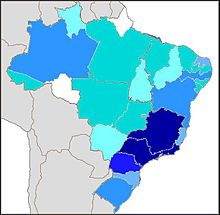 Total of foreign people authorized to work in Brazil by state in 2009.
 People authorized to work in Brazil by origin in 2009. Organized by largest ancestry.U.S. citizenItalianPortugueseChineseSpanishCubanEnglishGermanFrenchJapanese
Maria Stella Ferreira Levy[2] suggests the following periodisation of the process of immigration to Brazil:
- 1. 1820-1876: small number of immigrants (about 6,000 per year), predominance of Portuguese (45.73%), with significant numbers of Germans (12.97%);
- 2. 1877-1903: large number of immigrants (about 71,000 per year), predominance of Italians (58.49%);
- 3. 1904-1930: large number of immigrants (about 79,000 per year), predominance of the Portuguese (36.97%);
- 4. 1931-1963: declining number of immigrants (about 33,500 per year), predominance of the Portuguese (38.45%).
The Brazilian population before immigration
When Brazil was discovered as a new land in the New World by the Portuguese in 1500, its native population was composed of about 2.4 million Amerindians[3] whose ancestors had been living there for the last 15,000 to 20,000 years.[4] During the three decades afterwards, the country remained sparsely inhabited by Europeans. Among those few, mainly Portuguese, most were renegades, criminals banished from Portugal, shipwreck survivors, or mutinous sailors. They integrated into the local tribes, using their superior technology to attain privileged positions among them.[5]
After 1530, the Portuguese started to settle in Brazil in significant numbers. However, Portugal had a small population to develop the exploitation of Brazil. By 1550, the colonists started to bring African slaves. From 1500, when the Portuguese reached Brazil, until its independence in 1822, from 500,000 to 700,000 Portuguese settled in Brazil, 600,000 of whom arrived in the 18th century alone.[6][7] The Portuguese settled in the whole territory, initially remaining near the coast, except in the region of São Paulo, from where the bandeirantes would spread into the hinterland. In the 18th century, large waves of Portuguese settled the country, in the wake of the discovery of gold in the region of Minas Gerais, but the number of Portuguese who settled in Brazil in its colonial era was far lower than of African slaves: from 1550 to 1850, some 4 million slaves were brought to Brazil.[7] This should not be taken as meaning that the population of Brazil before independence was mainly Black: the average survival of an African slave in Brazil was of merely seven years after arrival,[8] implying extremely high mortality rates. Although children born to slave women inherited the slave condition, the Portuguese always relied on slaves purchased from slave traders to replace and increase the work force; the natural growth of the slave population was always very small.[9]
In the early 19th century, Brazil was mainly composed of people of three different origins: the indigenous inhabitants, the Portuguese and their descendants, the Africans and descendants, and, naturally, people of varying degrees of "racial" mixture. In 1872, after the arrival of about 350,000 mostly European immigrants and about 1,150,000 Africans forcibly brought to Brazil as slaves, the first Brazilian Census counted 9,930,478 people in Brazil, of which 3,787,289 (38.14%) Whites, 3,380,172 (34.04%) "pardos", 1.954.452 (19.68%) Blacks, and 386,955 (3.90%) "caboclos".[10]
First period: 1820-1876
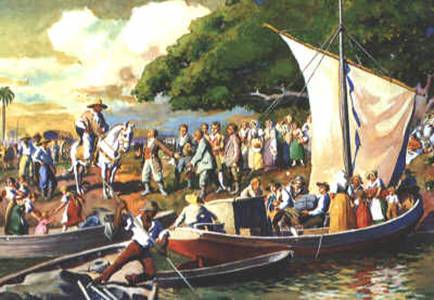
 Arrival of Germans in Southern Brazil.
Immigration properly started with the opening of the Brazilian ports, in 1808. The government began to stimulate the arrival of Europeans to occupy plots of land and become small farmers. In 1812, settlers from the Azores were brought to Espírito Santo and in 1819, Swiss to Nova Friburgo, Rio de Janeiro. After independence from Portugal, the Brazilian Empire focused on the occupation of the provinces of Southern Brazil. It was mainly because Southern Brazil had a small population, vulnerable to attacks by Argentina and the Kaingang Indians.[11]
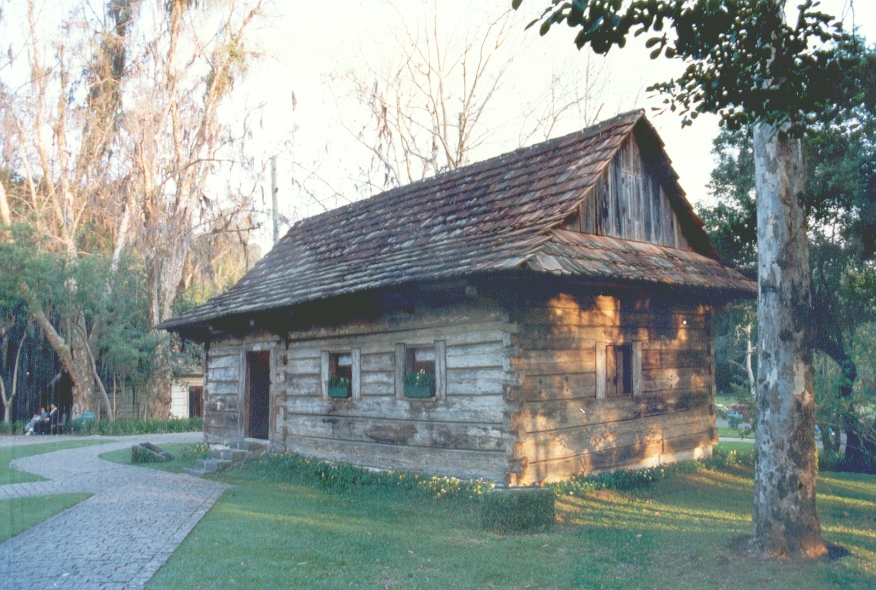
From 1824, immigrants from Central Europe started to populate what is nowadays the region of São Leopoldo, in the province of Rio Grande do Sul. According to Leo Waibel, these German immigrants were mainly "oppressed peasants and former soldiers of the army of Napoleon." In 1830 a bill was passed forbidding the Imperial government from spending money with the settlement of immigrants, which stalled immigration until 1834, when the provincial governments were charged with promoting immigration.[12]
In 1859, Prussia prohibited emigration to Brazil. This was mainly because of complaints that Germans were being exploited in the coffee plantations of São Paulo. Still, between 1820 and 1876, 350,117 immigrants entered Brazil. Of these, 45.73% were Portuguese, 35.74% of "other nationalities," 12.97% Germans, while Italians and Spanish together did not reach 6%. The total number of immigrants per year averaged 6,000.[13] Many immigrants, particularly the Germans, were brought to settle in rural communities as small landowners. They received land, seed, livestock and other items to develop.
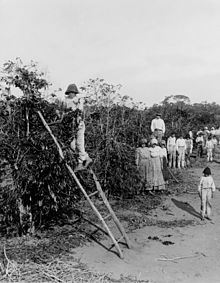
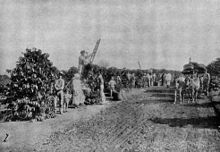 European immigrants working in a coffee plantation in the State of São Paulo.
Second Period: 1877-1903
In the last quarter of the 19th century, the entry of immigrants in Brazil grew strongly. On one hand, Europe underwent a serious demographic crisis, which resulted in increased immigration; on the other hand, the final crisis of Brazilian slavery prompted Brazilian authorities to find solutions for the problem of work force. Consequently, while immigration until 1876 was focused on establishing communities of landowners, during this period, while this older process continued, immigrants were more and more attracted to the coffee plantations of São Paulo, where they became employees or were allowed to cultivate small tracts of land in exchange for their work in the coffee crop.[11] This also coincided with the decreasing availability of better land in southern Brazil - while the German immigrants arriving in the previous period occupied the valleys of the rivers, the Italians arriving in the last quarter of the century settled the mountainous regions of the state.[14]
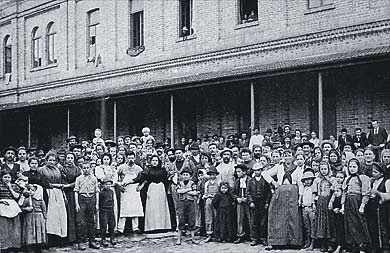
During this period, immigration was much more intense: large numbers of Europeans, especially Italians, started to be brought to the country to work in the harvest of coffee.[15] From 1877 to 1903, almost two million immigrants arrived, at a rate of 71,000 per year[16] Brazil's receiving structure, legislation and settlement policies for immigrants were much less organized than in Canada and the United States at the time. Nevertheless, an Immigrant's Hostel (Hospedaria dos Imigrantes) was built in 1886 in São Paulo, and quick admittance and recording routines for the throngs of immigrants arriving by ship at the seaports of Vitória, Rio de Janeiro, Santos, Paranaguá, Florianópolis and Porto Alegre were established. The São Paulo site alone processed more than 2.5 million immigrants in its almost 100 years of continuous operation. People of more than 70 different nationalities were recorded.
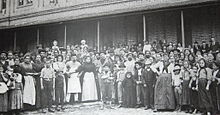 Italian immigrants in the Hospedaria dos Imigrantes, in São Paulo.
In 1850, Brazil declared the end of the slave trade. This had different impacts on the different regions of Brazil. At the time, the region of São Paulo was undergoing a process of economic boom, linked to the expansion of the cultivation of coffee, and consequently needed increased amounts of labour. Other regions, notedly the Northeast, on the contrary, faced economic retraction, and were, consequently, able to dispense workforce. This entailed the replacement of the international slave trade by an internal or interprovincial slave trade, in which Northeastern slaves were sold in large numbers to the Southeast.[17] This temporarily solved the workforce problem in São Paulo and other coffee plantation areas. However, by 1870 the paulista elite came to realise that the Northeastern slaveholders were in fact being able to obtain financial compensation for their slaves, or, in practice, an abolition with compensation.[17] Fears of a situation comparable to the United States, with the division of the country into free provinces and slave provinces arose. Consequently, paulista politicians began to seek measures against the interprovincial traffic, at a time when, anyway, the price of Northeastern slaves was getting higher and higher, due to their increasing scarcity.[17] By the beginning of the 70s, the alternative of the interprovincial trade was exhausted, while the demand for workforce in the coffee plantations continued to expand. Thus the paulista oligarchy sought to attract new workers from abroad, by passing provincial legislation and pressing the Imperial government to organise immigration.[17][18]
Third period: 1904-1930
From 1904 to 1930, 2,142,781 immigrants came to Brazil - making an annual average of 79,000 people. In consequence of the Prinetti Decree of 1902, that forbade subsidised emigration to Brazil, Italian immigration had, at this stage, a drastic reduction: their average annual entries from 1887 to 1903 was 58,000. In this period they were only 19,000 annually. The Portuguese constituted 38% of entries, followed by Spaniards with 22%. From 1914 to 1918, due to World War I, the entry of immigrants of all nationalities decreased.[13] After the War, the immigration of people of "other nationalities" redressed faster than that of Portuguese, Spaniards, and Italians. Part of this category was composed of immigrants from Poland, Russia and Romania, who immigrated probably by political issues, and part by Syrian and Lebanese peoples. Both subgroups included a number of Jewish immigrants, who arrived in the 1920s.
From 1931 to 1963, 1,106,404 immigrants entered Brazil. The participation of the Japanese increased. From 1932 to 1935 immigrants from Japan constituted 30% of total admissions.[13] Prior to this yearly Japanese immigrants were numerically limited to no more than 5% of the current Japanese population.[19]
Fourth Period: 1931-1964
With the radicalisation of the political situation in Europe, the end of the demographic crisis, the decadence of coffee culture, the Revolution of 1930 and the consequent rise of a nationalist government, immigration to Brazil was significantly reduced. The focus shifted to culturally assimilating immigrants and "whitening" the population.[20] From 1931 to 1963, 1,106,404 immigrants entered Brazil. The annual arrival of immigrants fell to 33,500. The Portuguese remained the most significant group, with 39.35%, The participation of the Japanese increased, becoming the second most important group, with 12.79%. Particularly from 1932 to 1935 immigrants from Japan constituted 30% of total admissions.[13]
Immigration also became a more urban phenomenon; most immigrants came for the cities, and even the descendants of the immigrants of the previous periods were moving intensely from the countryside. In the 1950s, Brazil started a program of immigration to provide workers for Brazilian industries. In São Paulo, for example, between 1957 and 1961, more than 30% of the Spanish, over 50% of the Italian and 70% of the Greek immigrants were brought to work in factories.
Current trends
 People authorized to work in Brazil by North American countries in 2009. Organized by number of people.4,040684368
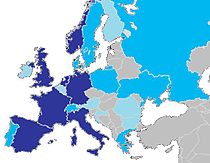 People authorized to work in Brazil by European countries in 2009. Organized by number of people.2,528-648523-184177-050
 People authorized to work in Brazil by South American countries in 2009. Organized by number of people.555-399398-237236-102101-002
During the 1970s Brazil received about 32,000 Lebanese immigrants escaping the civil war, as well as smaller numbers of Palestinians and Syrians.[21][verification needed]
During the 1990s Brazil received small numbers of immigrants from the former republics of Yugoslavia, from Afghanistan and West Africa (mostly Angolans).[22] Recent immigration is mainly constituted by Chinese and Koreans and, in a smaller degree, by Argentines and other Latin American immigrants.[23]
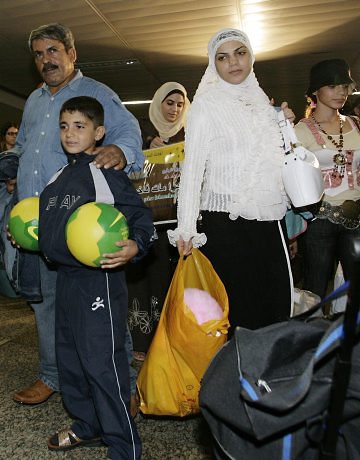
The increase in Bolivian immigrants in Brazil is one of the social consequences of the political crisis affecting that country.[24] The majority of the Bolivians come from cities such as La Paz, Sucre, Santa Cruz de la Sierra, and Cochabamba. Usually they enter Brazil through Cuiabá, in Mato Grosso, or San Mathias, in Bolivia, which borders Caceres, Mato Grosso and Corumbá, in Mato Grosso do Sul.
Between 1,200 and 1,500 Bolivian immigrants come to Brazil every month looking for a job. Most of them work in the illegal textile industry in the Greater São Paulo.[25] There are an estimated 200,000 Bolivians living in the Greater São Paulo, majority is of undocumented immigrants.[26]
In 2009, the country was home to 3,982,000 foreign born people, that represents 2.36% of the Brazilian population. The major work visas concessions were granted for citizens of the United States and the United Kingdom.[27]
In 2010, Brazil is home to 4,251 refugees from 76 different nationalities. The largest refugee ancestries were Angolan (1688), Colombian (583), Congolese (402), Liberian (259), and Iraqi (197).[28]
Immigrants (2005)[4] Country Population Portugal 277,636 Japan 94,297 Italy 68,403 Spain 58,182 Argentina 33,342 Germany 28,055 Visa policy
Main article: Visa policy of BrazilPermanent visas may be granted to individuals intending to establish residence in Brazil. Permanent Visas apply to:[29]
- Technicians or professionals with a work contract pre-approved by the Brazilian Ministry of Labor, National Department of Employment. This visa must be applied for in Brazil.
- Professors, technicians and high-level researchers who wish to immigrate to Brazil to undertake research work in an institution of higher learning or of research in science and technology. This visa must be applied for in Brazil.
- Foreign investors with initial transfer of foreign capital equivalent to no less than US$ 50,000 and an investment plan pre-approved by the Brazilian National Council on Immigration (CNIG). This visa must be applied for in Brazil.
- Administrators, managers or directors hired by a commercial enterprise or civil organization resulting from foreign investment described in item 3 above, with a work contract pre-approved by the Brazilian Ministry of Labor, National Department of Employment. This visa must be applied for in Brazil.
- A retired person, 60 years of age or older, accompanied by up to two dependents, and able to transfer monthly, in accordance with the laws of the country of origin, the amount equivalent to US$ 2,000. In the case of more than two dependents, the applicant must transfer the amount equivalent to US$ 1,000 for each additional dependent.
- Spouse, partners in a common law union regardless of gender, or minor dependent of Brazilian citizen or of a permanent resident of Brazil;
- Ascendants of a Brazilian national or of a permanent resident of Brazil;
- Siblings of a Brazilian citizen or of a permanent resident of Brazil, if orphan, single and under 18 years of age;
- Minor children, grandchildren or great-grandchildren of a Brazilian citizen or of a permanent resident of Brazil.
Immigration law
Federal Constitution
 Portuguese people have a differentiated treatment according to Paragraph 1, Article 12, of the Federal Constitution of Brazil. Due to strong cultural and historical ties between the two countries.
Article 12. The following are Brazilians:
II - naturalized:
a) those who, as set forth by law, acquire Brazilian nationality, it being the only requirement for persons originating from Portuguese-speaking countries the residence for 1 (one) uninterrupted year and good moral repute;
b) foreigners of any nationality, resident in the Federative Republic of Brazil for over 15 (fifteen) uninterrupted years and without criminal conviction, provided that they apply for the Brazilian nationality.
Paragraph 1. The rights inherent to Brazilians shall be attributed to Portuguese citizens with permanent residence in Brazil, if there is reciprocity in favour of Brazilians, except in the cases stated in this Constitution.
Paragraph 2. The law may not establish any distinction between born and naturalized Brazilians, except in the cases stated in this Constitution.[30]
Statute of Foreigner
Article 112. Are conditions for the granting of naturalization:
I - civilian capacity, according to Brazilian law;
II - to be registered as permanent resident in Brazil;
III - continuous residence in the territory for a minimum period of 4 (four) years immediately preceding the application for naturalization;
IV - read and write the Portuguese language, considering the conditions of naturalizing;
V - exercise of occupation or possession of sufficient assets to maintain itself and the family;
VI - proper procedure;
VII - no complaint, indictment in Brazil or abroad for a felony that is threatened in minimum sentence of imprisonment, abstractly considered, more than 1 (one) year.
VIII - good health.
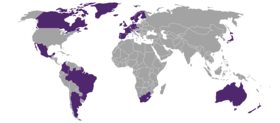 Immigration equality around the world.Recognition of same-sex couples to immigrationUnknown/Ambiguous
Article 113.The period of residence prescribed in Article 112, item III, may be reduced if the naturalizing fill any of the following conditions:
I - have a child or spouse of Brazil;
(Including same-sex spouse, see also: Same-sex immigration policy in Brazil)
II - be son of a Brazilian;
III - have provided or can provide relevant services to Brazil, in the opinion of the Minister of Justice of Brazil;
IV - commend themselves by their professional, scientific or artistic; or
V - to be owner in Brazil, real estate, whose value is equal to at least a thousand times the greatest value of reference, or be provided with industrial funds of equal value, or hold quota shares or amount of paid-in least identical in commercial or civil society, aimed principally and permanently, the operation of industrial or agricultural activities.
Sole Paragraph. The residence will be at least 1 (one) year, in cases of items I, II, and III; 2 (two) years in Item IV; and 3 (three) years in Item V.[31]
Amnesty

Since the 1980s, the Brazilian government has offered amnesty to foreigners in irregular situation[32] in four different campaigns, benefiting tens of thousands of foreigners living in Brazil. The latest campaign began in July 2009 by presidential decree, and though it officially ended at the close of 2009, some cases are still pending. Until now, 41,816 foreigners received amnesty through the 2009 amnesty program, though there are another 2,000 cases expected to be finished in early 2010.[dated info] Though the large majority of immigrants live in São Paulo, other cases were based largely in Rio de Janeiro and Paraná. The breakdown by country/continent is the following: 16,881 Bolivians, 5,492 Chinese, 4,642 Peruvians, 4,135 Paraguayans, 2,700 Africans (including North Africa), 2,390 Europeans, 1,129 Koreans, 469 Argentines, 274 Americans (U.S. citizens), 186 Cubans.
While foreigners who received amnesty obtained the right to work and access health and education services, they are unable to vote or run for public office. They may opt to apply for citizenship after a probation period of residency in order to obtain these rights. Officially, amnesty intends to cut down on illegal activity and human rights violations, particularly with Bolivians in São Paulo. But it seems to fit in with the Lula administration's international policies, including ramped up diplomacy and establishing ties with other nations, but also establishing itself as a competitor with developed countries. By showing that it is a center for immigrants in the Western Hemisphere, particularly in South America, and more importantly, that it is supposedly a benevolent and welcoming country for immigrants, it helps Brazil's international public image.[33]
Those who would benefit from the amnesty, following publication of the law in the Brazilian Official Gazette in July 2009, have up to 180 days after the time of their temporary residence permit (valid for 2 years) to apply. They must also aver their clean criminal record or submit a recent, official document of good conduct from the originating country. During these two years, they must not exceed 90 consecutive days spent abroad. Ninety days prior to the expiration of the temporary residence permit, they must aver their self-sufficiency in Brazil. If they can prove they are eligible for a permanent residence permit. Only ten years after receiving a permanent residence permit may be eligible for naturalization to be Brazilian.[34]
The result of immigration to Brazil
European diaspora
 European immigrants and a Brazilian coffee plantation.
In one hundred years (1872–1972) at least 5,350,889 immigrants came to Brazil, of whom 31.06% were Portuguese, 30.32% Italians, 13.38% Spaniards, 4.63% Japanese, 4.18% Germans and 16.42% of other unspecified nationalities.[6]
In 1897, São Paulo had twice as many Italians as Brazilians in the city. In 1893, 55% of the city´s population was composed by immigrants and in 1901 more than 80% of the children were born to a foreign-born parents.[5] According to the 1920 census, 35% of São Paulo city's inhabitants were foreign born, compared to 36% in New York City. São Paulo's multicultural population could be compared to any major American city. About 75% of the immigrants were Latin Europeans, particularly from three major sources: Italy, Portugal and Spain. The rest came from different parts of Europe, the Middle East and Japan.[35] Some areas of the city remained almost exclusively settled by Italians until the arrival of waves of migrants from other parts of Brazil, particularly from the Northeast, starting in the late 1920s.
According to historian Samuel H. Lowrie, in the early 20th century the society of São Paulo was divided in three classes:[36]
- The high group: composed of graduated people, mainly by Brazilians born to Brazilian parents, who were related to the high-class farmers or other people with privileges.
- The working class: composed of immigrants and their second and third generations descendants. They were the most numerous group, mainly factory workers or traders.
- The semi-dependent group: composed of former slaves and low-class workers of the Empire.
Owners of industries in Sao Paulo(1962) [6] Ethnic origin Percentage Italians 34,8% Brazilians 15,7% Portuguese 11,7% Germans 10,3% Syrians and Lebanese 9,0% Russians 2,9% Austrians 2,4% Swiss 2,4% Other Europeans 9,1% Others 2,0% According to Lowrie, the fact that Brazil already had a long history of racial mixture and that most of the immigrants in São Paulo came from Latin European countries, reduced the cases of racism and mutual intolerance. However, the Brazilian high class was more intolerant, with most of them marrying other members of the elite. In some cases, to marry an immigrant was accepted if the person had achieved fortune or had some prestige. Lowrie reports that as much as 40% of the São Paulo high-class society mixed with an immigrant within the next three generations.
While in São Paulo the Italians predominated, in the city of Rio de Janeiro the Portuguese remained as the main group. In 1929, as many as 272,338 Portuguese immigrants were recorded in the Federal District of Brazil (nowadays the city of Rio de Janeiro), more Portuguese born people than any other city in the world, except for Lisbon (which had 591,939 inhabitants in 1930).[37]
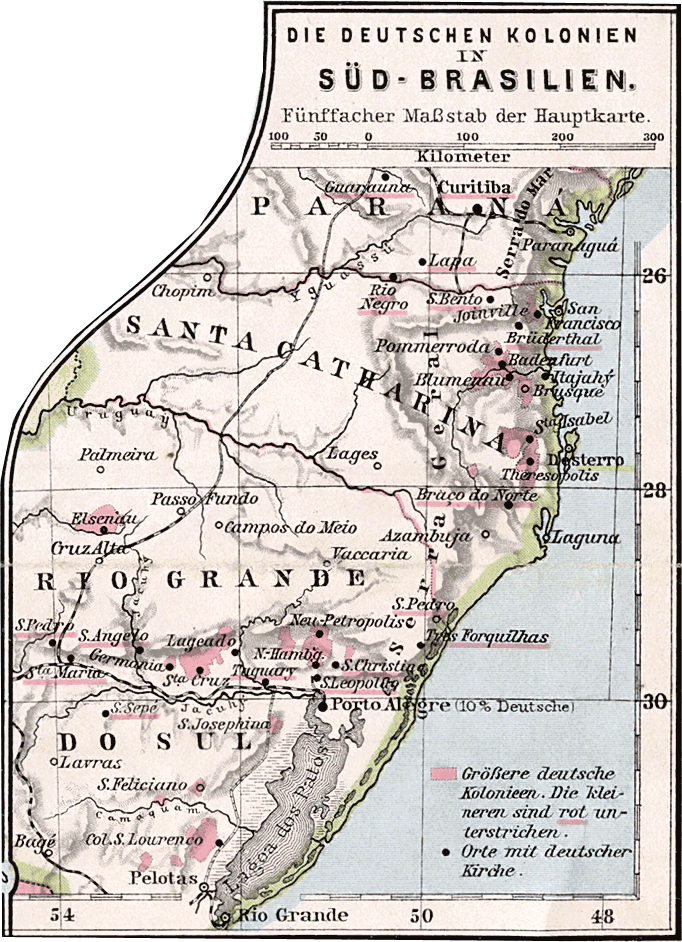
São Paulo City in 1886 Immigrants Percentage of immigrants in foreign born population [7] Italians 47,9% Portuguese 29,3% Germans 9,9% Spanish 3,2% São Paulo City in 1893 Year Immigrants Percentage of the City [8] Italians 45,457 35% Portuguese 14,437 11% Spanish 4,818 3,7% Rio de Janeiro City(Guanabara) Year Immigrants Percentage of the City[2] [9] 1872 84,283 30,65% 1890 124,352 / 155,202 23,79% / 29,69% 1900 195,894 24,14% 1906 210,515 25,94% 1920 239,129 20,65% 1940 228,633 12,96% 1950 210,454 8,85% Rio de Janeiro City(1890) Group Population Percentage of the City [10] Portuguese immigrants 106,461 20,36% Brazilians who were born to a Portuguese father or mother 161,203 30,84% Portuguese immigrants and descendents 267,664 51,2% Rio de Janeiro City in 1940(Guanabara) Immigrants Population [2] Portuguese 154,662 Italians 17,457 Spanish 12,212 Germans 10,185 Japanese 538 Others 33,579 In the South of Brazil, there were three main groups of immigrants: Germans, Italians and Slavs (mainly Poles and Ukrainians). The Germans had been settling Southern Brazil since 1824. The first settlers came from Holstein, Hamburg, Mecklenburg-Vorpommern and Hannover. Later, people from Hunsrück and Rhineland-Palatinate predominated. There were also people from Pomerania, Westphalia and Württemberg. These immigrants were attracted to work as small farmers in the region of São Leopoldo. As a result of the great internal migration of people in Southern Brazil, Germans and second generation descendants started to move to other areas of the Province.
A similar process has occurred in Santa Catarina, with initially two main destinations for German immigrants (Blumenau, created in 1850, and Joinville in 1851) and then the immigrants or their descendants moved to other areas. Arriving in larger numbers than Germans, in the 1870s, groups of Italians started settling northeast Rio Grande do Sul. Similar to Germans, they were also attracted to develop small familiar farming production. In Paraná, on the other hand, the main group of immigrants was composed of Eastern Europeans, particularly Poles.[38][39]
In southern Brazil, the immigrants settled in colônias (colonies), which were rural areas, composed of many small farms, settled by the families. Some of these colonies had a great development and gave birth to major Brazilian cities, such as the former German community of Joinville (500,000 inhabitants - the largest city of the state of Santa Catarina) or the former Italian community of Caxias do Sul (405,858 inhabitants). Other colonies did not have a great development and remained small and agrarian. In these places, it is possible to feel more intensely the impact of the immigration, as many of these towns are still predominantly settled by a single ethnic group.
First Settlers in Londrina(1930´s)[11] Ethnic Group Population Brazilians 1.823 Italians 611 Japanese 533 Germans 510 Spanish 303 Portuguese 218 Polish 193 Ukrainians 172 Hungarians 138 Czechoslovakians 51 Russians 44 Swiss 34 Austrians 29 Lithuanians 21 Yugoslavs 15 Romanians 12 English 7 Argentinians 5 Syrians 5 Danes 3 Australians 2 Belgians 2 Bulgarians 2 French 2 Latvian 2 Liechtensteiner 2 North-Americans 2 Swedes 2 Estonians 1 Indian 1 Norwegian 1 Total Foreign Born Population 2.923( 61,6%) Some southern Brazilian towns with a notable main ancestry Town name State Main ancestry Percentage Nova Veneza Santa Catarina Italian 95% [40] Pomerode Santa Catarina German 90% [41] Prudentópolis Paraná Ukrainian 70% [42] Treze Tílias Santa Catarina Austrian 60% [43] Dom Feliciano Rio Grande do Sul Polish 90% [44] Statistics
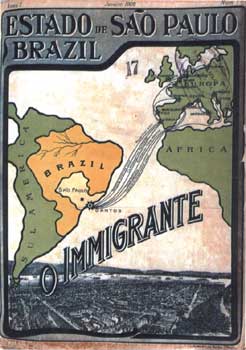
 Cover of the magazine "O Immigrante", published by Italian immigrants in Brazil.
Immigrants established in São Paulo state in 1940 Immigrants Population [12] Italians 694.489 Spanish 374.658 Portuguese 362.156 Japanese 85.103 Germans 50.507 Austrians 33.133 Main groups of settlers and immigrants in Brazil Origin Population [13] Africans (1550–1850) 3.000.000 Portuguese (1837–1968) 1.766.771 Italians (1836–1968) 1.620.344 Spaniards (1841–1968) 719.555 Germans (1836–1968) 257.457 Japanese (1908–1968) 243.441 Russians (1871–1968) 119.215 Lebanese (1871–1968) 100,246 Austrians (1868–1968) 98.457 Polish (1892–1968) 54.078 French (1842–1968) 50.341 Romanians (1908–1968) 40.799 Americans (1884–1968) 38.934 English (1847–1968) 38.080 Lithuanians (1920–1963) 29.002 Yugoslavs (1920–1968) 27.726 Argentines (1884–1968) 25.553 Syrians (1892–1968) 24.394 Swiss (1820–1968) 21.704 Greeks (1893–1968) 16.684 Dutch (1884–1968) 15.829 Hungarians (1908–1968) 13.592 Uruguayans (1884–1968) 10.836 Belgians (1847–1968) 9.173 Chinese (1895–1968) 7.996 Swedes (1853–1968) 7.994 Czechs (1920–1968) 6.538 Danes (1886–1968) 4.029 Jordanians (1953–1968) 3.567 Estonians (1923–1961) 2.803 Koreans (1956–1968) 2.500 Egyptians (1895–1968) 2.283 Paraguayans (1886–1968) 2.271 Canadians (1925–1968) 1.631 Peruvians (1885–1968) 1.600 Ukrainians (1920–1967) 1.415 Norwegians (1888–1968) 1.136 Venezuelans (1886–1968) 1.076 Finnish (1819–1968) 992 Iranians (1922–1968) 735 Bulgarians (1908–1968) 557 Luxembourgian (1919–1968) 473 Australians (1946–1968) 320 Irish (1940/1968) 176 Scottish (1945/1961) 6 - Most of the Poles immigrated to Brazil with German, Russian or Austro-Hungarian/Austrian passports, the Ukrainians with Austrian passports and the Hungarians with Romanian passports.
Total of entries of immigrants in the Port of Santos, São Paulo (1908–1936) - Gender.[37] Nationalities Total % Male % Female Portuguese 275,257 67.9 32.1 Italians 270,749 64.7 35.3 Japanese 210,775 56.2 43.8 Spaniards 190,282 59.4 40.6 Germans 89,989 64.3 35.7 Turks 26,321 73.4 26.6 Romanians 23,756 53.2 46.7 Yugoslavians 21,209 52.1 47.9 Lithuanians 20,918 58.6 41.4 Lebanese & Syrians 17,275 65.4 34.6 Poles 15,220 61.9 38.1 Austrians 15,041 72.7 27.3 Others 47,664 64.9 35.1 Total 2,221,282 63.8 36.2 Arrival of settlers, slaves, and immigrants, by origin, periods from 1500 to 1933
Source: Brazilian Institute for Geography and Statistics (IBGE)Period Origin 1500–1700 1701–1760 1761–1829 1830–1855 1856–1883 1884–1893 1894–1903 1904–1913 1914–1923 1924–1933 Africans 510,000 958,000 1,720,000 618,000 — — — — — — Portuguese 500,000 600,000 26,000 16,737 116,000 170,621 155,542 384,672 201,252 233,650 Italians — — — — 100,000 510,533 537,784 196,521 86,320 70,177 Spaniards — — — — — 113,116 102,142 224,672 94,779 52,405 Germans — — 5,003 2,008 30,000 22,778 6,698 33,859 29,339 61,723 Japanese — — — — — — — 11,868 20,398 110,191 Lebanese & Syrians — — — — — 96 7,124 45,803 20,400 20,400 Scandinavians — — — — — 66,524 42,820 109,222 51,493 Swiss 45,000 95,000 30,000 — — — — — — Farms owned by an foreign(1920) Immigrants Farms [14] Italians 35.984 Portuguese 9.552 Germans 6.887 Spanish 4.725 Russians 4.471 Austrians 4.292 Japanese 1.167 Hungarian Immigration to Brazil Passport Immigrants [15] Romanian 30.437 Yugoslav 16.518 Hungarian 6.501 Austrian 2.742 Czechoslovak 518 Total 56.716 Lebanese and Syrians Immigrants(1920) - French Consulate Estimation Location Immigrants [16] São Paulo and Santos 130.000 Pará 20.000 Rio de Janeiro 15.000 Rio Grande do Sul 14.000 Bahia 12.000 Main groups of settlers and immigrants in Brazil, from 1500 to 1970 Nationality/origin Number of settlers Africans 1 4,000,000  Portuguese
2,450,000  Italians
1,622,491  Spaniards2
716,052  Japanese
248,007  Germans 3
240,000  Poles 4
110,243  Lebanese/
  Syrians
100,000[45] - ^1 It includes all people who were brought from Sub-Saharan Africa.
- ^2 Includes Andalucians, Basques, Castilians, Catalans, and Galicians.
- ^3 It does not include Germans who immigrated with Russian passports (see Volga Germans)
- ^4 Most of the Poles immigrated to Brazil with German, Russian or Austro-Hungarian/Austrian passports
Consequences
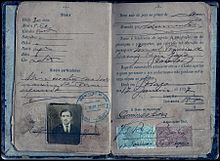 Passport of a Portuguese immigrant, 1927.
 German colonies in Southern Brazil.
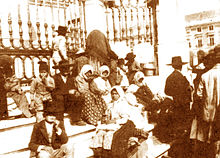 Portuguese immigrants in Brazil.
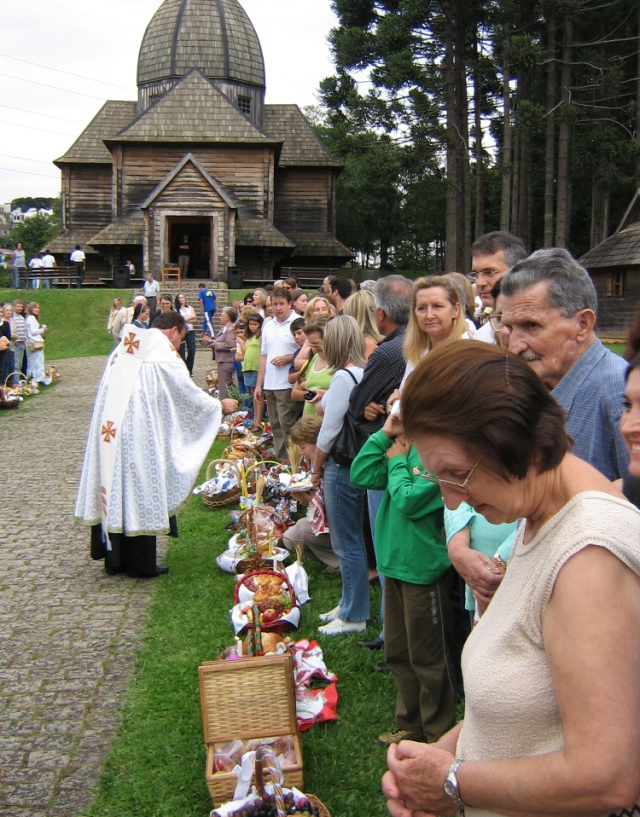
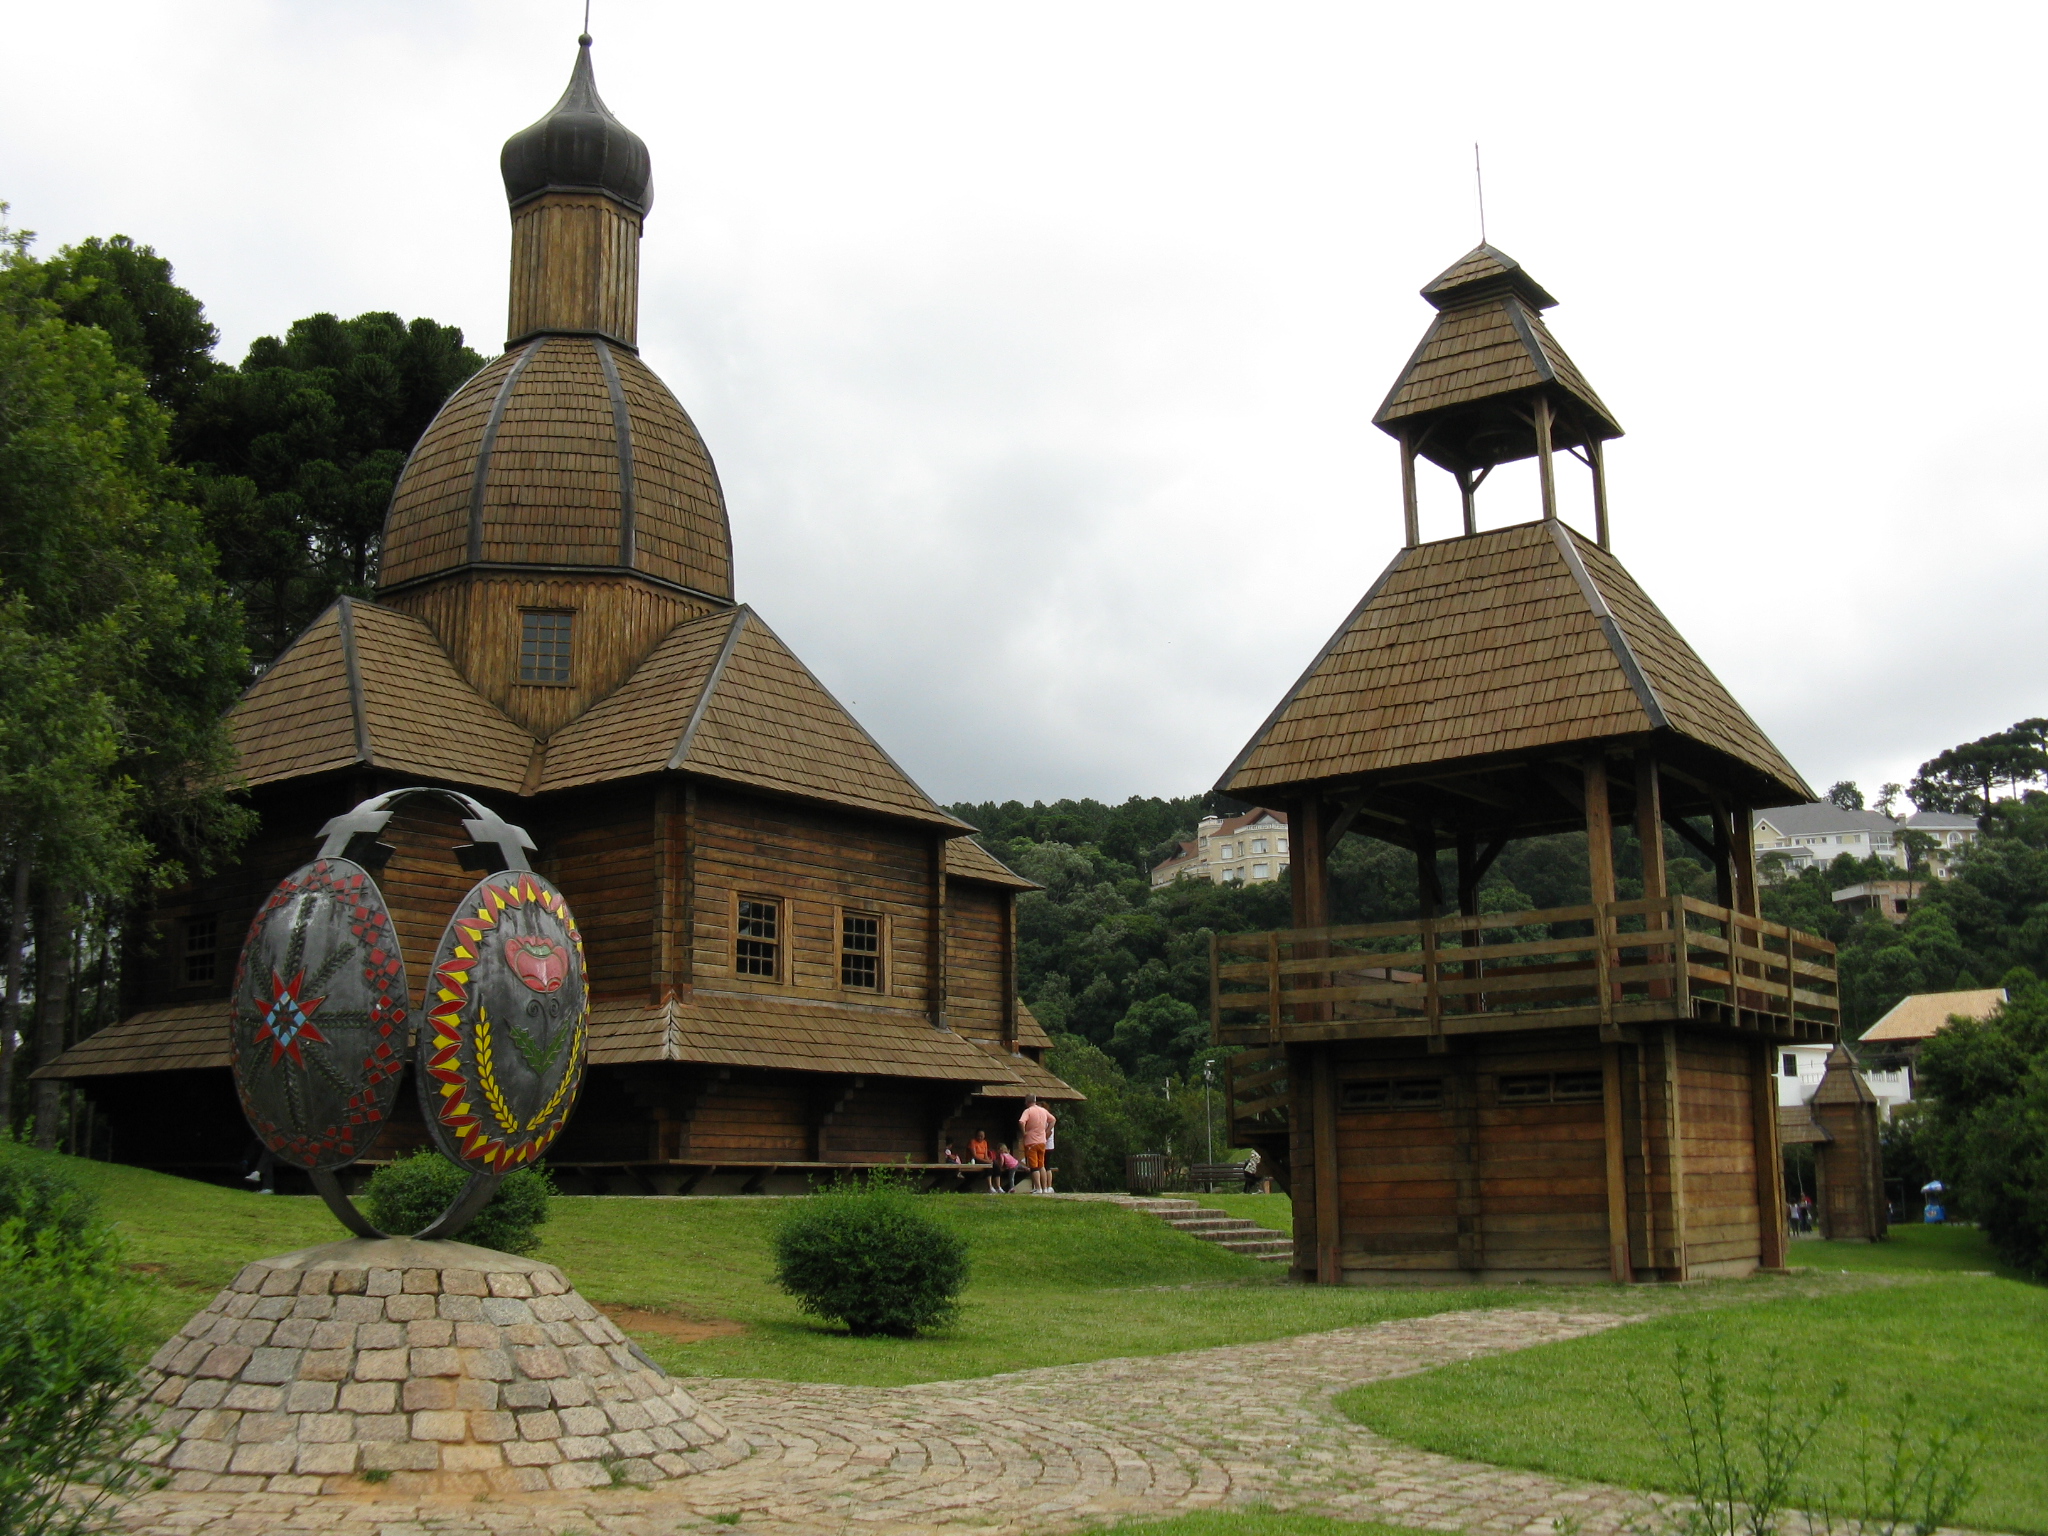
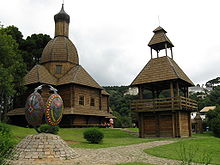 Ukrainian church in Curitiba.
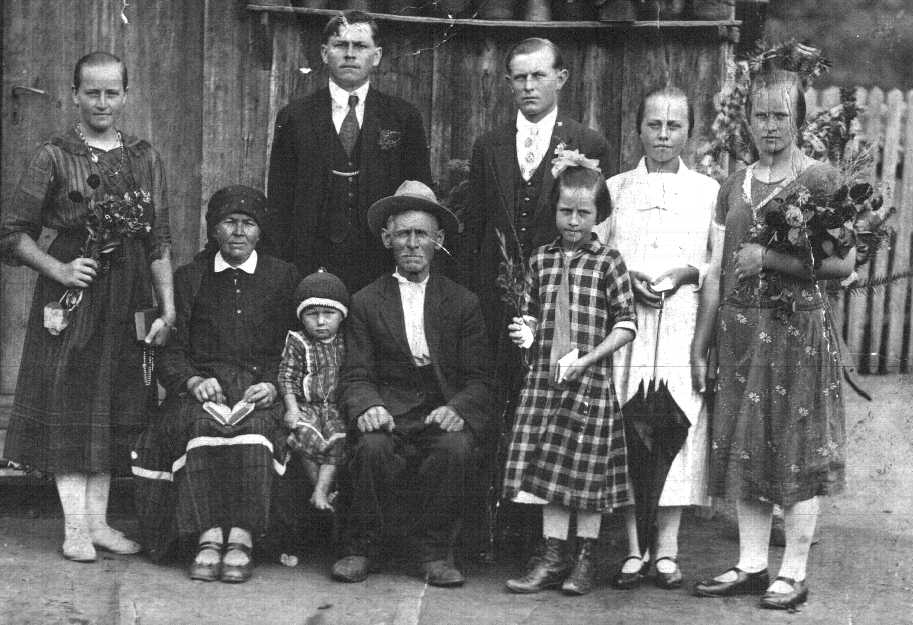
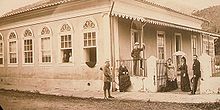 German Brazilians in 1874.
 Italian disembarkment in Santos, 1907.
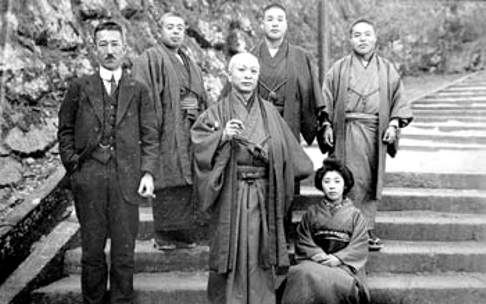
 Ryu Mizuno (at center), who organized the first travel of Japanese immigrants to Brazil.
 Ukrainians in Brazil.
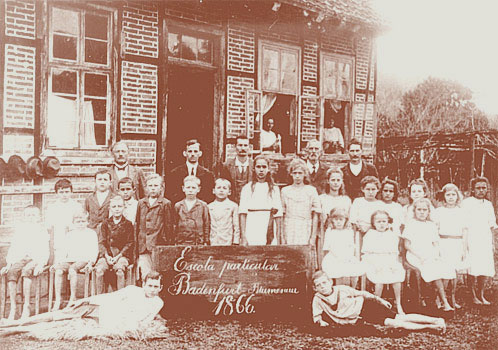
 German kids in Blumenau, 1866.
Brazilian demographers have long discussed the demographical impact of the wave of emigration in the late 19th and early 20th centuries. According to Judicael Clevelário,[46] most studies about the impact of immigration have followed Giorgio Mortara's conclusions in the 1940s and 1950s. Mortara concluded that only about 15% of the demographic growth of Brazil, from 1840 and 1940 was due to immigration, and that the population of immigrant origin was of 16% of the total population of Brazil.[47]
However, according to Clevelário, Mortara failed to properly take into account the full endogenous growth of the population of immigrant origin,[48] due to the predominantly rural settlement of the immigrants (rural regions tend to have higher natal rates than cities). Clevelário, then, besides extending the calculations up to 1980, remade them, reaching somewhat different conclusions.
One of the problems of calculating the impact of immigration in Brazilian demography is that the return rates of immigrants are unknown. Clevelário, thence, supposed four different hypothesis concerning the return rates. The first, that he deems unrealistic high, is that 50% of the immigrants to Brazil returned to their countries of origin. The second is based on the work of Arthur Neiva, who supposes the return rate for Brazil was higher than that of the United States (30%) but lower than that of Argentina (47%). The third hypothesis is taken from Mortara, who postulates a rate of 20% for the 19th century, 35% for the first two decades of the 20th century, and 25% for 1920 on. Although Mortara himself considered this hypothesis underestimated, Clevelário thinks it is closest to reality. The last hypothesis, also admittedly unrealistic is that of a 0% rate of return, which is known to be false.[49]
Clevelário's conclusions are as following: considering hypothesis 1 (unrealistically low), the Population of Immigrant Origin in 1980 would be of 14,730,710 people, or 12.38% of the total population. Considering hypothesis 2 (based on Neiva), it would be of 17,609,052 people, or 14.60% of the total population. Considering hypothesis 3 (based on Mortara, and considered most realistic), it would be of 22,088,829 people, or 18.56% of the total population. Considering hypothesis 4 (no return at all), the Population of Immigrant origin would be of 29,348,423 people, or 24.66% of the total population.[50] Clevelário believes the most probable number to be close to 18%, higher than Mortara's previous estimate of 1947.[51]
According to the Census of 1872, there were 9,930,478 people in Brazil, of which 3,787,289 (38.14%) Whites, 3,380,172 (34.04%) Pardos, 1.954.452 (19.68%) Blacks, and 386,955 (3.90%) Caboclos. The White population grew faster than the non-White population due to the subsidized immigration of Europeans in the late 19th and early 20th centuries. As of 1890, the non-White population was reduced to 47% and the Amerindian to 9%.[52] During this period, most immigrants came from Italy (58.49%) followed by Portugal with 20%.[13]
The disproportionally fast growth of the White population, due to mass immigration, lasted up to 1940, when its proportion in the Brazilian population peaked at 63.5%.[52] During the 1900-1940 period, Italian immigration was greatly reduced, due to the Prinetti decree, forbidding subsidized emigration to Brazil in 1902, then to the Italian war effort of 1915-1918. Thence, for the period of 1904-1940, Portuguese immigration became the main drive of immigration to Brazil, with 36.52% of the arrivals, compared to 14.99% of Italians.[13]
The Brazilian Censuses do not ask questions about "ethnic origin," so there are no systematically comparable data about the impact of immigration. Varied entities, mainly embassies of foreign countries in Brazil and commercial associations that promote bilateral commerce between Brazil and other countries, make claims about the figures of "descendants of immigrants" in Brazil, but none links to any actual survey. Also, if they are extrapolations of actual data on the number of immigrants, the calculations are not explained anywhere.
On the other hand, in 1998, the IBGE, within its preparation for the 2000 Census, experimentally introduced a question about "origem" (origin/ancestry) in its "Pesquisa Mensal de Emprego" (Monthly Employment Research), in order to test the viability of introducing that variable in the Census[53] (the IBGE ended by deciding against the inclusion of questions about it in the Census). This research interviewed about 90,000 people in six metropolitan regions (São Paulo, Rio de Janeiro, Porto Alegre, Belo Horizonte, Salvador, and Recife) .[54] To this day, it remains the only actual published survey about the immigrant origin of Brazilians.
Here are its results:[55]
Brazilian Population, by ancestry, 1998[56] Ancestry % Brazilian 86.09% Italian 10.41% Portuguese 10.46% Spanish 4.40% German 3.54% Indigenous 6.64% Black 5.09% Lebanese/Syrian 0.48% Japanese 1.34% African 2.06% Jewish 0.20% Others 2.81% Total 133.52% Notice that the total is higher than 100% because of multiple answers. It is easy to see that the results of this research are widely incompatible with the claims made by embassies and commercial associations:
Comparison between claims by embassies, commercial associations, etc., and actual data Ancestry Number of immigrants Ancestry in Brazil (claims by embassies, etc.) Found by 1998 PME (%) Projection Italians 1,622,491 25,000,000 10.41% 18,738,000 Spaniards 716,052 15,000,000 4.40% 7,920,000 Lebanese/ Syrians 100,000 10,000,000 0.48% 864,000 Japanese 248,007 1,600,000 1.34% 2,412,000 Germans 240,000 5,000,000 3.54% 6,372,000 The embassy figures are also hardly compatible with the known data for immigration. Here is how they compare:
Number of immigrants and their purported descendants, by national origin Origin Number of immigrants[57] Number of descendants Descendants per immigrant Arab 140,000 10,000,000 71.43 German 223,658 5,000,000 22.36 Spanish 716,478 15,000,000 20.94 Italian 1,623,931 25,000,000 15.39 Japanese 248,007 1,400,000 5.65 The embassy figures for "Arab Brazilians" are particularly grotesque, implying a humanly impossible rate of reproduction. The process of inflation of the "Arab Brazilian" population is described by John Tofik Karam[58]: Maintaining a privileged presence in business and political circles, Middle Easterners have overestimated themselves as a way to strengthen their place in the Brazilian nation.
Among the groups listed in the table, German immigrants arrived quite early in Brazil, starting in the 1820s. By 1883, 23.86% of them had already arrived. Italian immigrants only started to arrive in the 1870s, coming in enormous numbers until 1902, when Italian immigration declined sharply. By 1903, 70.33% of them had already arrived. Spaniards started arriving about the same time as the Italians, but came in more steady pace, which means that, in average, they represent a more recent immigration. Arabs only started to arrive in considerable numbers about 1890, making them the second most recent immigration, after the Japanese, who started to arrive in 1908. Evidently, the older the immigration, higher should be the descendant/immigrant relation - but, as the table shows, the embassy figures would place the Arab descendant/immigrant relation first - and, in fact, more than three times higher than that of the Germans.
When the number of immigrants is compared to the findings of the July 1998 PME, the results are different:
Number of immigrants and their descendants, projected from the 1998 PME, by national origin Origin Number of immigrants[57] Number of descendants[59] Descendants per immigrant Arab 140,000 641,200 4.58 German 223,658 4,709,857 21.06 Spanish 716,478 5,856,417 8.17 Italian 1,623,931 13,847,471 8.53 Japanese 248,007 1,776,382 7.16 Here the correct order is reestablished, except for the Arabs appearing with a lower descendant/immigrant rate than the Japanese. This, however, is probably due to the concentration of Nikkeis in São Paulo, as opposed to a less concentrated distribution of "Arab Brazilians", who are present in considerable numbers in regions not counted by the PMEs - notably the Northern Region, the West of Paraná State, and Southern Rio Grande do Sul.[60]
As happened with several other countries in the Americas, such as the United States, which received immigration from many countries, Brazil quickly became a melting pot of races and nationalities, but being peculiar in the sense of having the highest degree of intermarriage in the world.[61]
Nowadays, it's possible to find millions of descendants of Italians, from the southeastern state of Minas Gerais to the southernmost state of Rio Grande do Sul, with the majority living in the state of São Paulo (9.9 million)[62] and the highest percentage in the southeastern state of Espírito Santo (60-75%).[62][63][64][65] Small southern Brazilian towns, such as Nova Veneza, have as much as 95% of their population of Italian descent.[40]
Thousands of White Americans from the Southern United States (including relatives of former president Jimmy Carter) fled to Brazil, after the American Civil War, where they founded two cities,[66] Americana and Santa Bárbara d'Oeste.[67]
See also
- Afro-Brazilians
- American Brazilians
- Arab Brazilians
- Asian Brazilians
- Brazilian diaspora
- Brazilian Jews
- Bulgarian Brazilians
- Chinese Brazilians
- Czech Brazilians
- Confederate soldiers in Brazil
- Dutch Brazilians
- English Brazilians
- Finnish Brazilians
- Greek Brazilians
- Hungarian Brazilians
- Italian Brazilians
- Japanese Brazilians
- Korean Brazilians
- Latvian Brazilians
- Lithuanian Brazilians
- Luxembourg Brazilians
- Palestinian Brazilians
- Polish Brazilians
- Portuguese Brazilians
- Russian Brazilians
- Scandinavian Brazilians
- Spanish immigration to Brazil
- Swiss Brazilians
- Ukrainian Brazilians
References
- ^ Os migrantes de hoje
- ^ a b c [1] Maria Stella Ferreira Levy. O papel da migração internacional na evolução da população brasileira (1872 a 1972) p. 52.
- ^ Carvalho-Silva, DR; Santos, FR; Rocha, J; Pena, SD (January 2001). "The Phylogeography of Brazilian Y-Chromosome Lineages". American Journal of Human Genetics 68 (1): 281–6. doi:10.1086/316931. PMC 1234928. PMID 11090340. http://www.pubmedcentral.nih.gov/articlerender.fcgi?tool=pmcentrez&artid=1234928.
- ^ ÍNDIOS DO BRASIL - história, cultura, sociedade indígena, arte, tribos.
- ^ http://www.scribd.com/doc/7388705/Eduardo-Bueno-Naufragos-Traficantes-e-Degredados
- ^ a b Levy MS (June 1974). "[The role of international migration on the evolution of the Brazilian population (1872 to 1972)"] (in Portuguese). Rev Saude Publica Suppl: 49–90. PMID 4438969. http://www.scielo.br/scielo.php?pid=S0034-89101974000500003&script=sci_arttext.
- ^ a b Brasil 500 anos
- ^ http://www.millersville.edu/~columbus/data/art/MORGANT1.ART
- ^ T. Lynn Smith. Brazil: people and institutions. p. 141-142
- ^ Diretoria Geral de Estatística. Recenseamento do Brazil em 1872. pp. 3 and 4 (of the PDF document).
- ^ a b O papel da migração internacional na evolução da população brasileira (1872 a 1972)
- ^ [2] Maria Stella Ferreira Levy. O papel da migração internacional na evolução da população brasileira (1872 a 1972) p.51.
- ^ a b c d e f Entrada de estrangeiros no Brasil
- ^ RS VIRTUAL - O Rio Grande do Sul na Internet - História - Colonização - Italianos - Os homens do vinho ficaram nas terras altas
- ^ Eliane Yambanis Obersteiner. Café atrai imigrante europeu para o Brasil - 22/02/2005 - Resumos | História do Brasil
- ^ Maria Stella Ferreira Levy [3]. p.51
- ^ a b c d http://www.abep.nepo.unicamp.br/docs/anais/pdf/1992/T92V01A18.pdf
- ^ Start of the immigration to Brazil
- ^ RIOS, Roger Raupp. Text excerpted from a judicial sentence concerning crime of racism. Federal Justice of 10ª Vara da Circunscrição Judiciária de Porto Alegre, November 16, 2001 (Accessed September 10, 2008)
- ^ SUZUKI Jr, Matinas. História da discriminação brasileira contra os japoneses sai do limbo in Folha de São Paulo, 20 de abril de 2008 (visitado em 17 de agosto de 2008)
- ^ Arab immigration to Brazil
- ^ Refugees in Brazil - 2010
- ^ Brasil: migrações internacionais e identidade
- ^ Professor says increased Bolivian immigration to Brazil is due to crisis there
- ^ Cláudia Rolli, Fátima Fernandes. Até 1.500 bolivianos chegam por mês. Folha de São Paulo (December 16, 2007)
- ^ Veja 19/7/2000
- ^ Brazil has 689,000 people from around the world in 2009
- ^ 2010 Refugees Largest Ancestries
- ^ Visa Immigration - Brazil
- ^ Federal Constitution of Brazil
- ^ Statute of Foreign of Brazil
- ^ http://www.planalto.gov.br/ccivil_03/_Ato2007-2010/2009/Lei/L11961.htm
- ^ Amnesty to Illegal Immigrants 2009 - Brazil
- ^ Amnesty - Brazil
- ^ http://www.bibliotecadigital.puc-campinas.edu.br/tde_busca/arquivo.php?codArquivo=219
- ^ A cidade de São Paulo
- ^ a b Imigração portuguesa
- ^ Outras Etnias, <http://www.terrabrasileira.net/folclore/regioes/7tipos/etniasl.html>. Accesso em: 11 de outubro de 2008
- ^ Polish Immigration to Paraná
- ^ a b Nova Veneza
- ^ POMERODE-SC
- ^ Ucranianos no Brasil
- ^ História de Treze Tílias
- ^ Prefeitura de D. Feliciano
- ^ http://books.google.com.br/books?id=8g_NduoKW3MC&pg=PA94&dq=arab+emigration+to+brazil&lr=&as_brr=3&ei=c1NcS7TSHYaszATXofjsDQ&cd=2#v=onepage&q=table&f=false Jeffrey Lesser. Negotiating national identity: immigrants, minorities, and the struggle for ethnicity in Brazil. Table 3, p. 49. (the original source, reported in the book, is Revista de Imigração e Colonização 1, n. 03 (July 1940): 617-638.) The total figure, 107,135, includes some non-Arabs, such as Armenians (826). Notice that while most Middle Eastern immigrants fall under "Turks", this is actually a misnomer, as it refers to the passport (of the Ottoman Empire) used by Levantine immigrants in their arrival to Brazil.
- ^ http://www.abep.nepo.unicamp.br/docs/rev_inf/vol14_n1e2_1997/vol14_n1e2_1997_3artigo_51_71.pdf
- ^ Mortara, Giorgio. O aumento da população do Brasil entre 1872 e 1940.
- ^ http://www.abep.nepo.unicamp.br/docs/rev_inf/vol14_n1e2_1997/vol14_n1e2_1997_3artigo_51_71.pdf p.52
- ^ http://www.abep.nepo.unicamp.br/docs/rev_inf/vol14_n1e2_1997/vol14_n1e2_1997_3artigo_51_71.pdf p.57
- ^ http://www.abep.nepo.unicamp.br/docs/rev_inf/vol14_n1e2_1997/vol14_n1e2_1997_3artigo_51_71.pdf Table 5, p.59; Table 6, p.60.
- ^ .http://www.abep.nepo.unicamp.br/docs/rev_inf/vol14_n1e2_1997/vol14_n1e2_1997_3artigo_51_71.pdf Abstract, p. 71.
- ^ a b IBGE 2008 Cor ou Raça
- ^ http://www.schwartzman.org.br/simon/pdf/origem.pdf p.3
- ^ /www.schwartzman.org.br/simon/pdf/origem.pdf Note 3, p.3
- ^ /www.schwartzman.org.br/simon/pdf/origem.pdf Table 6, p.10
- ^ Fora de foco: diversidade e identidade étnicas no Brasil
- ^ a b The figures for Germans, Italians, Spaniards, and Japanese from 1820 to August 31, 1972, can be found in Maria Stella Ferreira Levy. O papel da migração internacional na evolução da população brasileira (1872 a 1972). Tabela 2. p. 74. For this table, the sum for the period 1820-1971 is given. The figure for Arab immigrants is based in Jeff Lesser. Negotiating national identity: immigrants, minorities, and the struggle for ethnicity in Brazil, Table 1, p. 8, which gives 140,464 "Middle Eastern" immigrants for the period 1880-1969. Non-arab middle easterners (mainly Iranian/Persians and Turks) have been in small numbers, as can be seen in the same book, table 3, p. 49.; and the numbers of Arab immigrants have been small before 1880 and after 1969.
- ^ John Tofik Karam. Another arabesque: Syrian-Lebanese ethnicity in neoliberal Brazil. p. 11.
- ^ Simon Schwartzman. Fora de foco: diversidade e identidades étnicas no Brasil. Quadro 2, p. 7. To obtain comparable figures, the percents found by the PME were applied to the 2000 Census population.
- ^ Arabs in western PR and southern RS
- ^ Intermarriage in Brazil
- ^ a b "Imigração italiana por Estados e Regiões do Brasil (in Portuguese)". http://www.italianossa.com.br/site.php?area=estatistica&PHPSESSID=48a1a4e26ce2388867024965cbfef484.
- ^ Cilmar Franceschetto. Espírito Santo, lo stato più veneto del Brasile (in Italian)
- ^ José Carlos Mattedi. Consulado italiano vai abrir dois escritórios em Vitória para agilizar pedidos de cidadania (in Portuguese)
- ^ Nara Saletto. Sobre a composição étnica da população capixaba (in Portuguese)
- ^ U.S. citizens founded many cities in Brazil
- ^ AmericanHeritage.com / The Deepest South
External links
- (Portuguese) Hospedaria dos Imigrantes. São Paulo
Demographics of Brazil Economic and social Apartheid · Attractions · Law · Crime · Education · GDP · Health · Human Development · Human Rights (LGBT Rights) · Immigration · Languages · People · Politics · Poverty · Races · Religions · Traditions · Wealth
Ethnic groups BrazilAfricaAmericasNorth AmericaCaribbeanHaitianSouth AmericaAsiaBy EthnicityBy Country
or RegionEasternSouthernEast IndianWesternEuropeBy EthnicityBy Country
or RegionNorthernWesternCentralSouthernBalkanEastern Brazil
History First inhabitants · Colonization · Empire · Old Republic · Vargas Era · Second Republic · Military rule · ContemporaryGeography Regions · States · Mesoregions · Microregions · Municipalities · Islands · Coastline · Climate · Environment · Extreme points · Protected areas · CapitalsGovernment Constitution · Federal government · President · National Congress · Foreign relations · Law · Law enforcement · MilitaryPolitics Economy Society Demographics · People · Languages · Religion · Immigration · Education · Health · Crime · Social issues · Largest cities · ApartheidCulture  Category ·
  Portal ·
  WikiProjectCategories:
- Immigration to Brazil
- Brazilian society
- Ukrainian diaspora in Brazil


Wikimedia Foundation. 2010.