- Opinion poll
-
An opinion poll, sometimes simply referred to as a poll is a survey of public opinion from a particular sample. Opinion polls are usually designed to represent the opinions of a population by conducting a series of questions and then extrapolating generalities in ratio or within confidence intervals.
Contents
History
The first known example of an opinion poll was a local straw poll conducted by The Harrisburg Pennsylvanian in 1824, showing Andrew Jackson, who actually won the popular vote in the real election, leading John Quincy Adams by 335 votes to 169 in the contest for the United States Presidency. Such straw votes gradually became more popular, but they remained local, usually city-wide phenomena. In 1916, the Literary Digest embarked on a national survey (partly as a circulation-raising exercise) and correctly predicted Woodrow Wilson's election as president. Mailing out millions of postcards and simply counting the returns, the Digest correctly called the following four presidential elections.
In 1936 however the Digest came unstuck. Its 2.3 million "voters" constituted a huge sample; however they were generally more affluent Americans who tended to have Republican sympathies. The Literary Digest was ignorant of this new bias. The week before election day, it reported that Alf Landon was far more popular than Franklin D. Roosevelt. At the same time, George Gallup conducted a far smaller, but more scientifically-based survey, in which he polled a demographically representative sample. Gallup correctly predicted Roosevelt's landslide victory. The Literary Digest soon went out of business, while polling started to take off.
Elmo Roper was another American pioneer in political forecasting using scientific polls.[1] He predicted the reelection of President Franklin D. Roosevelt three times, in 1936, 1940, and 1944. Louis Harris had been in the field of public opinion since 1947 when he joined the Elmo Roper firm, then later became partner.
Gallup launched a subsidiary in the United Kingdom, where it correctly predicted Labour's victory in the 1945 general election, in contrast with virtually all other commentators, who expected a victory for the Conservative Party, led by Winston Churchill.
By the 1950s, various types of polling had spread to most democracies. In (post Saddam Hussein era) Iraq, surveys conducted soon after the 2003 war aimed to measure the feelings of Iraqi citizens regarding Saddam Hussein, post-war conditions, and the presence of US forces.[citation needed]
Sample and polling methods
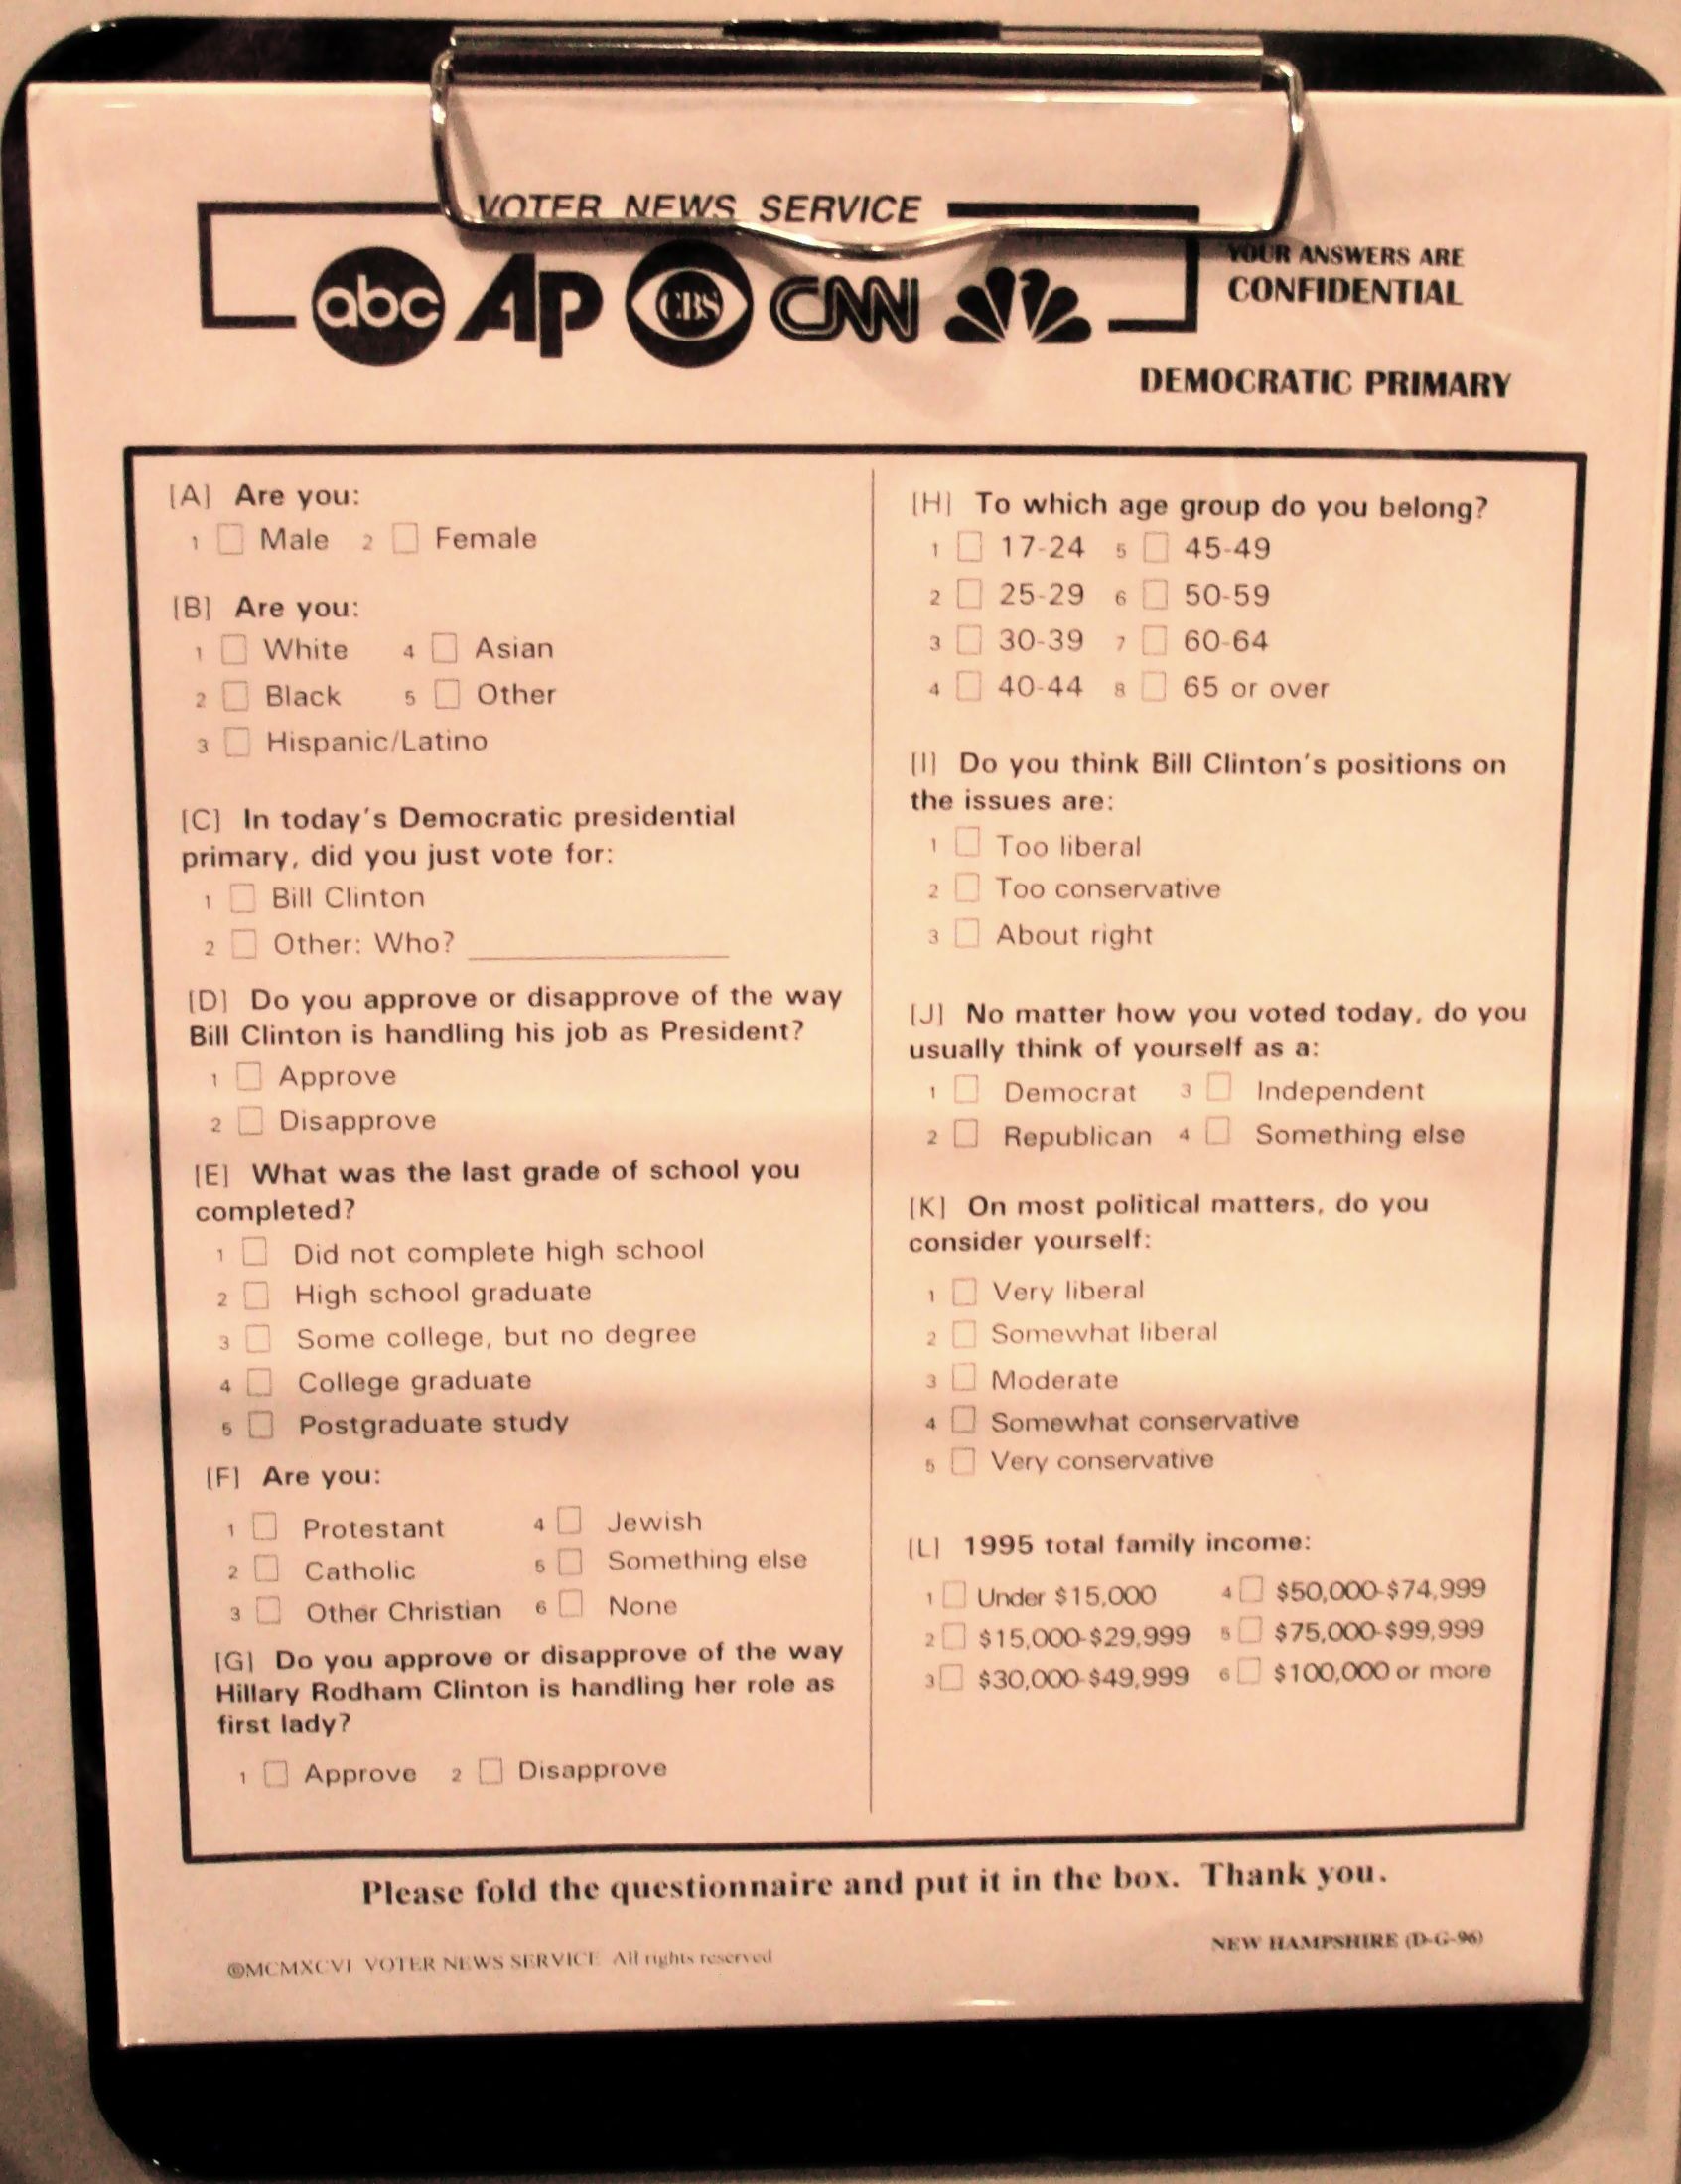
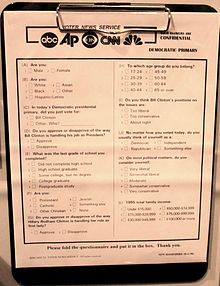 Voter polling questionnaire on display at the Smithsonian Institution
Opinion polls for many years were maintained through telecommunications or in person-to-person contact. Methods and techniques vary, though they are widely accepted in most areas. Verbal, ballot, and processed types can be conducted efficiently, contrasted with other types of surveys, systematics, and complicated matrices beyond previous orthodox procedures. Opinion polling developed into popular applications through popular thought, although response rates for some surveys declined. Also, the following has also led to differentiating results:[1] Some polling organizations, such as Angus Reid Strategies, YouGov and Zogby use Internet surveys, where a sample is drawn from a large panel of volunteers, and the results are weighed to reflect the demographics of the population of interest. In contrast, popular web polls draw on whoever wishes to participate, rather than a scientific sample of the population, and are therefore not generally considered professional.
Benchmark polls
A benchmark poll is generally the first poll taken in a campaign. It is often taken before a candidate announces their bid for office but sometimes it happens immediately following that announcement after they have had some opportunity to raise funds. This is generally a short and simple survey of likely voters.
A benchmark poll serves a number of purposes for a campaign, whether it is a political campaign or some other type of campaign. First, it gives the candidate a picture of where they stand with the electorate before any campaigning takes place. If the poll is done prior to announcing for office the candidate may use the poll to decide whether or not they should even run for office. Secondly, it shows them where their weaknesses and strengths are in two main areas. The first is the electorate. A benchmark poll shows them what types of voters they are sure to win, those who they are sure to lose, and everyone in-between those two extremes. This lets the campaign know which voters are persuadable so they can spend their limited resources in the most effective manner. Second, it can give them an idea of what messages, ideas, or slogans are the strongest with the electorate.[2]
Brushfire polls
Brushfire Polls are polls taken during the period between the Benchmark Poll and Tracking Polls. The number of Brushfire Polls taken by a campaign is determined by how competitive the race is and how much money the campaign has to spend. These polls usually focus on likely voters and the length of the survey varies on the number of messages being tested.
Brushfire polls are used for a number of purposes. First, it lets the candidate know if they have made any progress on the ballot, how much progress has been made, and in what demographics they have been making or losing ground. Secondly, it is a way for the campaign to test a variety of messages, both positive and negative, on themselves and their opponent(s). This lets the campaign know what messages work best with certain demographics and what messages should be avoided. Campaigns often use these polls to test possible attack messages that their opponent may use and potential responses to those attacks. The campaign can then spend some time preparing an effective response to any likely attacks. Thirdly, this kind of poll can be used by candidates or political parties to convince primary challengers to drop out of a race and support a stronger candidate.
Tracking polls
A tracking poll is a poll repeated at intervals generally averaged over a trailing window.[3] For example, a weekly tracking poll uses the data from the past week and discards older data.
A key benefit of tracking polls is that the trend of a tracking poll (the change over time) corrects for bias: regardless of whether a poll consistently over or underestimates opinion, the trend correctly reflects increases or decreases[citation needed].
A caution is that estimating the trend is more difficult and error-prone than estimating the level – intuitively, if one estimates the change, the difference between two numbers X and Y, then one has to contend with the error in both X and Y – it is not enough to simply take the difference, as the change may be random noise. For details, see t-test. A rough guide is that if the change in measurement falls outside the margin of error, it is worth attention.
Potential for inaccuracy
Polls based on samples of populations are subject to sampling error which reflects the effects of chance and uncertainty in the sampling process. The uncertainty is often expressed as a margin of error. The margin of error is usually defined as the radius of a confidence interval for a particular statistic from a survey. One example is the percent of people who prefer product A versus product B. When a single, global margin of error is reported for a survey, it refers to the maximum margin of error for all reported percentages using the full sample from the survey. If the statistic is a percentage, this maximum margin of error can be calculated as the radius of the confidence interval for a reported percentage of 50%. Others suggest that a poll with a random sample of 1,000 people has margin of sampling error of 3% for the estimated percentage of the whole population.
A 3% margin of error means that if the same procedure is used a large number of times, 95% of the time the true population average will be within the 95% confidence interval of the sample estimate plus or minus 3%. The margin of error can be reduced by using a larger sample, however if a pollster wishes to reduce the margin of error to 1% they would need a sample of around 10,000 people.[4] In practice, pollsters need to balance the cost of a large sample against the reduction in sampling error and a sample size of around 500–1,000 is a typical compromise for political polls. (Note that to get complete responses it may be necessary to include thousands of additional participators.)[5]
Another way to reduce the margin of error is to rely on poll averages. This makes the assumption that the procedure is similar enough between many different polls and uses the sample size of each poll to create a polling average.[6] An example of a polling average can be found here: 2008 Presidential Election polling average. Another source of error stems from faulty demographic models by pollsters who weigh their samples by particular variables such as party identification in an election. For example, if you assume that the breakdown of the US population by party identification has not changed since the previous presidential election, you may underestimate a victory or a defeat of a particular party candidate that saw a surge or decline in its party registration relative to the previous presidential election cycle.
Over time, a number of theories and mechanisms have been offered to explain erroneous polling results. Some of these reflect errors on the part of the pollsters; many of them are statistical in nature. Others blame the respondents for not giving candid answers (e.g., the Bradley effect, the Shy Tory Factor); these can be more controversial.
Nonresponse bias
Since some people do not answer calls from strangers, or refuse to answer the poll, poll samples may not be representative samples from a population due to a non-response bias. Because of this selection bias, the characteristics of those who agree to be interviewed may be markedly different from those who decline. That is, the actual sample is a biased version of the universe the pollster wants to analyze. In these cases, bias introduces new errors, one way or the other, that are in addition to errors caused by sample size. Error due to bias does not become smaller with larger sample sizes, because taking a larger sample size simply repeats the same mistake on a larger scale. If the people who refuse to answer, or are never reached, have the same characteristics as the people who do answer, then the final results should be unbiased. If the people who do not answer have different opinions then there is bias in the results. In terms of election polls, studies suggest that bias effects are small, but each polling firm has its own techniques for adjusting weights to minimize selection bias.[7]
Response bias
Survey results may be affected by response bias, where the answers given by respondents do not reflect their true beliefs. This may be deliberately engineered by unscrupulous pollsters in order to generate a certain result or please their clients, but more often is a result of the detailed wording or ordering of questions (see below). Respondents may deliberately try to manipulate the outcome of a poll by e.g. advocating a more extreme position than they actually hold in order to boost their side of the argument or give rapid and ill-considered answers in order to hasten the end of their questioning. Respondents may also feel under social pressure not to give an unpopular answer. For example, respondents might be unwilling to admit to unpopular attitudes like racism or sexism, and thus polls might not reflect the true incidence of these attitudes in the population. In American political parlance, this phenomenon is often referred to as the Bradley Effect. If the results of surveys are widely publicized this effect may be magnified - a phenomenon commonly referred to as the spiral of silence.
Wording of questions
It is well established that the wording of the questions, the order in which they are asked and the number and form of alternative answers offered can influence results of polls. For instance, the public is more likely to indicate support for a person who is described by the operator as one of the "leading candidates". This support itself overrides subtle bias for one candidate, as does lumping some candidates in an "other" category or vice versa. Thus comparisons between polls often boil down to the wording of the question. On some issues, question wording can result in quite pronounced differences between surveys.[8][9][10] This can also, however, be a result of legitimately conflicted feelings or evolving attitudes, rather than a poorly constructed survey.[11]
A common technique to control for this bias is to rotate the order in which questions are asked. Many pollsters also split-sample. This involves having two different versions of a question, with each version presented to half the respondents.
The most effective controls, used by attitude researchers, are:
- asking enough questions to allow all aspects of an issue to be covered and to control effects due to the form of the question (such as positive or negative wording), the adequacy of the number being established quantitatively with psychometric measures such as reliability coefficients, and
- analyzing the results with psychometric techniques which synthesize the answers into a few reliable scores and detect ineffective questions.
These controls are not widely used in the polling industry[why?].
Coverage bias
Another source of error is the use of samples that are not representative of the population as a consequence of the methodology used, as was the experience of the Literary Digest in 1936. For example, telephone sampling has a built-in error because in many times and places, those with telephones have generally been richer than those without.
In some places many people have only mobile telephones. Because pollsters cannot call mobile phones (it is unlawful in the United States to make unsolicited calls to phones where the phone's owner may be charged simply for taking a call), these individuals will never be included in the polling sample. If the subset of the population without cell phones differs markedly from the rest of the population, these differences can skew the results of the poll. Polling organizations have developed many weighting techniques to help overcome these deficiencies, to varying degrees of success. Studies of mobile phone users by the Pew Research Center in the US concluded that "cell-only respondents are different from landline respondents in important ways, (but) they were neither numerous enough nor different enough on the questions we examined to produce a significant change in overall general population survey estimates when included with the landline samples and weighted according to US Census parameters on basic demographic characteristics."[12]
This issue was first identified in 2004,[13] but came to prominence only during the 2008 US presidential election.[14] In previous elections, the proportion of the general population using cell phones was small, but as this proportion has increased, the worry is that polling only landlines is no longer representative of the general population. In 2003, a 2.9% of households were wireless (cellphones only) compared to 12.8 in 2006.[15] This results in "coverage error". Many polling organisations select their sample by dialling random telephone numbers; however, there is a clear tendency for polls which included mobile phones in their sample to show a much larger lead for Obama than polls that did not.[16][17]
The potential sources of bias are:[18]
- Some households use cellphones only and have no landline. This tends to include minorities and younger voters; and occurs more frequently in metropolitan areas. Men are more likely to be cellphone-only compared to women.
- Some people may not be contactable by landline from Monday to Friday and may be contactable only by cellphone.
- Some people use their landlines only to access the Internet, and answer calls only to their cellphones.
Some polling companies have attempted to get around that problem by including a "cellphone supplement". There are a number of problems with including cellphones in a telephone poll:
- It is difficult to get co-operation from cellphone users, because in many parts of the US, users are charged for both outgoing and incoming calls. That means that pollsters have had to offer financial compensation to gain co-operation.
- US federal law prohibits the use of automated dialling devices to call cellphones (Telephone Consumer Protection Act of 1991). Numbers therefore have to be dialled by hand, which is more time-consuming and expensive for pollsters.
An oft-quoted example of opinion polls succumbing to errors was the UK General Election of 1992. Despite the polling organizations using different methodologies virtually all the polls in the lead up to the vote, and to a lesser extent exit polls taken on voting day, showed a lead for the opposition Labour party but the actual vote gave a clear victory to the ruling Conservative party.
In their deliberations after this embarrassment the pollsters advanced several ideas to account for their errors, including:
- Late swing
- Voters who changed their minds shortly before voting tended to favour the Conservatives, so the error was not as great as it first appeared.
- Nonresponse bias
- Conservative voters were less likely to participate in surveys than in the past and were thus under-represented.
- The Shy Tory Factor
- The Conservatives had suffered a sustained period of unpopularity as a result of economic difficulties and a series of minor scandals, leading to a spiral of silence in which some Conservative supporters were reluctant to disclose their sincere intentions to pollsters.
The relative importance of these factors was, and remains, a matter of controversy, but since then the polling organizations have adjusted their methodologies and have achieved more accurate results in subsequent elections.
Polling organizations
In Australia the most notable companies are:
- Newspoll - published in News Limited's The Australian newspaper
- Roy Morgan Research - published in the Crikey email reporting service
- Galaxy Polling - published in News Limited's tabloid papers
- AC Nielsen Polling - published in Fairfax newspapers
- Ipsos and I-View
In Brazil the most notable companies are:
- IBOPE (Instituto Brasileiro de Opinião Pública) which acronym has become the Brazilian household word for TV audience rating and a slang word that indicates that a meeting or similar function had significant attendance.
- Datafolha
In Canada the most notable companies are:
- Angus Reid Strategies
- EKOS Research Associates
- Environics Research Group
- Harris/Decima
- Ipsos-Reid
- Léger Marketing
- Nanos Research
In Egypt, the most notable polling organization is
- Opinion Poll Center[19]
In Germany, notable polling organizations are
- Allensbach Institute
- Forsa institute
- Infratest dimap
- TNS Emnid
In Jordan the dominant organization is:
- Knowledge World Center for Polls
In Iran, some notable polling organisations include:
- Ayandeh - closed in 2002 and director Abbas Abdi arrested[20]
In New Zealand, some notable polling organisations include:
- Colmar Brunton
- UMR Insight
In Nigeria the most notable polling organisation is:
In South Africa, some notable polling organisations include:
- Ipsos Markinor who have conducted opinion polls since 1976.
- Plus 94 Research - published in Sunday Times South Africa newspaper
In Ukraine, the most notable pollsters are:
- Research & Branding Group, widely published throughout Ukraine and Internationally. Works include exit polls and regular surveys of the public's political opinions[21][22]
- Razumkov Centre A policy think tank also widely published throughout Ukraine[23]
- SOCIS (Socis center for social and political studies) [24]
In the United Kingdom, the most notable pollsters are:
- ComRes, retained pollster for the BBC and The Independent
- Ipsos MORI (formerly MORI).
- YouGov.
- GfK NOP
- ICM
- Populus, official The Times pollster
In the United States, some notable companies include:
- Gallup poll run by The Gallup Organization
- Harris Poll
- Ipsos
- National Opinion Research Center
- Nielsen ratings
- Pew Research Center
- Rasmussen Reports
- Research 2000
- YouGov.
- Zogby International
In Spain:
- Metroscopia
- Sigma 2
- TNS Demoscopia
- Opina
- Akra Delta
- Netquest
- ESEQ, Estudios sociales, políticos y de mercado
- Ipsos
All the major television networks, alone or in conjunction with the largest newspapers or magazines, in virtually every country with elections, operate their own versions of polling operations, in collaboration or independently through various applications. One of the applications can be found on Facebook [25]
Several organizations try to monitor the behavior of polling firms and the use of polling and statistical data, including the Pew Research Center and, in Canada, the Laurier Institute for the Study of Public Opinion and Policy.[26]
Failures
The best-known failure of opinion polling to date in the United States was the prediction that Thomas Dewey would defeat Harry S. Truman in the 1948 US presidential election. Major polling organizations, including Gallup and Roper, indicated a landslide victory for Dewey.
In the United Kingdom, most polls failed to predict the Conservative election victories of 1970 and 1992, and Labour's victory in 1974. However, their figures at other elections have been generally accurate.
Influence
Effect on voters
By providing information about voting intentions, opinion polls can sometimes influence the behavior of electors, and in his book The Broken Compass, Peter Hitchens asserts that opinion polls are actually a device for influencing public opinion.[27] The various theories about how this happens can be split into two groups: bandwagon/underdog effects, and strategic ("tactical") voting.
A bandwagon effect occurs when the poll prompts voters to back the candidate shown to be winning in the poll. The idea that voters are susceptible to such effects is old, stemming at least from 1884; William Safire reported that the term was first used in a political cartoon in the magazine Puck in that year.[28] It has also remained persistent in spite of a lack of empirical corroboration until the late 20th century. George Gallup spent much effort in vain trying to discredit this theory in his time by presenting empirical research. A recent meta-study of scientific research on this topic indicates that from the 1980s onward the Bandwagon effect is found more often by researchers.[29]
The opposite of the bandwagon effect is the underdog effect. It is often mentioned in the media. This occurs when people vote, out of sympathy, for the party perceived to be "losing" the elections. There is less empirical evidence for the existence of this effect than there is for the existence of the bandwagon effect.[29]
The second category of theories on how polls directly affect voting is called strategic or tactical voting. This theory is based on the idea that voters view the act of voting as a means of selecting a government. Thus they will sometimes not choose the candidate they prefer on ground of ideology or sympathy, but another, less-preferred, candidate from strategic considerations. An example can be found in the United Kingdom general election, 1997. As he was then a Cabinet Minister, Michael Portillo's constituency of Enfield Southgate was believed to be a safe seat but opinion polls showed the Labour candidate Stephen Twigg steadily gaining support, which may have prompted undecided voters or supporters of other parties to support Twigg in order to remove Portillo. Another example is the boomerang effect where the likely supporters of the candidate shown to be winning feel that chances are slim and that their vote is not required, thus allowing another candidate to win.
In addition, Mark Pickup in Cameron Anderson and Laura Stephenson's "Voting Behaviour in Canada" outlines three additional "behavioural" responses that voters may exhibit when faced with polling data.
The first is known as a "cue taking" effect which holds that poll data is used as a "proxy" for information about the candidates or parties. Cue taking is "based on the psychological phenomenon of using heuristics to simplify a complex decision" (243) [30]
The second, first described by Petty and Cacioppo (1996) is known as "cognitive response" theory. This theory asserts that a voter's response to a poll may not line with their initial conception of the electoral reality. In response, the voter is likely to generate a "mental list" in which they create reasons for a party's loss or gain in the polls. This can reinforce or change their opinion of the candidate and thus affect voting behaviour.
Third, the final possibility is a "behavioural response" which is similar to a cognitive response. The only salient difference is that a voter will go and seek new information to form their "mental list," thus becoming more informed of the election. This may then affect voting behaviour.
These effects indicate how opinion polls can directly affect political choices of the electorate. But directly or indirectly, other effects can be surveyed and analyzed on all political parties. The form of media framing and party ideology shifts must also be taken under consideration. Opinion polling in some instances is a measure of cognitive bias, which is variably considered and handled appropriately in its various applications.
Effect on politicians
Starting in the 1980s, tracking polls and related technologies began having a notable impact on U.S. political leaders.[31] According to Douglas Bailey, a Republican who had helped run Gerald Ford's 1976 presidential campaign, "It's no longer necessary for a political candidate to guess what an audience thinks. He can [find out] with a nightly tracking poll. So it's no longer likely that political leaders are going to lead. Instead, they're going to follow."[31]
Regulation
Some jurisdictions over the world restrict the publication of the results of opinion polls in order to prevent the possibly erroneous results from affecting voters' decisions. For instance, in Canada, it is prohibited to publish the results of opinion surveys that would identify specific political parties or candidates in the final three days before a poll closes.[32]
However, most western democratic nations don't support the entire prohibition of the publication of pre-election opinion polls; most of them have no regulation and some only prohibit it in the final days or hours until the relevant poll closes.[33] A survey by Canada's Royal Commission on Electoral Reform reported that the prohibition period of publication of the survey results largely differed in different countries. Out of the 20 countries examined, three prohibit the publication during the entire period of campaigns, while others prohibit it for a shorter term such as the polling period or the final 48 hours before a poll closes.[32]
See also
- Deliberative opinion poll
- Entrance poll
- Exit poll
- Open access poll
- Push poll
- Straw poll
- Sample size determination
- Electoral Calculus – United Kingdom election prediction website
Footnotes
- ^ a b Cantril, Hadley and Mildred Strunk (1951). Public Opinion, 1935-1946. Princeton University Press. p. vii.
- ^ Kenneth F. Warren (1992). "in Defense of Public Opinion Polling." Westview Press. p. 200-1.
- ^ About the Tracking Polls
- ^ An estimate of the margin of error in percentage terms can be gained by the formula 100 ÷ square root of sample size
- ^ publicagenda.org
- ^ Lynch, Scott M. Introduction to Bayesian Statistics and Estimation for Social Scientists (2007).
- ^ Langer, Gary (2003-05). "About Response Rates: Some Unresolved Questions". ABC News. http://abcnews.go.com/images/pdf/responserates.pdf. Retrieved 2010-05-17.
- ^ "Public Agenda Issue Guide: Higher Education - Public View - Red Flags". Public Agenda.
- ^ "Public Agenda Issue Guide: Gay Rights - Public View - Red Flags". Public Agenda.
- ^ "Public Agenda Issue Guide: Abortion - Public View - Red Flags". Public Agenda.
- ^ "The Seven Stages of Public Opinion". Public Agenda.
- ^ Keeter, Scott (2007-06-27). "How Serious Is Polling's Cell-Only Problem?". Pew Research Center Publications. http://pewresearch.org/pubs/515/polling-cell-only-problem.
- ^ Blumenthal, Mark (2008-09-19). "More Pollsters Interviewing By Cell Phone". Pollster.com. http://www.pollster.com/blogs/more_pollsters_interviewing_by.php. Retrieved 2008-11-04.
- ^ Blumenthal, Mark (2008-07-17). "New Pew data on cell phones". Pollster. http://www.pollster.com/blogs/new_pew_data_on_cell_phones.php. Retrieved 2008-11-04.
- ^ Blumberg SJ, Luke JV (2007-05-14) (PDF). Wireless Substitution: Early Release of Estimates Based on Data from the National Health Interview Survey, July–December 2006. Centers for Disease Control. http://www.cdc.gov/nchs/data/nhis/earlyrelease/wireless200705.pdf. Retrieved 2009-06-22.
- ^ Silver, Nate (2008-11-02). "The Cellphone effect, continued". FiveThirtyEight.com. http://www.fivethirtyeight.com/2008/11/cellphone-effect-continued.html. Retrieved 2008-11-04.
- ^ Blumenthal, Mark (2008-10-17). "More Cell Phone Data from Gallup". Pollster.com. http://www.pollster.com/blogs/more_cell_phone_data_from_gall.php. Retrieved 2008-11-04.
- ^ Silver, Nate (2008-07-22). "The Cellphone Problem, Revisited". FiveThirtyEight.com. http://www.fivethirtyeight.com/2008/07/cellphone-problem-revisited.html. Retrieved 2008-11-04.
- ^ The Public Opinion Poll Center
- ^ Alert. Journalist Abdollah Nouri released but another journalist arrested
- ^ "Research&Branding Group Poll: 26% Of Ukrainians Prepared To Support Yanukovych For President". The FINANCIAL website. August 19, 2009. http://www.finchannel.com/Main_News/Ukraine/45385_Research&Branding_Group_Poll:_26%25_Of_Ukrainians_Prepared_To_Support_Yanukovych_For_President/. Retrieved 2010-02-11.
- ^ Poll: "CHANGE OF ELECTORAL SITUATION IN UKRAINE - June 2009", Research & Branding Group (June, 2009)
- ^ (Ukrainian) Думка громадян України про підсумки 2008 р. (опитування), Razumkov Centre (December 26, 2008)
- ^ Socis Poll: 25% Of Ukrainians Prepared To Support Yanukovych For President, 20.5% To Vote For Tymoshenko, Ukrainian News (August 17, 2009)
- ^ Facebook | Poll
- ^ Laurier Institute for the Study of Public Opinion and Policy
- ^ Hitchens, Peter (2009). "Chapter 1, Guy Fawkes Gets a Blackberry". The Broken Compass: How British Politics Lost its Way. Continuum International Publishing Group Ltd. ISBN 1847064051.
- ^ Safire, William, Safire's Political Dictionary, page 42. Random House, 1993.
- ^ a b Irwin, Galen A. and Joop J. M. Van Holsteyn. Bandwagons, Underdogs, the Titanic and the Red Cross: The Influence of Public Opinion Polls on Voters (2000).
- ^ Anderson,, Cameron (2010). "10". Voting Behaviour in Canada. Vancouver: UBC Press. pp. 243–278.
- ^ a b Kaiser, Robert G. (March 9, 2011). "David S. Broder: The best political reporter of his time". The Washington Post. http://www.washingtonpost.com/wp-dyn/content/article/2011/03/09/AR2011030902885.html. Retrieved 2011-03-09.
- ^ a b Claude Emery (January 1994), Public opinion polling in Canada, Library of Parliament, Canada, http://www2.parl.gc.ca/content/lop/researchpublications/bp371-e.htm
- ^ Tim Bale (2002). "Restricting the broadcast and publication of pre-election and exit polls: some selected examples". Representation 39 (1): 15–22. doi:10.1080/00344890208523210.
External references
- Asher, Herbert: Polling and the Public. What Every Citizen Should Know, fourth edition. Washington, D.C.: CQ Press, 1998.
- Bourdieu, Pierre, "Public Opinion does not exist" in Sociology in Question, London, Sage (1995).
- Bradburn, Norman M. and Seymour Sudman. Polls and Surveys: Understanding What They Tell Us (1988).
- Cantril, Hadley. Gauging Public Opinion (1944).
- Cantril, Hadley and Mildred Strunk, eds. Public Opinion, 1935-1946 (1951), massive compilation of many public opinion polls from US, UK, Canada, Australia, and elsewhere.
- Converse, Jean M. Survey Research in the United States: Roots and Emergence 1890-1960 (1987), the standard history.
- Crespi, Irving. Public Opinion, Polls, and Democracy (1989).
- Gallup, George. Public Opinion in a Democracy (1939).
- Gallup, Alec M. ed. The Gallup Poll Cumulative Index: Public Opinion, 1935-1997 (1999) lists 10,000+ questions, but no results.
- Gallup, George Horace, ed. The Gallup Poll; Public Opinion, 1935-1971 3 vol (1972) summarizes results of each poll.
- Glynn, Carroll J., Susan Herbst, Garrett J. O'Keefe, and Robert Y. Shapiro. Public Opinion (1999) textbook
- Lavrakas, Paul J. et al. eds. Presidential Polls and the News Media (1995)
- Moore, David W. The Superpollsters: How They Measure and Manipulate Public Opinion in America (1995).
- Niemi, Richard G., John Mueller, Tom W. Smith, eds. Trends in Public Opinion: A Compendium of Survey Data (1989).
- Oskamp, Stuart and P. Wesley Schultz; Attitudes and Opinions (2004).
- Robinson, Claude E. Straw Votes (1932).
- Robinson, Matthew Mobocracy: How the Media's Obsession with Polling Twists the News, Alters Elections, and Undermines Democracy (2002).
- Rogers, Lindsay. The Pollsters: Public Opinion, Politics, and Democratic Leadership (1949).
- Traugott, Michael W. The Voter's Guide to Election Polls 3rd ed. (2004).
- James G. Webster, Patricia F. Phalen, Lawrence W. Lichty; Ratings Analysis: The Theory and Practice of Audience Research Lawrence Erlbaum Associates, 2000.
- Young, Michael L. Dictionary of Polling: The Language of Contemporary Opinion Research (1992).
Additional Sources
- Walden, Graham R. Survey Research Methodology, 1990-1999: An Annotated Bibliography. Bibliographies and Indexes in Law and Political Science Series. Westport, CT: Greenwood Press, Greenwood Publishing Group, Inc., 2002. xx, 432p.
- Walden, Graham R. Public Opinion Polls and Survey Research: A Selective Annotated Bibliography of U.S. Guides and Studies from the 1980s. Public Affairs and Administrative Series, edited by James S. Bowman, vol. 24. New York, NY: Garland Publishing Inc., 1990. xxix, 360p.
- Walden, Graham R. Polling and Survey Research Methods 1935-1979: An Annotated Bibliography. Bibliographies and Indexes in Law and Political Science Series, vol. 25. Westport, CT: Greenwood Publishing Group, Inc., 1996. xxx, 581p.
External links
- Polls from UCB Libraries GovPubs
- The Pew Research Center nonpartisan "fact tank" providing information on the issues, attitudes and trends shaping America and the world by conducting public opinion polling and social science research
- "Use Opinion Research To Build Strong Communication" by Frank Noto
- Public Agenda for Citizens nonpartisan, nonprofit group that tracks public opinion data in the United States
- National Council on Public Polls association of polling organizations in the United States devoted to setting high professional standards for surveys
- USA Election Polls tracks the public opinion polls related to elections in the US
- Survey Analysis Tool based on A. Berkopec, HyperQuick algorithm for discrete hypergeometric distribution, Journal of Discrete Algorithms, Elsevier, 2006.
- "Poll Position - Issue 010 - GOOD", track record of pollsters for USA presidential elections in Good magazine, April 23, 2008.
Social surveys Gathering data Collection methods · Census · Sampling for surveys · Random sampling · Questionnaire · Interview (Structured, Semi-structured and Unstructured)
Analyzing data Applications Market research · Opinion pollMajor surveys Professional
associationsCategory · Projects (Business · Politics · Psychology · Sociology · Statistics)Categories:- Polling
- Types of polling
- Survey methodology
- Psychometrics
- Public opinion
- Sampling (statistics)
Wikimedia Foundation. 2010.