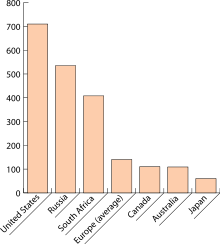
- Bar chart
-
See also: Histogram
A bar chart or bar graph is a chart with rectangular bars with lengths proportional to the values that they represent. The bars can be plotted vertically or horizontally.
Bar charts are used for marking clear data which has learned values. Some examples of discontinuous data include 'shoe size' or 'eye color', for which you would use a bar chart. In contrast, some examples of continuous data would be 'height' or 'weight'. A bar chart is very useful if you are trying to record certain information whether it is continuous or not continuous data. Bar charts also look a lot like a histogram.They are often mistaken for each other.
Bar Graph- is a graph use to compare two or more variables.External links
Template:Common scat
- How to Construct Bad Charts and Graphs
- Directory of graph software and online tools (many can handle bar charts)
- Create A Graph. Free online graph creation tool at the website for the National Center for Education Statistics (NCES)
Categories:- Statistical charts and diagrams
Wikimedia Foundation. 2010.

