- Stellar classification
-
In astronomy, stellar classification is a classification of stars based on their spectral characteristics. The spectral class of a star is a designated class of a star describing the ionization of its chromosphere, what atomic excitations are most prominent in the light, giving an objective measure of the temperature in this chromosphere. Light from the star is analyzed by splitting it up by a diffraction grating, subdividing the incoming photons into a spectrum exhibiting a rainbow of colors interspersed by absorption lines, each line indicating a certain ion of a certain chemical element. The presence of a certain chemical element in such an absorption spectrum primarily indicates that the temperature conditions are suitable for a certain excitation of this element. If the star temperature has been determined by a majority of absorption lines, unusual absences or strengths of lines for a certain element may indicate an unusual chemical composition of the chromosphere.
Most stars are currently classified using the letters O, B, A, F, G, K, and M (usually memorized by astrophysicists as "Oh, be a fine girl/guy, kiss me"), where O stars are the hottest and the letter sequence indicates successively cooler stars up to the coolest M class. According to informal tradition, O stars are called "blue", B "blue-white", A stars "white", F stars "yellow-white", G stars "yellow", K stars "orange", and M stars "red", even though the actual star colors perceived by an observer may deviate from these colors depending on visual conditions and individual stars observed. The current non-alphabetical scheme developed from an earlier scheme using all letters from A to O; the original letters were retained but the star classes were re-ordered in the current temperature order when the connection between the stars' class and temperatures became clear. A few star classes were dropped as duplicates of others.
In the current star classification system, the Morgan-Keenan system, the spectrum letter is enhanced by a number from 0 to 9 indicating tenths of the range between two star classes, so that A5 is five tenths between A0 and F0, but A2 is two tenths of the full range from A0 to F0. Lower numbered stars in the same class are hotter. Another dimension that is included in the Morgan-Keenan system is the luminosity class expressed by the Roman numbers I, II, III, IV and V, expressing the width of certain absorption lines in the star's spectrum. It has been shown that this feature is a general measure of the size of the star, and thus of the total luminosity output from the star. Class I are generally called supergiants, class III simply giants and class V either dwarfs or more properly main sequence stars. For example, our Sun has the spectral type G2V, which might be interpreted as "a 'yellow' two tenths towards 'orange' main sequence star". The apparently brightest star Sirius has type A1V.
Secchi classes
During the 1860s and 1870s, pioneering stellar spectroscopist Father Angelo Secchi created the Secchi classes in order to classify observed spectra. By 1866, he had developed three classes of stellar spectra:[1][2][3]
- Class I: white and blue stars with broad heavy hydrogen lines, such as Vega and Altair. This includes the modern class A and early class F.
- Class I, Orion subtype: a subtype of class I with narrow lines in place of wide bands, such as Rigel and Bellatrix. In modern terms, this corresponds to early B-type stars.
- Class II: yellow stars—hydrogen less strong, but evident metallic lines, such as the Sun, Arcturus and Capella. This includes the modern classes G and K as well as late class F.
- Class III: orange to red stars with complex band spectra, such as Betelgeuse and Antares. This corresponds to the modern class M.
In 1868, he discovered carbon stars, which he put into a distinct group:[4]
- Class IV: red stars with significant carbon bands and lines (carbon stars.)
In 1877, he added a fifth class:[5]
- Class V: emission-line stars, such as γ Cassiopeiae and Sheliak.
In the late 1890s, this classification began to be superseded by the Harvard classification, which is discussed in the remainder of this article.[6][7]
Harvard spectral classification
The Harvard classification system is a one-dimensional classification scheme. Stars vary in surface temperature from about 2,000 to 40,000 kelvins. Physically, the classes indicate the temperature of the star's atmosphere and are normally listed from hottest to coldest, as is done in the following table:
Class Temperature[8]
(kelvins)Conventional color Apparent color[9][10][11] Mass[8]
(solar masses)Radius[8]
(solar radii)Luminosity[8]
(bolometric)Hydrogen
linesFraction of all
main sequence stars[12]O ≥ 33,000 K blue blue ≥ 16 M☉ ≥ 6.6 R☉ ≥ 30,000 L☉ Weak ~0.00003% B 10,000–33,000 K blue to blue white blue white 2.1–16 M☉ 1.8–6.6 R☉ 25–30,000 L☉ Medium 0.13% A 7,500–10,000 K white white to blue white 1.4–2.1 M☉ 1.4–1.8 R☉ 5–25 L☉ Strong 0.6% F 6,000–7,500 K yellowish white white 1.04–1.4 M☉ 1.15–1.4 R☉ 1.5–5 L☉ Medium 3% G 5,200–6,000 K yellow yellowish white 0.8–1.04 M☉ 0.96–1.15 R☉ 0.6–1.5 L☉ Weak 7.6% K 3,700–5,200 K orange yellow orange 0.45–0.8 M☉ 0.7–0.96 R☉ 0.08–0.6 L☉ Very weak 12.1% M ≤ 3,700 K red orange red ≤ 0.45 M☉ ≤ 0.7 R☉ ≤ 0.08 L☉ Very weak 76.45% The mass, radius, and luminosity listed for each class are appropriate only for stars on the main sequence portion of their lives and so are not appropriate for red giants. The spectral classes O through M are subdivided by Arabic numerals (0–9). For example, A0 denotes the hottest stars in the A class and A9 denotes the coolest ones. The Sun is classified as G2.
Classifications in the Draper Catalogue of Stellar Spectra[13][14] Secchi Draper Comment I A, B, C, D Hydrogen lines dominant. II E, F, G, H, I, K, L III M IV N Did not appear in the catalogue. O Wolf-Rayet spectra with bright lines. P Planetary nebulae. Q Other spectra. The reason for the odd arrangement of letters is historical. An early classification of spectra by Angelo Secchi in the 1860s divided stars into those with prominent lines from the hydrogen Balmer series (group I, with a subtype representing many of the stars in Orion); those with spectra which, like the Sun, showed calcium and sodium lines (group II); colored stars whose spectra showed wide bands (group III); and carbon stars (group IV).[15] In the 1880s, the astronomer Edward C. Pickering began to make a survey of stellar spectra at the Harvard College Observatory, using the objective-prism method. A first result of this work was the Draper Catalogue of Stellar Spectra, published in 1890. Williamina Fleming classified most of the spectra in this catalogue. It used a scheme in which the previously used Secchi classes (I to IV) were divided into more specific classes, given letters from A to N. Also, the letters O, P and Q were used, O for stars whose spectra consisted mainly of bright lines, P for planetary nebulae, and Q for stars not fitting into any other class.[13][14]
In 1897, another worker at Harvard, Antonia Maury, placed the Orion subtype of Secchi class I ahead of the remainder of Secchi class I, thus placing the modern type B ahead of the modern type A. She was the first to do so, although she did not use lettered spectral types, but rather a series of 22 types numbered from I to XXII.[16][17] In 1901, Annie Jump Cannon returned to the lettered types, but dropped all letters except O, B, A, F, G, K, and M, used in that order, as well as P for planetary nebulae and Q for some peculiar spectra. She also used types such as B5A for stars halfway between types B and A, F2G for stars one-fifth of the way from F to G, and so forth.[18][19] Finally, by 1912, Cannon had changed the types B, A, B5A, F2G, etc. to B0, A0, B5, F2, etc.[20][21] This is essentially the modern form of the Harvard classification system.
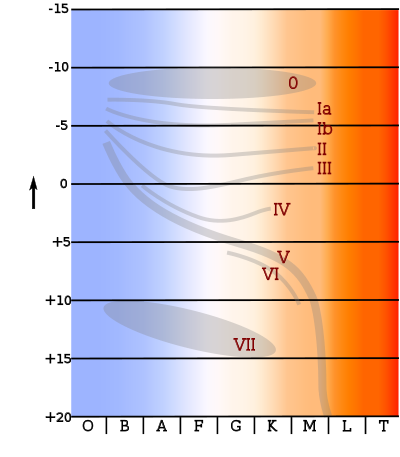
 The Hertzsprung-Russell diagram relates stellar classification with absolute magnitude, luminosity, and surface temperature.
The fact that the Harvard classification of a star indicated its surface temperature was not fully understood until after its development. In the 1920s, the Indian physicist Meghnad Saha derived a theory of ionization by extending well-known ideas in physical chemistry pertaining to the dissociation of molecules to the ionization of atoms. First applied to the solar chromosphere, he then applied it to stellar spectra.[22] The Harvard astronomer Cecilia Helena Payne (later to become Cecilia Payne-Gaposchkin) then demonstrated that the OBAFGKM spectral sequence is actually a sequence in temperature.[23] Because the classification sequence predates our understanding that it is a temperature sequence, the placement of a spectrum into a given subtype, such as B3 or A7, depends upon (largely subjective) estimates of the strengths of absorption features in stellar spectra. As a result, these subtypes are not evenly divided into any sort of mathematically representable intervals.
O, B, and A stars are sometimes misleadingly called "early type", while K and M stars are said to be "late type". This stems from an early 20th century model of stellar evolution in which stars were powered by gravitational contraction via the Kelvin–Helmholtz mechanism in which stars start their lives as very hot "early-type" stars, and then gradually cool down, thereby evolving into "late-type" stars. This mechanism provided ages of the Sun that were much smaller than what is observed, and was rendered obsolete by the discovery that stars are powered by nuclear fusion. However, brown dwarfs, whose energy comes from gravitational attraction alone, cool as they age and so progress to later spectral types. The highest-mass brown dwarfs start their lives with M-type spectra and will cool through the L, T, and Y spectral classes.
Spectrum images by Harvard spectral class

Conventional and apparent colors
The conventional color descriptions are traditional in astronomy, and represent colors relative to the mean color of an A class star which is considered to be white. The apparent color[9] descriptions are what the observer would see if trying to describe the stars under a dark sky without aid to the eye, or with binoculars. The table colors used are D65 standard colors, which is what one would see if the star light would be intensely magnified and projected onto a white paper, then observed in ordinary daylight.[24] Most stars in the sky, except the brightest ones, appear white or bluish white to the unaided eye because they are too dim for color vision to work.
Our Sun itself is white. It is sometimes called a yellow star (spectroscopically, relative to Vega), and may appear yellow or red (viewed through the atmosphere), or appear white (viewed when too bright for the eye to see any color). Astronomy images often use a variety of exaggerated colors (partially founded in faint-light conditions observations, partially in conventions). But the Sun's own intrinsic color is white (aside from sunspots), with no trace of color, and closely approximates a black body of 5780 K (see color temperature). This is a natural consequence of the evolution of human optical senses: the response curve that maximizes the overall efficiency against solar illumination will by definition perceive the Sun as white. The Sun is known as a G-type star.
Yerkes spectral classification
The Yerkes spectral classification, also called the MKK system from the authors' initials, is a system of stellar spectral classification introduced in 1943 by William Wilson Morgan, Philip C. Keenan, and Edith Kellman from Yerkes Observatory.[25] This two-dimensional (temperature and luminosity) classification scheme is based on spectral lines sensitive to stellar temperature and surface gravity which is related to luminosity (whilst the Harvard classification is based on surface temperature only). Later, in 1953, after some revisions of list of standard stars and classification criteria, the scheme was named MK (by William Wilson Morgan and Phillip C. Keenan initials).[26]
Since the radius of a giant star is much greater than a dwarf star while their masses are roughly comparable, the gravity and thus the gas density and pressure on the surface of a giant star are much lower than for a dwarf. These differences manifest themselves in the form of luminosity effects which affect both the width and the intensity of spectral lines which can then be measured. Denser stars with higher surface gravity will exhibit greater pressure broadening of spectral lines.
A number of different luminosity classes are distinguished:
 Spectral Type
- 0 hypergiants
- I supergiants
- Ia-0 (hypergiants or extremely luminous supergiants (later addition)), Example: Eta Carinae (spectrum-peculiar)
- Ia (luminous supergiants), Example: Deneb (spectrum is A2Ia)
- Iab (intermediate luminous supergiants) Example: Betelgeuse (spectrum is M2Iab)
- Ib (less luminous supergiants)
- II bright giants
- IIa, Example: β Scuti (HD 173764) (spectrum is G4 IIa)
- IIab Example: HR 8752 (spectrum is G0Iab:)
- IIb, Example: HR 6902 (spectrum is G9 IIb)
- III normal giants
- IIIa, Example: ρ Persei (spectrum is M4 IIIa)
- IIIab Example: δ Reticuli (spectrum is M2 IIIab)
- IIIb, Example: Pollux (spectrum is K2 IIIb)
- IV subgiants
- IVa, Example: ε Reticuli (spectrum is K1-2 IVa-III)
- IVb, Example: HR 672 A (spectrum is G0.5 IVb)
- V main sequence stars (dwarfs)
- Va, Example: AD Leonis (spectrum M4Vae)
- Vab[27]
- Vb, Example: 85 Pegasi A (spectrum G5 Vb)
- "Vz", Example: LH10 : 3102 (spectrum O7 Vz), located in the Large Magellanic Cloud.[28]
- VI subdwarfs. Subdwarfs are generally represented with a prescript of sd or esd (extreme subdwarf) in front of the spectra.
- sd, Example: SSSPM J1930-4311 (spectrum sdM7)
- esd, Example: APMPM J0559-2903 (spectrum esdM7)
- VII (uncommon) white dwarfs. White dwarfs are represented with a prescript wD or WD.
Marginal cases are allowed; for instance a star classified as Ia-0 would be a very luminous supergiant, verging on hypergiant. Examples are below. The spectral type of the star is not a factor.
Marginal Symbols Example Explanation - G2 I-II A star is between supergiant and bright giant. + O9.5 Ia+ A star is a hypergiant star. / M2 IV/V A star is either a subgiant or a dwarf star. Spectral types
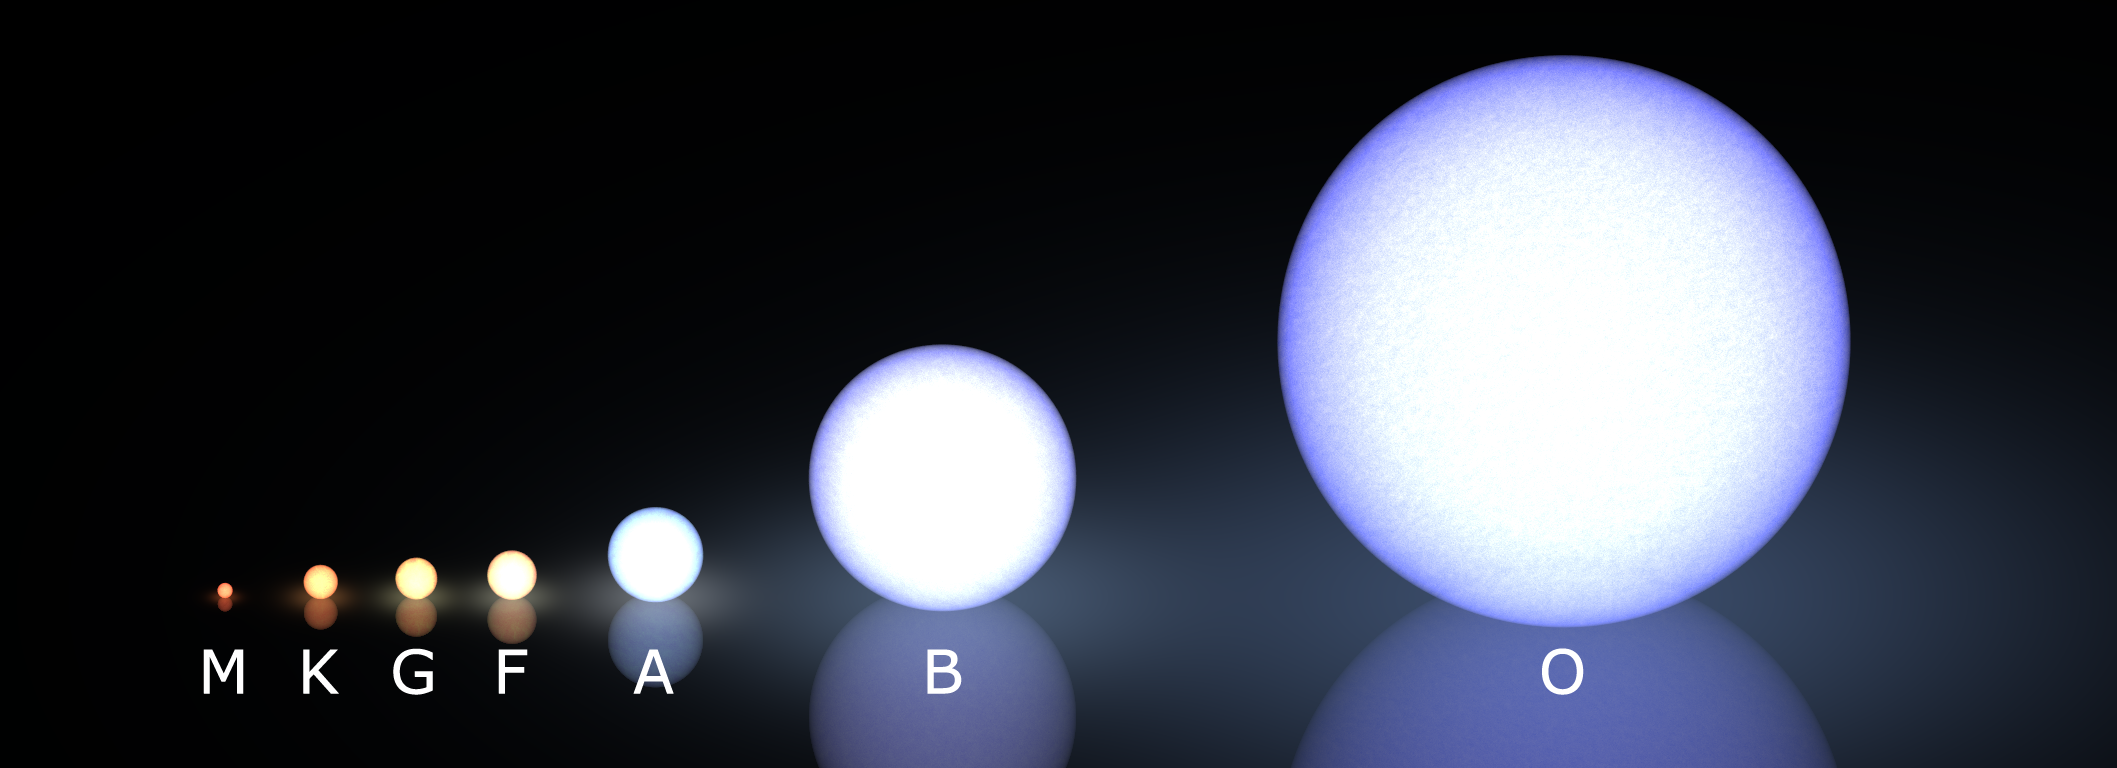
 The Morgan-Keenan spectral classification
The following illustration represents star classes with the colors very close to those actually perceived by the human eye. The relative sizes are for main-sequence or "dwarf" stars.
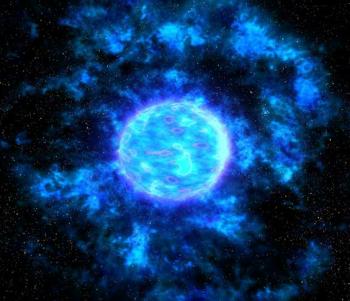
Class O
Main article: O-type main-sequence starClass O stars are very hot and extremely luminous, being bluish in color; in fact, most of their output is in the ultraviolet range. These are the rarest of all main-sequence stars. About 1 in 3,000,000 of the main-sequence stars in the solar neighborhood are Class O stars.[nb 1][12] Some of the most massive stars lie within this spectral class. Type-O stars are so hot as to have complicated surroundings which make measurement of their spectra difficult.
 Spectrum of an O5 V star
O-stars shine with a power over a million times our Sun's output. These stars have dominant lines of absorption and sometimes emission for He II lines, prominent ionized (Si IV, O III, N III, and C III) and neutral helium lines, strengthening from O5 to O9, and prominent hydrogen Balmer lines, although not as strong as in later types. Because they are so massive, class O stars have very hot cores, thus burn through their hydrogen fuel very quickly, and so are the first stars to leave the main sequence. Recent observations by the Spitzer Space Telescope indicate that planetary formation does not occur around other stars in the vicinity of an O class star due to the photoevaporation effect.[29]
When the MKK classification scheme was first described in 1943, the only subtypes of class O used were O5 to O9.5.[30] The MKK scheme was extended to O4 in 1978,[31] and new classification schemes have subsequently been introduced which add types O2, O3 and O3.5. O3 stars are the hottest currently known stars of conventional structure.[32]
- Examples: Zeta Orionis, Zeta Puppis, Lambda Orionis, Delta Orionis, Theta¹ Orionis C, HD 93129A
Class B
Main article: B-type main-sequence star Proper motion of stars spectral classes B and A in -/+ 200 000 years
Class B stars are very luminous and blue. Their spectra have neutral helium, which are most prominent at the B2 subclass, and moderate hydrogen lines. Ionized metal lines include Mg II and Si II. As O and B stars are so powerful, they only live for a very short time, and thus they do not stray far from the area in which they were formed.
These stars tend to cluster together in what are called OB associations, which are associated with giant molecular clouds. The Orion OB1 association occupies a large portion of a spiral arm of our galaxy and contains many of the brighter stars of the constellation Orion. About 1 in 800 of the main-sequence stars in the solar neighborhood are Class B stars.[nb 1][12]
- Examples: Rigel, Spica, the brighter Pleiades, VV Cephei B, Algol A
Class A
Main article: A-type main-sequence star Class A Vega (left) compared to the Sun (right).
Class A stars are amongst the more common naked eye stars, and are white or bluish-white. They have strong hydrogen lines, at a maximum by A0, and also lines of ionized metals (Fe II, Mg II, Si II) at a maximum at A5. The presence of Ca II lines is notably strengthening by this point. About 1 in 160 of the main-sequence stars in the solar neighborhood are Class A stars.[nb 1][12]
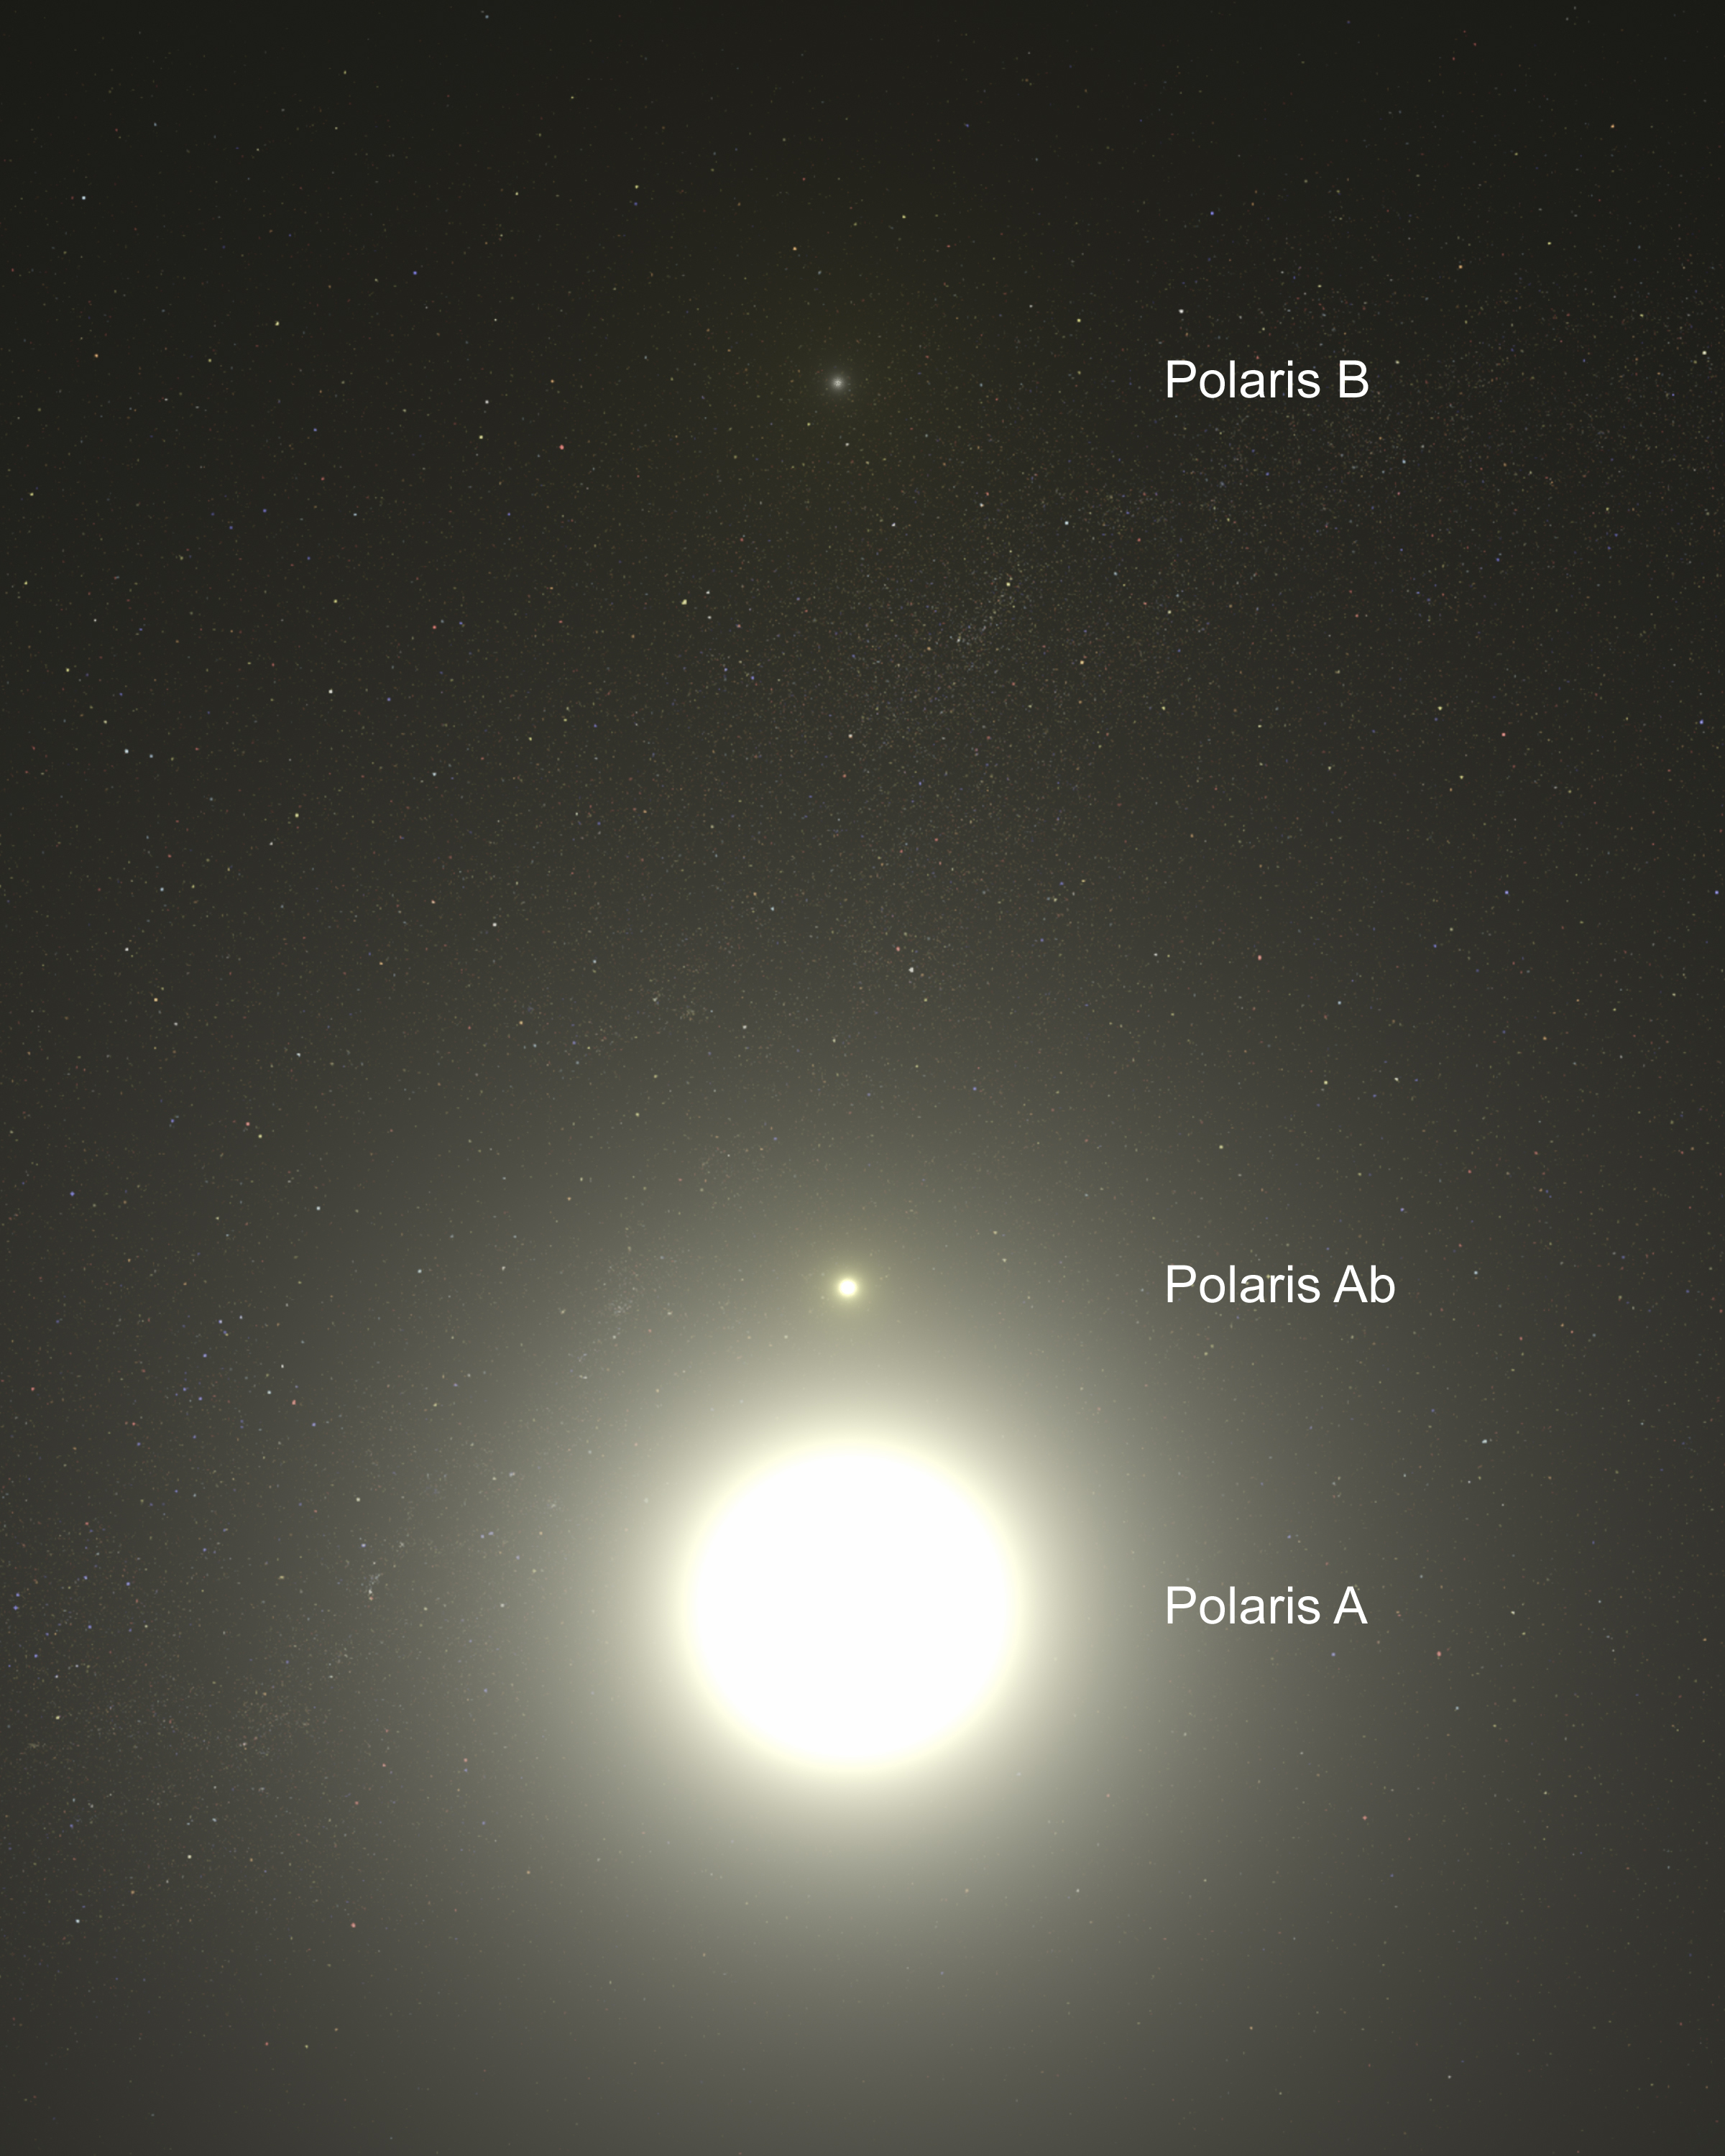
 Two Class F stars: Supergiant Polaris A and its distant companion Polaris B[33]
Class F
Main article: F-type main-sequence starClass F stars have strengthening H and K lines of Ca II. Neutral metals (Fe I, Cr I) beginning to gain on ionized metal lines by late F. Their spectra are characterized by the weaker hydrogen lines and ionized metals. Their color is white. About 1 in 33 of the main-sequence stars in the solar neighborhood are Class F stars.[nb 1][12]
Class G
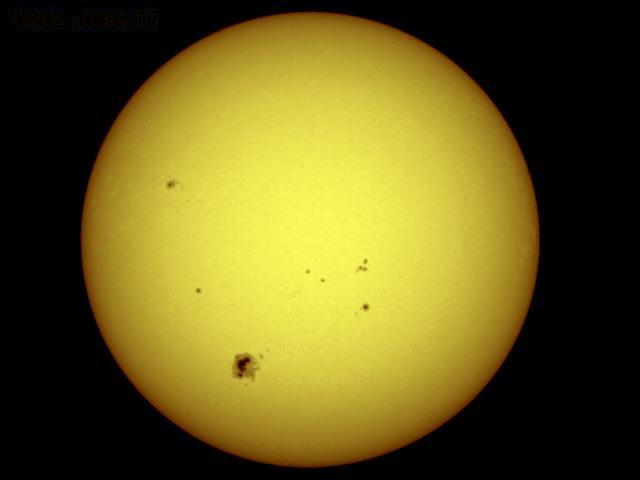
"G star" redirects here. For other uses, see G star (disambiguation).Main article: G-type main-sequence star The most important class G star to humanity: the Sun. The dark area visible in the lower left is a large sunspot.
 The movement of stars of spectral class G around the apex (left) and antapex (right) in -/+ 200 000 years
Class G stars are probably the best known, if only for the reason that the Sun is of this class. About one in thirteen of the main-sequence stars in the solar neighborhood are Class G stars.[nb 1][12]
Most notable are the H and K lines of Ca II, which are most prominent at G2. They have even weaker hydrogen lines than F, but along with the ionized metals, they have neutral metals. There is a prominent spike in the G band of CH molecules. G is host to the "Yellow Evolutionary Void".[34] Supergiant stars often swing between O or B (blue) and K or M (red). While they do this, they do not stay for long in the G classification as this is an extremely unstable place for a supergiant to be.
Class K
Main article: K-type main-sequence star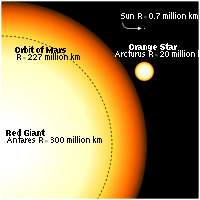 Comparison between Class K star Arcturus, Class M Antares, and Sol.
Class K are orangish stars that are slightly cooler than our Sun. Some K stars are giants and supergiants, such as Arcturus, while orange dwarfs, like Alpha Centauri B, are main-sequence stars. They have extremely weak hydrogen lines, if they are present at all, and mostly neutral metals (Mn I, Fe I, Si I).
By late K, molecular bands of titanium oxide become present. About one in eight of the main-sequence stars in the solar neighborhood are Class K stars.[nb 1][12] There is a suggestion that K Spectrum stars are very well suited for biology.[35]
- Examples: Alpha Centauri B, Epsilon Eridani, Arcturus, Aldebaran, Algol B
Class M
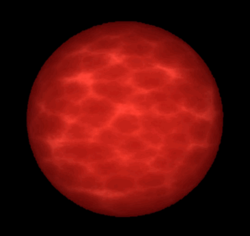
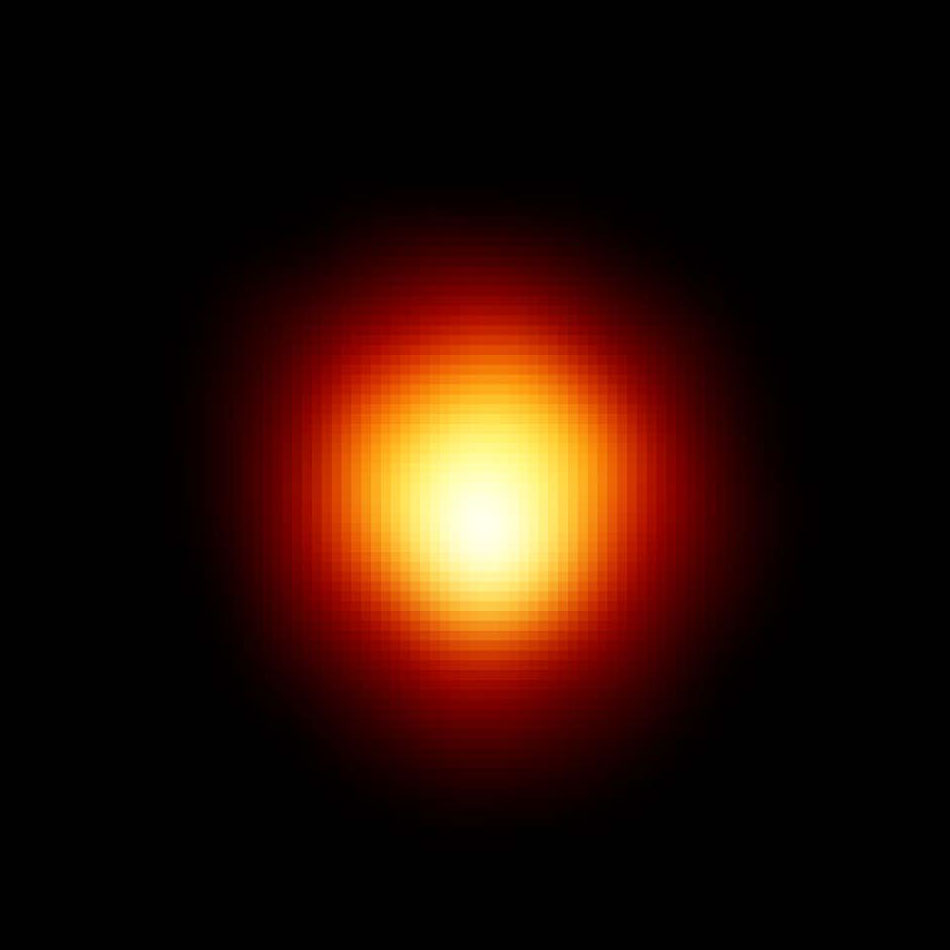
 Betelgeuse is a red supergiant, one of the largest stars known. Image from the Hubble Space Telescope.
Class M is by far the most common class. About 76% of the main-sequence stars in the Solar neighborhood are Class M stars.[nb 1][nb 2][12]
Although most Class M stars are red dwarfs, the class also hosts most giants and some supergiants such as Antares and Betelgeuse, as well as Mira variables. The late-M group holds hotter brown dwarfs that are above the L spectrum. This is usually in the range of M6.5 to M9.5. The spectrum of an M star shows lines belonging to molecules and all neutral metals but hydrogen lines are usually absent. Titanium oxide can be strong in M stars, usually dominating by about M5. Vanadium oxide bands become present by late M.
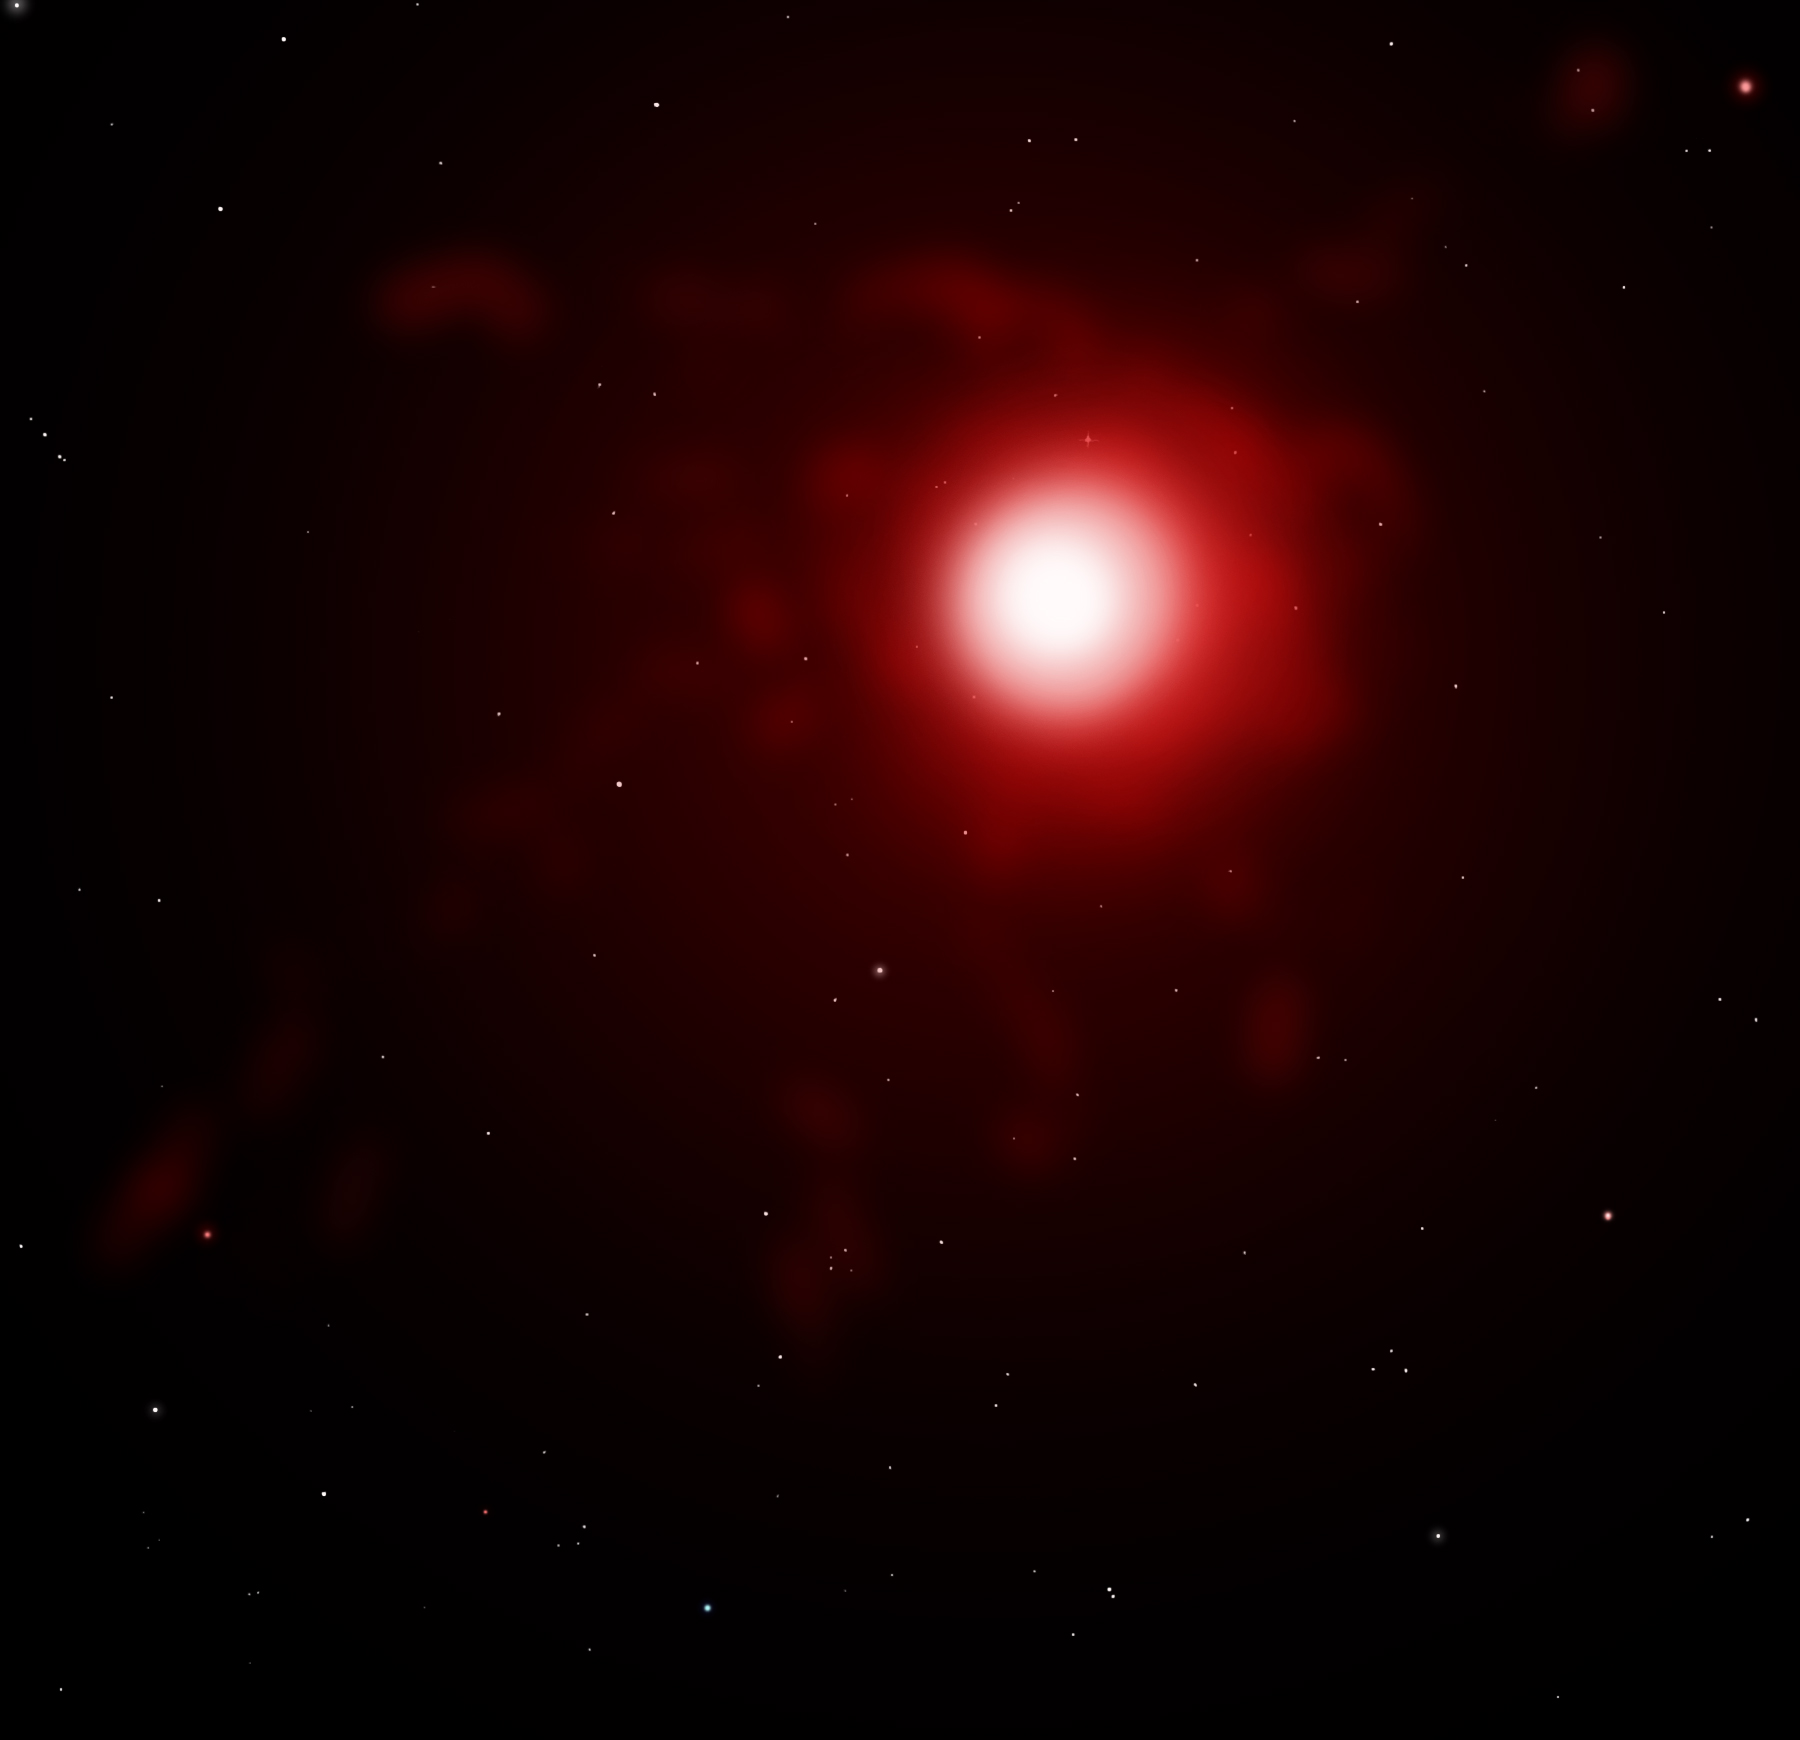
 VY Canis Majoris is a Class M hypergiant. Its true size is debated, as it ejects much of its mass off of its atmosphere in wild flares that stretch well beyond the star itself. Artist's impression.
- Example: VY Canis Majoris (hypergiant)
- Examples: Betelgeuse, Antares (supergiants)
- Examples: Rasalgethi, Beta Pegasi (giants)
- Examples: Proxima Centauri, Barnard's star, Gliese 581 (red dwarf)
- Examples: LEHPM 2-59,[36] SSSPM J1930-4311 (subdwarf)
- Example: APMPM J0559-2903 (extreme subdwarf)
- Examples: Teide 1 (field brown dwarf), GSC 08047-00232 B [37] (companion brown dwarf)
Extended spectral types
A number of new spectral types have been taken into use from newly discovered types of stars.
Hot blue emission star classes
Spectra of some very hot and bluish stars exhibit marked emission lines from carbon or nitrogen, or sometimes oxygen.
Class W: Wolf-Rayet
Main article: Wolf-Rayet star Artist's impression of a Wolf-Rayet star
Class W or WR represents the superluminous Wolf-Rayet stars, notably unusual since they have mostly helium in their atmospheres instead of hydrogen. They are thought to be dying supergiants with their hydrogen layer blown away by hot stellar winds caused by their high temperatures, thereby directly exposing their hot helium shell. Class W is subdivided into subclasses WN (WNE early-type, WNL late-type) and WC (WCE early-type, WCL late-type, and extend class WO), according to the dominance of nitrogen and carbon emission lines in their spectra (and outer layers).[38]
- WR spectra range is listed below:
- WN[38]
- WNE (WN2 to WN5 with some WN6)
- WNL (WN7 to WN9 with some WN6)
- Extended WN class (WN10 to WN11), was created to encompass the Ofpe/WN9 stars.[38]
- WN/C, and intermediate class between the nitrogen-rich and carbon-rich WR stars.[38]
- WC[38]
- WCE (WC4 to WC6)
- WCL (WC7 to WC9)
- WO (WO1 to WO4)
- W: Up to 70,000 K
- Example: WR124 (WN)
- Example: Gamma Velorum A (WC)
- Example: WR93B (WO)
Intermediary between the genuine Wolf-Rayets and ordinary hot stars of classes O and early B, there are OC, ON, BC and BN stars. They seem to constitute a short continuum from the Wolf-Rayets into the ordinary OBs.
- Example: HD 152249 (OC)
- Example: HD 105056 (ON)
- Example: HD 2905 (BC)
- Example: HD 163181 (BN)
The "Slash" stars
The slash stars are stars with O-type spectra and WN sequence in their spectra. The name slash comes from their spectra having a slash.
- Example spectra: Of/WNL[28]
There is a secondary group found with this spectra, a cooler, "intermediate" group. They are found in the Large Magellanic Cloud and have a designation of Ofpe/WN9.[28]
The Magnetic O stars
They are O stars with strong magnetic fields. Designation is Of?p[28]
The "class" OB
Main article: OB starIn lists of spectra, the "spectrum OB" may occur. This is in fact not a spectrum, but a marker which means that "the spectrum of this star is unknown, but it belongs to an OB association, so probably either a class O or class B star, or perhaps a fairly hot class A star."
Cool red and brown dwarf classes
The new spectral types L and T were created to classify infrared spectra of cool stars. This included both red dwarfs and brown dwarfs which are very faint in the visual spectrum. The hypothetical spectral type Y has been reserved for objects cooler than T dwarfs which have spectra that are qualitatively distinct from T dwarfs.[39]
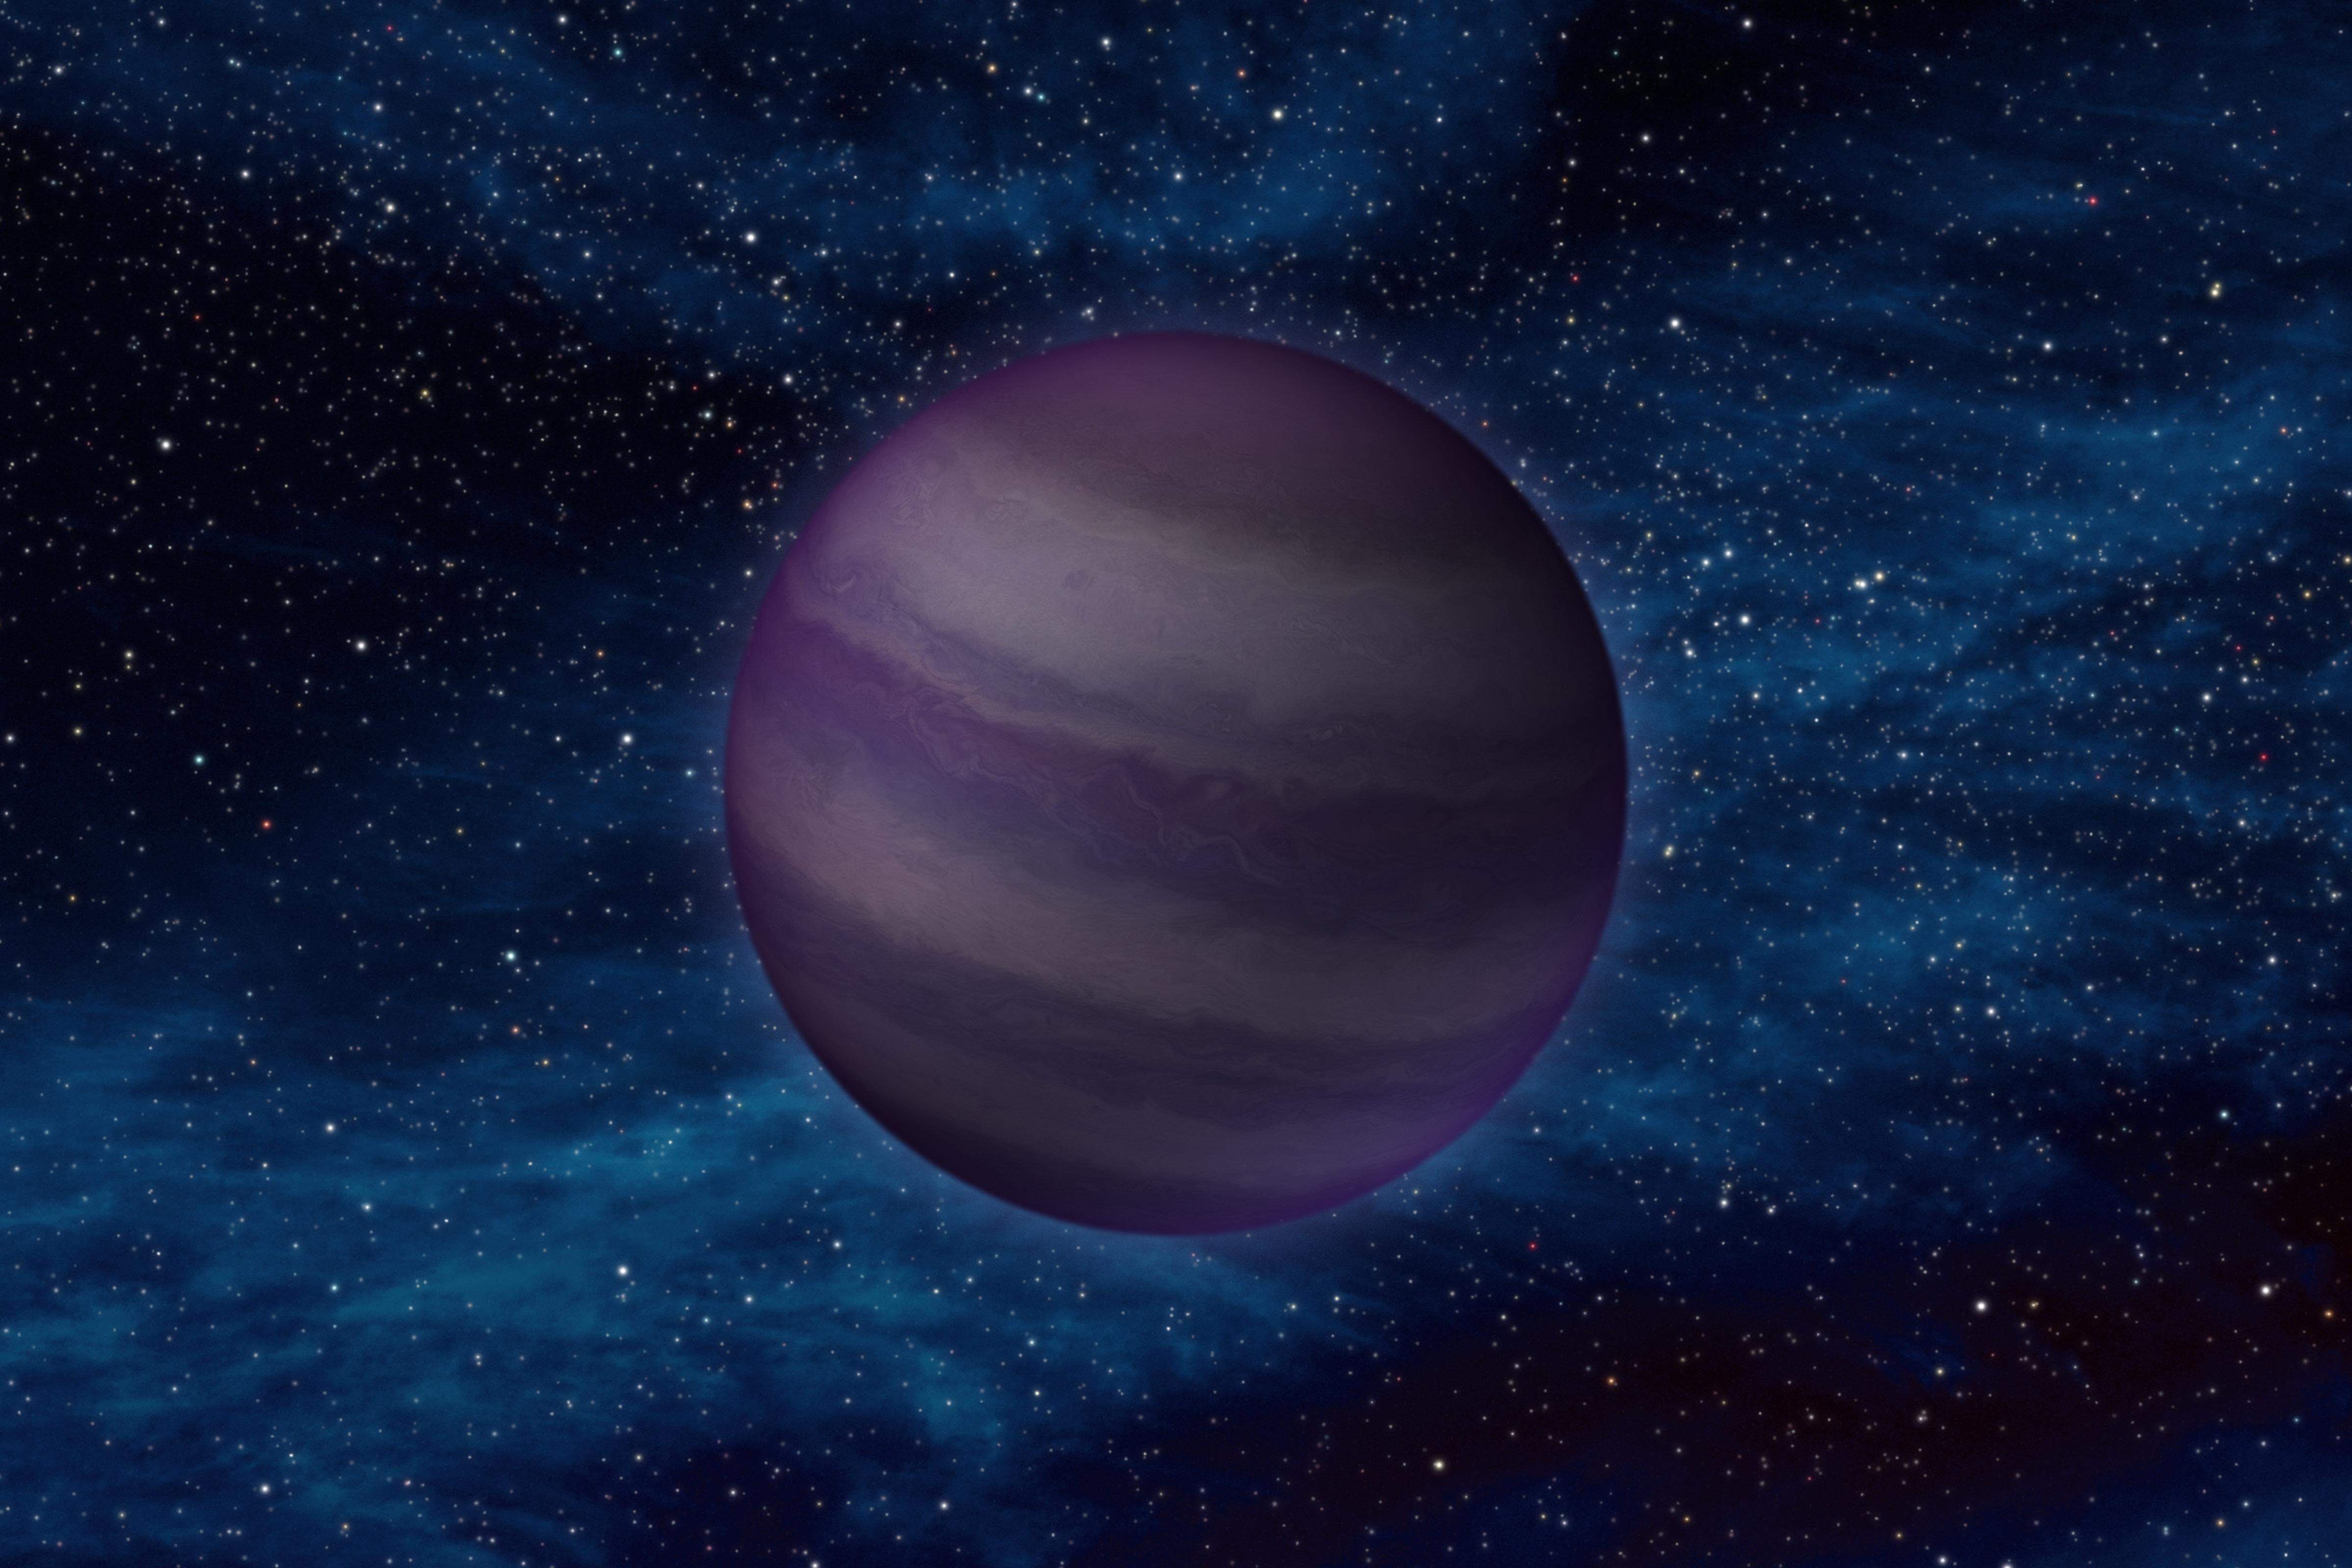
Class L
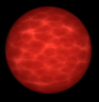
 Artist's vision of an L-dwarf
Class L dwarfs get their designation because they are cooler than M stars and L is the remaining letter alphabetically closest to M. L does not mean lithium dwarf; a large fraction of these stars do not have lithium in their spectra. Some of these objects have masses large enough to support hydrogen fusion, but some are of substellar mass and do not, so collectively these objects should be referred to as L dwarfs, not L stars. They are a very dark red in color and brightest in infrared. Their atmosphere is cool enough to allow metal hydrides and alkali metals to be prominent in their spectra.[40][41] Due to low gravities in giant stars, TiO- and VO-bearing condensates never form. Thus, larger L-type stars can never form in an isolated environment. It may be possible for these L-type supergiants to form through stellar collisions, however, an example of which is V838 Monocerotis.
- L: 1,300–2,000 K, dwarfs (some stellar, some substellar) with metal hydrides and alkali metals prominent in their spectra.
- Example: VW Hyi
- Example: 2MASSW J0746425+2000321 binary[42]
- Component A is an L dwarf star
- Component B is an L brown dwarf
- Example: LSR 1610-0040 (subdwarf)[43]
- Example: V838 Monocerotis (supergiants)
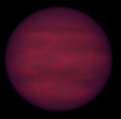
Class T: methane dwarfs
 Artist's vision of a T-dwarf
Class T dwarfs are cool brown dwarfs with surface temperatures between approximately 700 and 1,300 K. Their emission peaks in the infrared. Methane is prominent in their spectra.[40][41]
- T: ~700-1,300 K, cooler brown dwarfs with methane in the spectrum
- Examples: SIMP 0136 (the brightest T dwarf discovered in northern hemisphere)[44]
- Examples: Epsilon Indi Ba & Epsilon Indi Bb
Class T and L could be more common than all the other classes combined if recent research is accurate. From studying the number of proplyds (protoplanetary discs, clumps of gas in nebulae from which stars and solar systems are formed) then the number of stars in the galaxy should be several orders of magnitude higher than what we know about. It is theorized that these proplyds are in a race with each other. The first one to form will become a proto-star, which are very violent objects and will disrupt other proplyds in the vicinity, stripping them of their gas. The victim proplyds will then probably go on to become main sequence stars or brown dwarf stars of the L and T classes, but quite invisible to us. Since they live so long, these smaller stars will accumulate over time.
Class Y
See also: Sub-brown dwarf and Substellar object Artist's vision of a Y-dwarf
The spectral class Y has been proposed for brown dwarfs that are cooler than T dwarfs and have qualitatively different spectra from them. Although such dwarfs have been modelled,[45] there is no well-defined spectral sequence yet with prototypes, and six Y-class bodies have recently (As of August 26, 2011) been detected within 40 light years with the Wide-field Infrared Survey Explorer[46][47][48][49][50]
- Y: < 600 K, ultra-cool brown dwarfs (theoretical)
The coolest known brown dwarfs have estimated effective temperatures between 500 and 600 K, and have been assigned the spectral class T9. Three examples are the brown dwarfs CFBDS J005910.90-011401.3, ULAS J133553.45+113005.2, and ULAS J003402.77−005206.7.[51] The absolute coolest known brown dwarfs are CFBDSIR 1458+10 which has a surface temperature of 370±40K and WISE 1828+2650, which has a surface temperature of just 300 K (80 F, or 25 Celsius).[46][47][48][52] The spectra of these objects display absorption around 1.55 micrometers.[51] Delorme et al. has suggested that this feature is due to absorption from ammonia and that this should be taken as indicating the T-Y transition, making these objects of type Y0.[51][53] However, the feature is difficult to distinguish from absorption by water and methane,[51] and other authors have stated that the assignment of class Y0 is premature.[54]
Carbon-related stars are stars whose spectra indicate production of carbon by helium triple-alpha fusion. With increased carbon abundance, and some parallel s-process heavy element production, the spectra of these stars become increasingly deviant from the usual late spectral classes G, K and M. The giants among those stars are presumed to produce this carbon themselves, but not too few of this class of stars are believed to be double stars whose odd atmosphere once was transferred from a former carbon star companion that is now a white dwarf.
Class C: carbon stars
Main article: Carbon starOriginally classified as R and N stars, these are also known as 'carbon stars'. These are red giants, near the end of their lives, in which there is an excess of carbon in the atmosphere. The old R and N classes ran parallel to the normal classification system from roughly mid G to late M. These have more recently been remapped into a unified carbon classifier C, with N0 starting at roughly C6. Another subset of cool carbon stars are the J-type stars, which are characterized by the strong presence of molecules of 13CN in addition to those of 12CN.[55] A few dwarf (that is, main sequence) carbon stars are known, but the overwhelming majority of known carbon stars are giants or supergiants.
- C: Carbon stars, e.g. R CMi
- C-R: Formerly a class on its own representing the carbon star equivalent of late G to early K stars. Example: S Camelopardalis
- C-N: Formerly a class on its own representing the carbon star equivalent of late K to M stars. Example: R Leporis
- C-J: A subtype of cool C stars with a high content of 13C. Example: Y Canum Venaticorum
- C-H: Population II analogues of the C-R stars. Examples: V Ari, TT CVn[56]
- C-Hd: Hydrogen-Deficient Carbon Stars, similar to late G supergiants with CH and C2 bands added. Example: HD 137613
Class S
Main article: S-type starClass S stars have zirconium oxide lines in addition to (or, rarely, instead of) those of titanium oxide, and are in between the Class M stars and the carbon stars.[57] S stars have excess amounts of zirconium and other elements produced by the s-process, and have their carbon and oxygen abundances closer to equal than is the case for M stars. The latter condition results in both carbon and oxygen being locked up almost entirely in carbon monoxide molecules. For stars cool enough for carbon monoxide to form that molecule tends to "eat up" all of whichever element is less abundant, resulting in "leftover oxygen" (which becomes available to form titanium oxide) in stars of normal composition, "leftover carbon" (which becomes available to form the diatomic carbon molecules) in carbon stars, and "leftover nothing" in the S stars. The relation between these stars and the ordinary M stars indicates a continuum of carbon abundance. Like carbon stars, nearly all known S stars are giants or supergiants.
- Examples: S Ursae Majoris, HR 1105
In between the M class and the S class, border cases are named MS stars. In a similar way border cases between the S class and the C-N class are named SC or CS. The sequence M → MS → S → SC → C-N is believed to be a sequence of increased carbon abundance with age for carbon stars in the asymptotic giant branch.
- Examples: R Serpentis, ST Monocerotis (MS)
- Examples: CY Cygni, BH Crucis (SC)
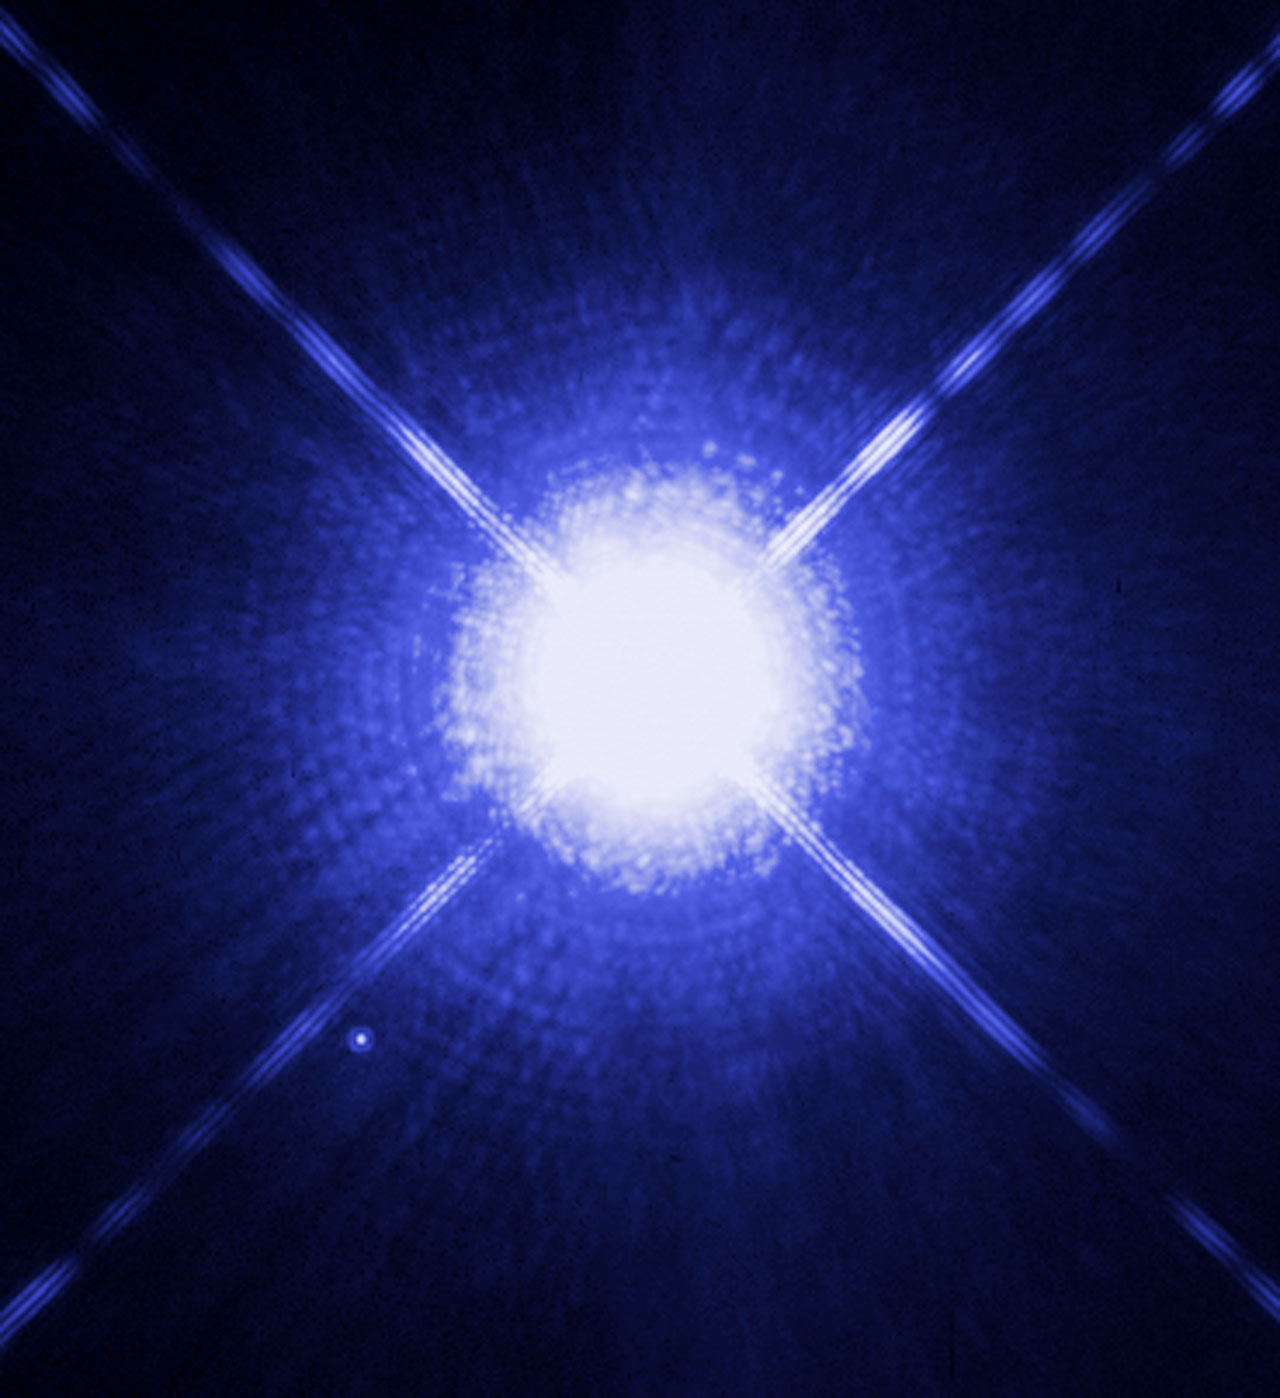
White dwarf classifications
Main article: White dwarf spectroscopy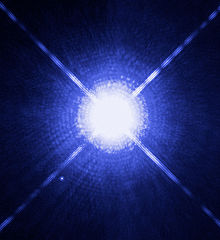
The class D (for Degenerate) is the modern classification used for white dwarfs - low-mass stars that are no longer undergoing nuclear fusion and have shrunk to planetary size, slowly cooling down. Class D is further divided into spectral types DA, DB, DC, DO, DQ, DX, and DZ. The letters are not related to the letters used in the classification of other stars, but instead indicate the composition of the white dwarf's visible outer layer or atmosphere.
- Examples: Sirius B (DA2), Procyon B (DA4), Van Maanen's star (DZ7)[58], Table 1
The white dwarf types are as follows:[59]
- DA: a hydrogen-rich atmosphere or outer layer, indicated by strong Balmer hydrogen spectral lines.
- DB: a helium-rich atmosphere, indicated by neutral helium, He I, spectral lines.
- DO: a helium-rich atmosphere, indicated by ionized helium, He II, spectral lines.
- DQ: a carbon-rich atmosphere, indicated by atomic or molecular carbon lines.
- DZ: a metal-rich atmosphere, indicated by metal spectral lines (a merger of the obsolete white dwarf spectral types, DG, DK and DM).
- DC: no strong spectral lines indicating one of the above categories.
- DX: spectral lines are insufficiently clear to classify into one of the above categories.
The type is followed by a number giving the white dwarf's surface temperature. This number is a rounded form of 50400/Teff, where Teff is the effective surface temperature, measured in kelvins. Originally, this number was rounded to one of the digits 1 through 9, but more recently fractional values have started to be used, as well as values below 1 and above 9.[59][60]
Two or more of the type letters may be used to indicate a white dwarf which displays more than one of the spectral features above. Also, the letter V is used to indicate a variable white dwarf.[59]
Extended white dwarf spectral types:[59]
- DAB: a hydrogen- and helium-rich white dwarf displaying neutral helium lines.
- DAO: a hydrogen- and helium-rich white dwarf displaying ionized helium lines.
- DAZ: a hydrogen-rich metallic white dwarf.
- DBZ: a helium-rich metallic white dwarf.
Variable star designations:
- DAV or ZZ Ceti: a hydrogen-rich pulsating white dwarf.[61], pp. 891, 895
- DBV or V777 Her: a helium-rich pulsating white dwarf.[62], p. 3525
- GW Vir, sometimes divided into DOV and PNNV: a hot helium-rich pulsating white dwarf (or pre-white dwarf.)[63], §1.1, 1.2;[64][65] These stars are generally PG 1159 stars, although some authors also include non-PG 1159 stars in this class.[63][66]
Non-stellar spectral types: Class P & Q
Finally, the classes P and Q are occasionally used for certain non-stellar objects. Type P objects are planetary nebulae and type Q objects are novae.
Spectral peculiarities
Additional nomenclature, in the form of lower-case letters, can follow the spectral type to indicate peculiar features of the spectrum.[67]
Code Spectral peculiarities for stars : Blending and/or uncertain spectral value ... Undescribed spectral peculiarities exist ! Special peculiarity comp Composite spectrum e Emission lines present [e] "Forbidden" emission lines present er "Reversed" center of emission lines weaker than edges ep Emission lines with peculiarity eq Emission lines with P Cygni profile ev Spectral emission that exhibits variability f N III and He II emission (for element name followed by roman numeral see spectral line) f* NIV λ4058Å is stronger than the NIII λ4634Å, λ4640Å, & λ4642Å lines[68] f+ SiIV λ4089Å & λ4116Å are emission in addition to the NIII line[68] (f) Weak emission lines of He ((f)) Displays strong HeII absorption accompanied by weak NIII emissions[69] h WR stars with emission lines due to hydrogen.[38] ha WR stars with hydrogen emissions seen on both absorption and emission.[38] He wk Weak He lines k Spectra with interstellar absorption features m Enhanced metal features n Broad ("nebulous") absorption due to spinning nn Very broad absorption features due to spinning very fast neb A nebula's spectrum mixed in p Unspecified peculiarity, peculiar star. pq Peculiar spectrum, similar to the spectra of novae q Red & blue shifts line present s Narrowly "sharp" absorption lines ss Very narrow lines sh Shell star features v Variable spectral feature (also "var") w Weak lines (also "wl" & "wk") d Del Type A and F giants with weak calcium H and K lines, as in prototype Delta Delphini d Sct Type A and F stars with spectra similar to that of short-period variable Delta Scuti Code If spectrum shows enhanced metal features Ba Abnormally strong Barium Ca Abnormally strong Calcium Cr Abnormally strong Chromium Eu Abnormally strong Europium He Abnormally strong Helium Hg Abnormally strong Mercury Mn Abnormally strong Manganese Si Abnormally strong Silicon Sr Abnormally strong Strontium Tc Abnormally strong Technetium Code Spectral peculiarities for white dwarfs : Uncertain assigned classification P Magnetic white dwarf with detectable polarization E Emission lines present H Magnetic white dwarf without detectable polarization V Variable PEC Spectral peculiarities exist For example, Epsilon Ursae Majoris is listed as spectral type A0pCr, indicating general classification A0 with strong emission lines of the element chromium. There are several common classes of chemically peculiar stars, where the spectral lines of a number of elements appear abnormally strong.
Photometric classification
Stars can also be classified using photometric data from any photometric system. For example, we can calibrate color index diagrams of U−B and B−V in the UBV system according to spectral and luminosity classes. Nevertheless, this calibration is not straightforward, because many effects are superimposed in such diagrams: interstellar reddening, color changes due to metallicity, and the blending of light from binary and multiple stars.
Photometric systems with more colors and narrower passbands allow a star's class, and hence physical parameters, to be determined more precisely. The most accurate determination comes of course from spectral measurements, but there is not always enough time to get qualitative spectra with high signal-to-noise ratio.
See also
- Astrograph
- Hertzsprung–Russell diagram
- Metallicity
- Stellar associations
- Stellar evolution
- Star count, survey of stars
Notes
- ^ a b c d e f g These proportions are fractions of stars brighter than absolute magnitude 16; lowering this limit will render earlier types even rarer while generally adding only to the M class.
- ^ This rises to 78.6% if we include all stars. (See the above note.)
References
- ^ Analyse spectrale de la lumière de quelques étoiles, et nouvelles observations sur les taches solaires, P. Secchi, Comptes Rendus des Séances de l'Académie des Sciences 63 (July–December 1866), pp. 364–368.
- ^ Nouvelles recherches sur l'analyse spectrale de la lumière des étoiles, P. Secchi, Comptes Rendus des Séances de l'Académie des Sciences 63 (July–December 1866), pp. 621–628.
- ^ pp. 60, 134, The Analysis of Starlight: One Hundred and Fifty Years of Astronomical Spectroscopy, J. B. Hearnshaw, Cambridge, UK: Cambridge University Press, 1986, ISBN 0-521-25548-1.
- ^ pp. 62–63, Hearnshaw 1986.
- ^ p. 60, Hearnshaw 1986.
- ^ Classification of Stellar Spectra: Some History
- ^ pp. 62–63, Stars and Their Spectra: An Introduction to the Spectral Sequence, James B. Kaler, Cambridge: Cambridge University Press, 1997, ISBN 0521585708.
- ^ a b c d Tables VII, VIII, Empirical bolometric corrections for the main-sequence, G. M. H. J. Habets and J. R. W. Heinze, Astronomy and Astrophysics Supplement Series 46 (November 1981), pp. 193–237, Bibcode: 1981A&AS...46..193H. Luminosities are derived from Mbol figures, using Mbol(☉)=4.75.
- ^ a b The Guinness book of astronomy facts & feats, Patrick Moore, 1992, 0-900424-76-1
- ^ "The Colour of Stars". Australia Telescope Outreach and Education. 2004-12-21. http://outreach.atnf.csiro.au/education/senior/astrophysics/photometry_colour.html. Retrieved 2007-09-26. — Explains the reason for the difference in color perception.
- ^ What color are the stars?, Mitchell Charity. Accessed online March 19, 2008.
- ^ a b c d e f g h LeDrew, G.; The Real Starry Sky, Journal of the Royal Astronomical Society of Canada, Vol. 95, No. 1 (whole No. 686, February 2001), pp. 32–33. Note: Table 2 has an error and so this article will use 824 as the assumed correct total of main-sequence stars
- ^ a b The Draper Catalogue of stellar spectra photographed with the 8-inch Bache telescope as a part of the Henry Draper memorial, Edward C. Pickering, Annals of Harvard College Observatory 27 (1890), Bibcode: 1890AnHar..27....1P. See in particular pp. 1–4.
- ^ a b pp. 106–108, Hearnshaw 1986.
- ^ p. 60–63, Hearnshaw 1986; pp. 623–625, Secchi 1866.
- ^ pp. 111–112, Hearnshaw 1986.
- ^ Spectra of bright stars photographed with the 11-inch Draper Telescope as part of the Henry Draper Memorial, Antonia C. Maury and Edward C. Pickering, Annals of Harvard College Observatory 28, part 1 (1897), pp. 1–128, Bibcode: 1897AnHar..28....1M; see in particular Table I.
- ^ Spectra of bright southern stars photographed with the 13-inch Boyden telescope as part of the Henry Draper Memorial, Annie J. Cannon and Edward C. Pickering, Annals of Harvard College Observatory 28, part 2 (1901), pp. 129–263, Bibcode: 1901AnHar..28..129C; see in particular pp. 139–143.
- ^ pp. 117–119, Hearnshaw 1986.
- ^ Classification of 1,688 southern stars by means of their spectra, Annie Jump Cannon and Edward C. Pickering, Annals of Harvard College Observatory 56, #5 (1912), pp. 115–164, Bibcode: 1912AnHar..56..115C.
- ^ pp. 121–122, Hearnshaw 1986.
- ^ Saha, M. N.; On a Physical Theory of Stellar Spectra, Proceedings of the Royal Society of London, Series A, Volume 99, Issue 697 (May 1921), pp. 135–153
- ^ Payne, C. H.; Stellar Atmospheres; A Contribution to the Observational Study of High Temperature in the Reversing Layers of Stars, Ph. D. Thesis, Radcliffe College, 1925
- ^ Charity, Mitchell. "What color are the stars?". http://www.vendian.org/mncharity/dir3/starcolor/. Retrieved 2006-05-13.
- ^ Morgan, William Wilson; Keenan, Philip Childs; Kellman, Edith (1943), "An atlas of stellar spectra, with an outline of spectral classification", Chicago, Ill., The University of Chicago press
- ^ Phillip C. Keenan, William Wilson Morgan; Keenan, P C (1973). "Spectral Classification". Annual Reviews of Astronomy and Astrophysics (Annual Reviews) 11 (1): 29–50. Bibcode 1973ARA&A..11...29M. doi:10.1146/annurev.aa.11.090173.000333.
- ^ A Low-Dispersion Luminosity Indicator for Solar-Type Dwarfs, Barry, Don C. 1970
- ^ a b c d Multiwavelength Systematics of OB Spectra, Walborn, N. R., 2008
- ^ Planets Prefer Safe Neighborhoods
- ^ An atlas of stellar spectra, with an outline of spectral classification, W. W. Morgan, P. C. Keenan and E. Kellman, Chicago: The University of Chicago Press, 1943.
- ^ Revised MK Spectral Atlas for Stars Earlier than the Sun, W. W. Morgan, H. A. Abt, and J. W. Tapscott, Yerkes Observatory, University of Chicago and Kitt Peak National Observatory, 1978.
- ^ A New Spectral Classification System for the Earliest O Stars: Definition of Type O2, Nolan R. Walborn et al., The Astronomical Journal 123, #5 (May 2002), pp. 2754–2771, doi:10.1086/339831, Bibcode: 2002AJ....123.2754W.
- ^ "SIMBAD Object query : CCDM J02319+8915". Centre de Données astronomiques de Strasbourg. http://simbad.u-strasbg.fr/simbad/sim-id?Ident=CCDM+J02319%2B8915&NbIdent=1&Radius=2&Radius.unit=arcmin&submit=submit+id. Retrieved 2010-06-10.
- ^ Checking the yellow evolutionary void. Three evolutionary critical Hypergiants: HD 33579, HR 8752 & IRC +10420
- ^ http://spacefellowship.com/2009/08/10/on-a-cosmological-timescale-the-earths-period-of-habitability-is-nearly-over/
- ^ Optical Spectroscopy of 2MASS Color-Selected Ultracool Subdwarfs, Adam J. Burgasser et al., 2006
- ^ Astrometric and Spectroscopic Confirmation of a Brown Dwarf Companion to GSC 08047-00232, G. Chauvin et al., 2004
- ^ a b c d e f g Physical Properties of Wolf-Rayet Stars, Crowther, Paul A., 2007
- ^ Outstanding Issues in Our Understanding of L, T, and Y Dwarfs, J. D. Kirkpatrick, April 2007, arXiv:0704.1522. Accessed on line September 18, 2007.
- ^ a b Kirkpatrick et al., J. Davy; Reid, I. Neill; Liebert, James; Cutri, Roc M.; Nelson, Brant; Beichman, Charles A.; Dahn, Conard C.; Monet, David G. et al. (July 10, 1999). "Dwarfs Cooler than M: the Definition of Spectral Type L Using Discovery from the 2-µ ALL-SKY Survey (2MASS)". The Astrophysical Journal (The University of Chicago Press) 519 (2): 802–833. Bibcode 1999ApJ...519..802K. doi:10.1086/307414. http://www.journals.uchicago.edu/doi/full/10.1086/307414.
- ^ a b Kirkpatrick, J. Davy (2005). "New Spectral Types L and T". Annual Reviews of Astronomy and Astrophysics (Annual Reviews) 43 (1): 195–246. Bibcode 2005ARA&A..43..195K. doi:10.1146/annurev.astro.42.053102.134017.
- ^ Ultra-cool Diminutive Star Weighs In
- ^ LSR 1610-0040: The First Early-Type L Subdwarf, Lépine et al. 2003c
- ^ Discovery of the brightest T dwarf in the northern hemisphere, 2007
- ^ Y-Spectral class for Ultra-Cool Dwarfs, N.R.Deacon and N.C.Hambly, 2006
- ^ a b Stars as Cool as the Human Body
- ^ a b http://ca.news.yahoo.com/blogs/technology-blog/nasa-spots-chilled-stars-cooler-human-body-004551421.html
- ^ a b NASA spots chilled-out stars cooler than the human body
- ^ NASA'S Wise Mission Discovers Coolest Class of Stars
- ^ The minimum Jeans mass, brown dwarf companion IMF, and predictions for detection of Y-type dwarfs, B. Zuckerman and I. Song, Astronomy and Astrophysics 493, #3 (January 2009), pp. 1149–1154, doi:10.1051/0004-6361:200810038, Bibcode: 2009A&A...493.1149Z.
- ^ a b c d The Physical Properties of Four ~600 K T Dwarfs, S. K. Leggett et al., The Astrophysical Journal 695, #2 (April 2009), pp. 1517–1526, doi:10.1088/0004-637X/695/2/1517, Bibcode: 2009ApJ...695.1517L.
- ^ European Southern Observatory. "A Very Cool Pair of Brown Dwarfs", 23 March 2011
- ^ CFBDS J005910.90-011401.3: reaching the T-Y brown dwarf transition?, P. Delorme et al., Astronomy and Astrophysics 482, #3 (May 2008), pp. 961–971, doi:10.1051/0004-6361:20079317, Bibcode: 2008A&A...482..961D.
- ^ Exploring the substellar temperature regime down to ~550K, Ben Burningham et al., Monthly Notices of the Royal Astronomical Society 391, #1 (November 2008), pp. 320–333, doi:10.1111/j.1365-2966.2008.13885.x, Bibcode: 2008MNRAS.391..320B; see the abstract.
- ^ Bouigue, R. 1954, Annales d'Astrophysique, Vol. 17, p.104
- ^ Spectral Atlas of Carbon Stars (Barnbaum+ 1996)
- ^ Keenan, P. C. 1954 Astrophysical Journal, vol. 120, p.484
- ^ A Determination of the Local Density of White Dwarf Stars, J. B. Holberg, Terry D. Oswalt and E. M. Sion, The Astrophysical Journal 571, #1 (May 2002), pp. 512–518.
- ^ a b c d A proposed new white dwarf spectral classification system, E. M. Sion, J. L. Greenstein, J. D. Landstreet, J. Liebert, H. L. Shipman, and G. A. Wegner, The Astrophysical Journal 269, #1 (June 1, 1983), pp. 253–257.
- ^ A Catalog of Spectroscopically Identified White Dwarfs, George P. McCook and Edward M. Sion, The Astrophysical Journal Supplement Series 121, #1 (March 1999), pp. 1–130.
- ^ Physics of white dwarf stars, D. Koester and G. Chanmugam, Reports on Progress in Physics 53 (1990), pp. 837–915.
- ^ White dwarfs, Gilles Fontaine and François Wesemael, in Encyclopedia of Astronomy and Astrophysics, ed. Paul Murdin, Bristol and Philadelphia: Institute of Physics Publishing and London, New York and Tokyo: Nature Publishing Group, 2001. ISBN 0333750888.
- ^ a b Mapping the Instability Domains of GW Vir Stars in the Effective Temperature-Surface Gravity Diagram, Quirion, P.-O., Fontaine, G., Brassard, P., Astrophysical Journal Supplement Series 171 (2007), pp. 219–248.
- ^ §1, Detection of non-radial g-mode pulsations in the newly discovered PG 1159 star HE 1429–1209, T. Nagel and K. Werner, Astronomy and Astrophysics 426 (2004), pp. L45–L48.
- ^ The Extent and Cause of the Pre-White Dwarf Instability Strip, M. S. O'Brien, Astrophysical Journal 532, #2 (April 2000), pp. 1078–1088.
- ^ UV spectroscopy of the hybrid PG 1159-type central stars of the planetary nebulae NGC 7094 and Abell 43, Ziegler, M. et al. 2009
- ^ SkyTonight: The Spectral Types of Stars
- ^ a b Pismis 24-1: The Stellar Upper Mass Limit Preserved, J. Maíz Apellániz et al. 2006
- ^ Early-type stars in the core of the young open cluster Westerlund2, G.Rauw et al. 2006
External links
- Libraries of stellar spectra, D. Montes, UCM
- Webfooted Astronomer
- The rate of period change in pulsating DB white dwarf stars, A. H. Corsico, L. G. Althaus, has the DAV, DBV, & DOV explanation.
- The Close DAO+dM Binary RE J0720-318: A Stratified White Dwarf with a Thin H Layer and a Possible Circumbinary Disk DAO type White Dwarf.
- The Spatial Distribution and Kinematics of Cool Metallic Line White Dwarfs, has DAZ and DBZ spectrums
- A K-Band Spectral Atlas of Wolf-Rayet Stars, has WC, WN, and WO spectrums
- Properties of the WO Wolf-Rayet stars, has WO spectrum ranging from WO1 to WO5
- Spectral Types for Hipparcos Catalogue Entries
- [1], has the luminous subclasses.
- Discovery of a Very Young Field L Dwarf, 2MASS J01415823-4633574, J. Davy Kirkpatrick et al.
- Stellar Spectral Classification, Richard O. Gray and Christopher J. Corbally
Categories:- Stars
- Stars by spectral type
- Stars by luminosity class
- Hertzsprung-Russell classifications
- Classification systems
- Stellar astronomy
- Star types
- Class I: white and blue stars with broad heavy hydrogen lines, such as Vega and Altair. This includes the modern class A and early class F.


Wikimedia Foundation. 2010.