- Hertzsprung–Russell diagram
-
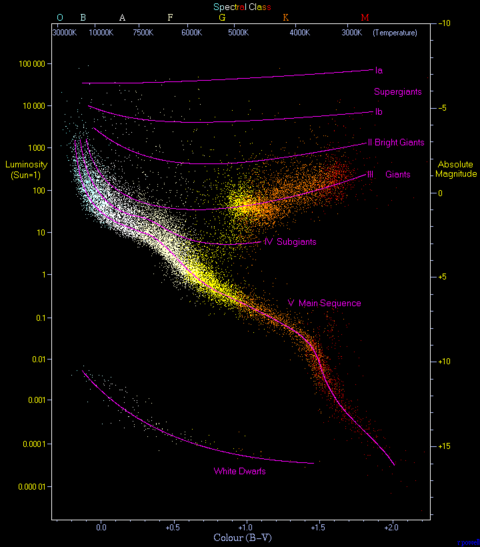 Hertzsprung–Russell diagram[1] with 22,000 stars plotted from the Hipparcos catalog and 1,000 from the Gliese catalog of nearby stars. Stars tend to fall only into certain regions of the diagram. The most predominant is the diagonal, going from the upper-left (hot and bright) to the lower-right (cooler and less bright), called the main sequence. In the lower-left is where white dwarfs are found, and above the main sequence are the subgiants, giants and supergiants. The Sun is found on the main sequence at luminosity 1 (absolute magnitude 4.8) and B-V color index 0.66 (temperature 5780K, spectral type G2).
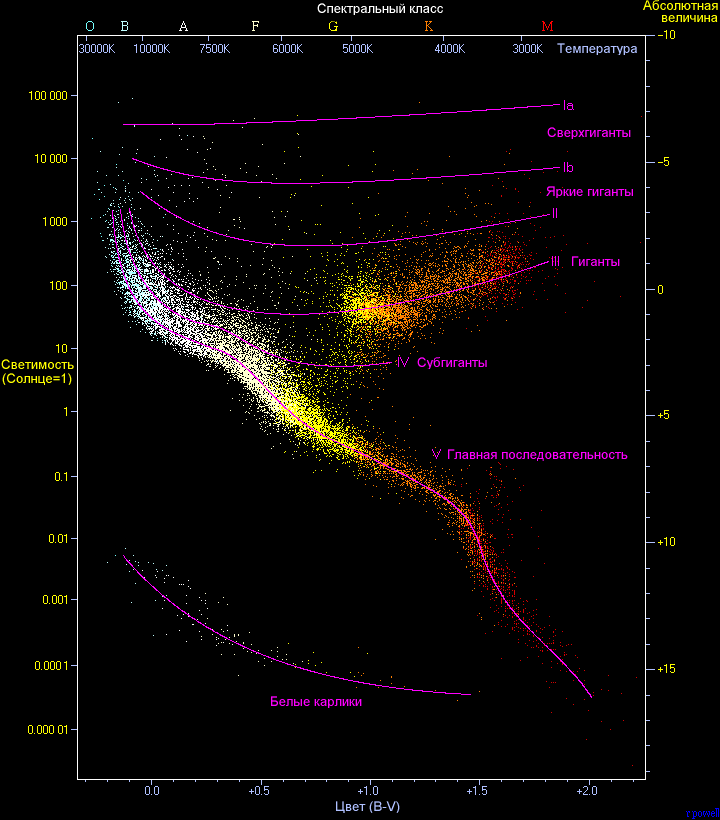
 HR diagrams for two open clusters, M67 and NGC 188, showing the main sequence turn-off at different ages.
The Hertzsprung–Russell diagram is a scatter graph of stars showing the relationship between the stars' absolute magnitudes or luminosities versus their spectral types or classifications and effective temperatures. Hertzsprung–Russell diagrams are not pictures or maps of the locations of the stars. Rather, they plot each star on a graph measuring the star's absolute magnitude or brightness against its temperature and color.
Hertzsprung–Russell diagrams are also referred to by the abbreviation H–R diagram or HRD. The diagram was created circa 1910 by Ejnar Hertzsprung and Henry Norris Russell and represents a major step towards an understanding of stellar evolution or "the lives of stars".
Contents
Forms of diagram
There are several forms of the Hertzsprung–Russell diagram, and the nomenclature is not very well defined. The original diagram displayed the spectral type of stars on the horizontal axis and the absolute magnitude on the vertical axis. The first quantity (i.e. spectral type) is difficult to plot as it is not a numerical quantity and in modern versions of the chart it is replaced by the B-V color index of the stars. This type of diagram is what is often called a Hertzsprung–Russell diagram, or specifically a color-magnitude diagram (CMD), and it is often used by observers. In cases where the stars are known to be at identical distances such as with a star cluster, a color-magnitude diagram is often used to describe a plot of the stars in the cluster in which the vertical axis is the apparent magnitude.
Another form of the diagram plots the effective surface temperature of the star on one axis and the luminosity of the star on the other. This is what theoreticians calculate using computer models that describe the evolution of stars.[citation needed] This type of diagram should probably be called temperature-luminosity diagram, but this term is hardly ever used, the term Hertzsprung–Russell diagram being preferred instead. One peculiar characteristic of this form of the H–R diagram is that the temperatures are plotted from high temperature to low temperature, which aids in comparing this form of the H–R diagram with the observational form.
Although the two types of diagrams are similar, astronomers make a sharp distinction between the two. The reason for this distinction is that the exact transformation from one to the other is not trivial, and depends on the stellar-atmosphere model being used and its parameters (like composition and pressure, apart from temperature and luminosity). Also, one needs to know the distance to the observed objects and the degree of interstellar reddening.[citation needed] Empirical transformations between various color indices and effective temperature are available in literature.[2]
The H–R diagram can be used to define different types of stars and to match theoretical predictions of stellar evolution using computer models with observations of actual stars. It is then necessary to convert either the calculated quantities to observables, or the other way around, thus introducing an extra uncertainty.[citation needed]
Interpretation
Most of the stars occupy the region in the diagram along the line called the main sequence. During that stage stars are fusing hydrogen in their cores. The next concentration of stars is on the horizontal branch (helium fusion in the core and hydrogen burning in a shell surrounding the core). Another prominent feature is the Hertzsprung gap located in the region between A5 and G0 spectral type and between +1 and −3 absolute magnitudes (i.e. between the top of the main sequence and the giants in the horizontal branch). RR Lyrae variable stars can be found in the left of this gap. Cepheid variables reside in the upper section of the instability strip.
The H-R diagram can also be used by scientists to roughly measure how far away a star cluster is from Earth. This can be done by comparing the apparent magnitudes of the stars in the cluster to the absolute magnitudes of stars with known distances (or of model stars). The observed group is then shifted in the vertical direction, until the two main sequences overlap. The difference in magnitude that was bridged in order to match the two groups is called the distance modulus and is a direct measure for the distance. This technique is known as main-sequence fitting or spectroscopic parallax.
The diagram's role in the development of stellar physics
Contemplation of the diagram led astronomers to speculate that it might demonstrate stellar evolution, the main suggestion being that stars collapsed from red giants to dwarf stars, then moving down along the line of the main sequence in the course of their lifetimes. Stars were thought therefore to radiate energy by converting gravitational energy into radiation through the Kelvin–Helmholtz mechanism. This mechanism resulted in an age for the sun of only tens of millions of years, creating a conflict over the age of the solar system between astronomers, and biologists and geologists who had evidence that the earth was far older than that. This conflict was only resolved in the 1930s when nuclear fusion was identified as the source of stellar energy.
However, following Russell's presentation of the diagram to a meeting of the Royal Astronomical Society in 1912, Arthur Eddington was inspired to use it as a basis for developing ideas on stellar physics.[3] In 1926, in his book The Internal Constitution of the Stars he explained the physics of how stars fit on the diagram. This was a particularly remarkable development since at that time the major problem of stellar theory, the source of a star's energy, was still unsolved. Thermonuclear energy, and even that stars are largely composed of hydrogen (see metallicity), had yet to be discovered. Eddington managed to sidestep this problem by concentrating on the thermodynamics of radiative transport of energy in stellar interiors.[4] So, Eddington predicted that dwarf stars remain in an essentially static position on the main sequence for most of their lives. In the 1930s and 1940s, with an understanding of hydrogen fusion, came a physically based theory of evolution to red giants, and white dwarfs. By this time, study of the Hertzsprung–Russell diagram did not drive such developments but merely allowed stellar evolution to be presented graphically.[citation needed]
See also
- Asymptotic Giant Branch
- Galaxy color-magnitude diagram
- Hayashi track
- Henyey track
- Hess diagram
- Red clump
- Stellar birthline
- Stellar classification
- Tip of the red giant branch
- Color–color diagram
References
Notes
- ^ Richard Powell with permission.
- ^ For example, Sekiguchi, 2000; Casagrande, 2006.
- ^ Porter, 2003.
- ^ Smith, 1995.
- [1][2] The first person to publish an H-R diagram was Hans Rosenberg (1879–1940) at Göttingen in June, 1910.
Bibliography
- Casagrande, L.; Portinari, L., and Flynn, C. (November 2006). "Accurate fundamental parameters for lower main-sequence stars" (Abstract). MNRAS 373 (1): 13–44. arXiv:astro-ph/0608504. Bibcode 2006astro.ph..8504C. doi:10.1111/j.1365-2966.2006.10999.x.
- Porter, Roy (2003). The Cambridge History of Science. Cambridge, UK: Cambridge University Press. pp. 518. ISBN 978-0521572439.
- Sekiguchi, Maki; Fukugita, Masataka (August 2000). "A Study of the B-V Color-Temperature Relation". The Astronomical Journal 120 (2): 1072–1084. arXiv:astro-ph/9904299. Bibcode 2000AJ....120.1072S. doi:10.1086/301490. http://www.iop.org/EJ/article/1538-3881/120/2/1072/990160.html. Retrieved 2008-09-14.
- Smith, Robert (1995). Observational Astrophysics. Cambridge, UK: Cambridge University Press. pp. 236. ISBN 978-0521278348.
External links
- JavaHRD an interactive Hertzsprung–Russell diagram as a Java applet
- BaSTI a Bag of Stellar Tracks and Isochrones, simulations with FRANEC code by Teramo Astronomical Observatory
- Leos Ondra: The first Hertzsprung-Russell diagram
Categories:- Hertzsprung-Russell classifications
- Stellar evolution
- Diagrams

Wikimedia Foundation. 2010.