- Main sequence
-
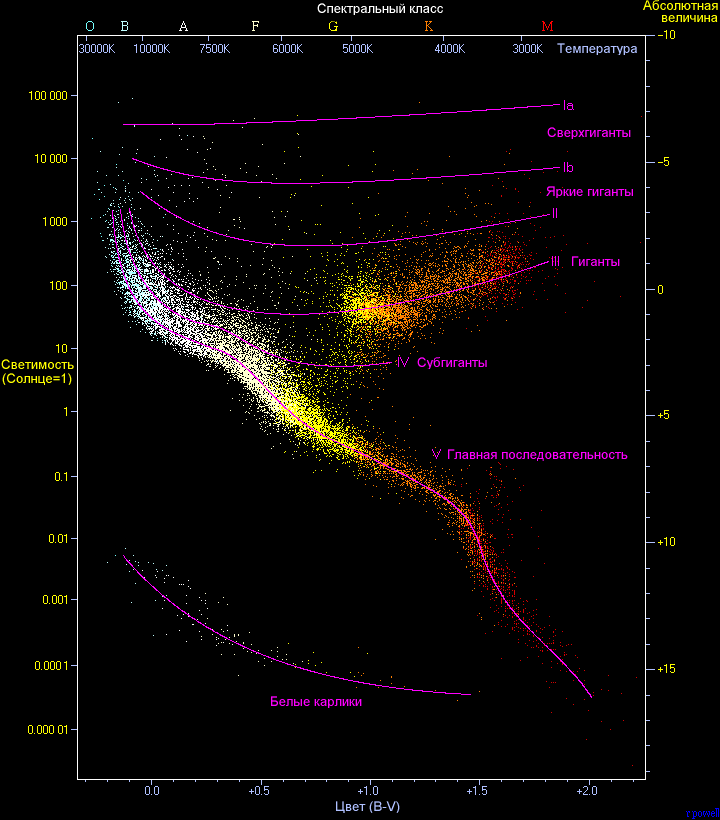
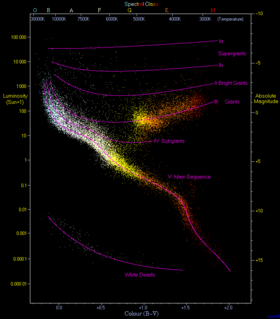 A Hertzsprung-Russell diagram plots the actual brightness (or absolute magnitude) of a star against its color index (represented as B-V). The main sequence is visible as a prominent diagonal band that runs from the upper left to the lower right. This plot shows 22,000 stars from the Hipparcos Catalogue together with 1,000 low-luminosity stars (red and white dwarfs) from the Gliese Catalogue of Nearby Stars.
The main sequence is a continuous and distinctive band of stars that appears on plots of stellar color versus brightness. These color-magnitude plots are known as Hertzsprung–Russell diagrams after their co-developers, Ejnar Hertzsprung and Henry Norris Russell. Stars on this band are known as main-sequence stars or "dwarf" stars.[1][2]
After a star has formed, it creates energy at the hot, dense core region through the nuclear fusion of hydrogen atoms into helium. During this stage of the star's lifetime, it is located along the main sequence at a position determined primarily by its mass, but also based upon its chemical composition and other factors. All main-sequence stars are in hydrostatic equilibrium, where outward thermal pressure from the hot core is balanced by the inward gravitational pressure from the overlying layers. The strong dependence of the rate of energy generation in the core on the temperature and pressure helps to sustain this balance. Energy generated at the core makes its way to the surface and is radiated away at the photosphere. The energy is carried by either radiation or convection, with the latter occurring in regions with steeper temperature gradients, higher opacity or both.
The main sequence is sometimes divided into upper and lower parts, based on the dominant process that a star uses to generate energy. Stars below about 1.5 times the mass of the Sun (or 1.5 solar masses) primarily fuse hydrogen atoms together in a series of stages to form helium, a sequence called the proton-proton chain. Above this mass, in the upper main sequence, the nuclear fusion process mainly uses atoms of carbon, nitrogen and oxygen as intermediaries in the CNO cycle that produces helium from hydrogen atoms. Main-sequence stars with more than ten solar masses undergo convection in the core region, which acts to stir up the newly created helium and maintain the proportion of fuel needed for fusion to occur. When core convection does not occur, a helium-rich core develops surrounded by an outer layer of hydrogen. For stars with lower masses, this convective core is progressively smaller until it disappears at about 2 solar masses. Below this mass, stars have cores that are radiative but are convective near the surface. With decreasing stellar mass the convective envelope increases, and main-sequence stars below 0.4 solar masses undergo convection throughout their mass.
In general, the more massive the star the shorter its lifespan on the main sequence. After the hydrogen fuel at the core has been consumed, the star evolves away from the main sequence on the HR diagram. The behavior of a star now depends on its mass, with stars below 0.23 solar masses becoming white dwarfs directly, while stars with up to ten solar masses pass through a red giant stage.[3] More massive stars can explode as a supernova,[4] or collapse directly into a black hole.
Contents
History
In the early part of the 20th century, information about the types and distances of stars became more readily available. The spectra of stars were shown to have distinctive features, which allowed them to be categorized. Annie Jump Cannon and Edward C. Pickering at Harvard College Observatory developed a method of categorization that became known as the Harvard Classification Scheme, published in the Harvard Annals in 1901.[5]
In Potsdam in 1906, the Danish astronomer Ejnar Hertzsprung noticed that the reddest stars—classified as K and M in the Harvard scheme—could be divided into two distinct groups. These stars are either much brighter than the Sun, or much fainter. To distinguish these groups, he called them "giant" and "dwarf" stars. The following year he began studying star clusters; large groupings of stars that are co-located at approximately the same distance. He published the first plots of color versus luminosity for these stars. These plots showed a prominent and continuous sequence of stars, which he named the Main Sequence.[6]
At Princeton University, Henry Norris Russell was following a similar course of research. He was studying the relationship between the spectral classification of stars and their actual brightness as corrected for distance—their absolute magnitude. For this purpose he used a set of stars that had reliable parallaxes and many of which had been categorized at Harvard. When he plotted the spectral types of these stars against their absolute magnitude, he found that dwarf stars followed a distinct relationship. This allowed the real brightness of a dwarf star to be predicted with reasonable accuracy.[7]
Of the red stars observed by Hertzsprung, the dwarf stars also followed the spectra-luminosity relationship discovered by Russell. However, the giant stars are much brighter than dwarfs and so, do not follow the same relationship. Russell proposed that the "giant stars must have low density or great surface-brightness, and the reverse is true of dwarf stars". The same curve also showed that there were very few faint white stars.[7]
In 1933, Bengt Strömgren introduced the term Hertzsprung-Russell diagram to denote a luminosity-spectral class diagram.[8] This name reflected the parallel development of this technique by both Hertzsprung and Russell earlier in the century.[6]
As evolutionary models of stars were developed during the 1930s, it was shown that, for stars of a uniform chemical composition, a relationship exists between a star's mass and its luminosity and radius. That is, for a given mass and composition, there is a unique solution for determining the star's radius and luminosity. This became known as the Vogt-Russell theorem; named after Heinrich Vogt and Henry Norris Russell. By this theorem, once a star's chemical composition and its position on the main sequence is known, so too is the star's mass and radius. (However, it was subsequently discovered that the theorem breaks down somewhat for stars of non-uniform composition.)[9]
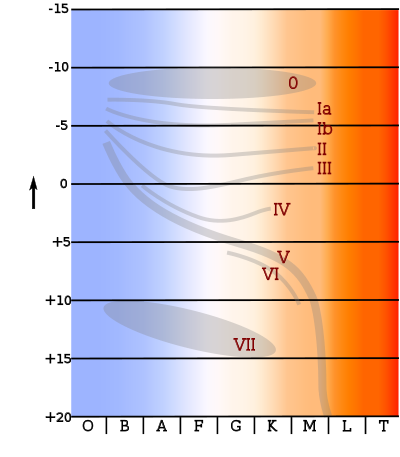
A refined scheme for stellar classification was published in 1943 by W. W. Morgan and P. C. Keenan.[10] The MK classification assigned each star a spectral type—based on the Harvard classification—and a luminosity class. The Harvard classification had been developed by assigning a different letter to each star based on the strength of the hydrogen spectra line, before the relationship between spectra and temperature was known. When ordered by temperature and when duplicate classes were removed, the spectral types of stars followed, in order of decreasing temperature with colors ranging from blue to red, the sequence O, B, A, F, G, K and M. (A popular mnemonic for memorizing this sequence of stellar classes is "Oh Be A Fine Girl/Guy, Kiss Me".) The luminosity class ranged from I to V, in order of decreasing luminosity. Stars of luminosity class V belonged to the main sequence.[11]
Formation
Main article: Star formationWhen a protostar is formed from the collapse of a giant molecular cloud of gas and dust in the local interstellar medium, the initial composition is homogeneous throughout, consisting of about 70% hydrogen, 28% helium and trace amounts of other elements, by mass.[12] The initial mass of the star depends on the local conditions within the cloud. (The mass distribution of newly formed stars is described empirically by the initial mass function.)[13] During the initial collapse, this pre-main-sequence star generates energy through gravitational contraction. Upon reaching a suitable density, energy generation is begun at the core using an exothermic nuclear fusion process that converts hydrogen into helium.[11]
 Main sequence
("dwarfs")Once nuclear fusion of hydrogen becomes the dominant energy production process and the excess energy gained from gravitational contraction has been lost,[14] the star lies along a curve on the Hertzsprung-Russell diagram (or HR diagram) called the standard main sequence. Astronomers will sometimes refer to this stage as "zero age main sequence", or ZAMS.[15] The ZAMS curve can be calculated using computer models of stellar properties at the point when stars begin hydrogen fusion. From this point, the brightness and surface temperature of stars typically increase with age.[16]
A star remains near its initial position on the main sequence until a significant amount of hydrogen in the core has been consumed, then begins to evolve into a more luminous star. (On the HR diagram, the evolving star moves up and to the right of the main sequence.) Thus the main sequence represents the primary hydrogen-burning stage of a star's lifetime.[11]
Properties
The majority of stars on a typical HR diagram lie along the main sequence curve. This line is pronounced because both the spectral type and the luminosity depend only on a star's mass, at least to zeroth order approximation, as long as it is fusing hydrogen at its core—and that is what almost all stars spend most of their "active" lives doing.[17]
The temperature of a star determines its spectral type via its effect on the physical properties of plasma in its photosphere. A star's energy emission as a function of wavelength is influenced by both its temperature and composition. A key indicator of this energy distribution is given by the color index, B − V, which measures the star's magnitude in blue (B) and green-yellow (V) light by means of filters.[note 1] This difference in magnitude provides a measure of a star's temperature.
Dwarf terminology
Main-sequence stars are called dwarf stars, but this terminology is partly historical and can be somewhat confusing. For the cooler stars, dwarfs such as red dwarfs, orange dwarfs, and yellow dwarfs are indeed much smaller and dimmer than other stars of those colors. However, for hotter blue and white stars, the size and brightness difference between so-called dwarf stars that are on the main sequence and the so-called giant stars that are not becomes smaller; for the hottest stars it is not directly observable. For those stars the terms dwarf and giant refer to differences in spectral lines which indicate if a star is on the main sequence or off it. Nevertheless, very hot main-sequence stars are still sometimes called dwarfs, even though they have roughly the same size and brightness as the "giant" stars of that temperature.[18]
The common use of dwarf to mean main sequence is confusing in another way, because there are dwarf stars which are not main-sequence stars. For example, white dwarfs are a different kind of star that is much smaller than main-sequence stars—being roughly the size of the Earth. These represent the final evolutionary stage of many main-sequence stars.[19]
Parameters
By treating the star as an idealized energy radiator known as a black body, the luminosity L and radius R can be related to the effective temperature Teff by the Stefan–Boltzmann law:
- L = 4πσR2Teff4
where σ is the Stefan–Boltzmann constant. As the position of a star on the HR diagram shows its approximate luminosity, this relation can be used to estimate its radius.[20]
The mass, radius and luminosity of a star are closely interlinked, and their respective values can be approximated by three relations. First is the Stefan–Boltzmann law, which relates the luminosity L, the radius R and the surface temperature Teff. Second is the mass–luminosity relation, which relates the luminosity L and the mass M. Finally, the relationship between M and R is close to linear. The ratio of M to R increases by a factor of only three over 2.5 orders of magnitude of M. This relation is roughly proportional to the star's inner temperature TI, and its extremely slow increase reflects the fact that the rate of energy generation in the core strongly depends on this temperature, while it has to fit the mass–luminosity relation. Thus, a too high or too low temperature will result in stellar instability.
A better approximation is to take
 , the energy generation rate per unit mass, as ε is proportional to TI15, where TI is the core temperature. This is suitable for stars at least as massive as the Sun, exhibiting the CNO cycle, and gives the better fit R ∝ M0.78.[21]
Sample parameters
The table below shows typical values for stars along the main sequence. The values of luminosity (L), radius (R) and mass (M) are relative to the Sun—a dwarf star with a spectral classification of G2 V. The actual values for a star may vary by as much as 20–30% from the values listed below.[22]
-
Table of main-sequence stellar parameters[23] Stellar
ClassRadius Mass Luminosity Temperature Examples[24] R/R☉ M/M☉ L/L☉ K O5 18 40 500,000 38,000 Zeta Puppis B0 7.4 18 20,000 30,000 Phi1 Orionis B5 3.8 6.5 800 16,400 Pi Andromedae A A0 2.5 3.2 80 10,800 Alpha Coronae Borealis A A5 1.7 2.1 20 8,620 Beta Pictoris F0 1.4 1.7 6 7,240 Gamma Virginis F5 1.2 1.29 2.5 6,540 Eta Arietis G0 1.05 1.10 1.26 6,000 Beta Comae Berenices G2 1.00 1.00 1.00 5,920 Sun[note 2] G5 0.93 0.93 0.79 5,610 Alpha Mensae K0 0.85 0.78 0.40 5,150 70 Ophiuchi A K5 0.74 0.69 0.16 4,640 61 Cygni A[25] M0 0.63 0.47 0.063 3,920 Gliese 185[26] M5 0.32 0.21 0.0079 3,120 EZ Aquarii A M8 0.13 0.10 0.0008 — Van Biesbroeck's star[27]
Energy generation
See also: Stellar nucleosynthesisAll main-sequence stars have a core region where energy is generated by nuclear fusion. The temperature and density of this core are at the levels necessary to sustain the energy production that will support the remainder of the star. A reduction of energy production would cause the overlaying mass to compress the core, resulting in an increase in the fusion rate because of higher temperature and pressure. Likewise an increase in energy production would cause the star to expand, lowering the pressure at the core. Thus the star forms a self-regulating system in hydrostatic equilibrium that is stable over the course of its main sequence lifetime.[28]
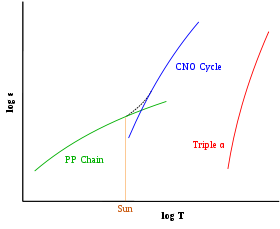 This graph shows the logarithm of the relative energy output (ε) for the proton-proton (PP), CNO and triple-α fusion processes at different temperatures. The dashed line shows the combined energy generation of the PP and CNO processes within a star. At the Sun's core temperature, the PP process is more efficient.
Main-sequence stars employ two types of hydrogen fusion processes, and the rate of energy generation from each type depends on the temperature in the core region. Astronomers divide the main sequence into upper and lower parts, based on which of the two is the dominant fusion process. In the lower main sequence, energy is primarily generated as the result of the proton-proton chain, which directly fuses hydrogen together in a series of stages to produce helium.[29] Stars in the upper main sequence have sufficiently high core temperatures to efficiently use the CNO cycle. (See the chart.) This process uses atoms of carbon, nitrogen and oxygen as intermediaries in the process of fusing hydrogen into helium.
At a stellar core temperature of 18 million kelvins, the PP process and CNO cycle are equally efficient, and each type generates half of the star's net luminosity. As this is the core temperature of a star with about 1.5 solar masses, the upper main sequence consists of stars above this mass. Thus, roughly speaking, stars of spectral class F or cooler belong to the lower main sequence, while class A stars or hotter are upper main-sequence stars.[16] The transition in primary energy production from one form to the other spans a range difference of less than a single solar mass. In the Sun, a one solar mass star, only 1.5% of the energy is generated by the CNO cycle.[30] By contrast, stars with 1.8 solar masses or above generate almost their entire energy output through the CNO cycle.[31]
The observed upper limit for a main-sequence star is 120–200 solar masses.[32] The theoretical explanation for this limit is that stars above this mass can not radiate energy fast enough to remain stable, so any additional mass will be ejected in a series of pulsations until the star reaches a stable limit.[33] The lower limit for sustained proton-proton nuclear fusion is about 0.08 solar masses.[29] Below this threshold are sub-stellar objects that can not sustain hydrogen fusion, known as brown dwarfs.[34]
Structure
Main article: Stellar structure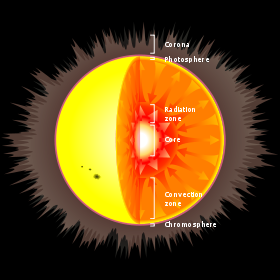 This diagram shows a cross-section of a Sun-like star, showing the internal structure.
Because there is a temperature difference between the core and the surface, or photosphere, energy is transported outward. The two modes for transporting this energy are radiation and convection. A radiation zone, where energy is transported by radiation, is stable against convection and there is very little mixing of the plasma. By contrast, in a convection zone the energy is transported by bulk movement of plasma, with hotter material rising and cooler material descending. Convection is a more efficient mode for carrying energy than radiation, but it will only occur under conditions that create a steep temperature gradient.[28][35]
In massive stars (above 10 solar masses)[36] the rate of energy generation by the CNO cycle is very sensitive to temperature, so the fusion is highly concentrated at the core. Consequently, there is a high temperature gradient in the core region, which results in a convection zone for more efficient energy transport.[29] This mixing of material around the core removes the helium ash from the hydrogen-burning region, allowing more of the hydrogen in the star to be consumed during the main-sequence lifetime. The outer regions of a massive star transport energy by radiation, with little or no convection.[28]
Intermediate mass stars such as Sirius may transport energy primarily by radiation, with a small core convection region.[37] Medium-sized, low mass stars like the Sun have a core region that is stable against convection, with a convection zone near the surface that mixes the outer layers. This results in a steady buildup of a helium-rich core, surrounded by a hydrogen-rich outer region. By contrast, cool, very low-mass stars (below 0.4 solar masses) are convective throughout.[13] Thus the helium produced at the core is distributed across the star, producing a relatively uniform atmosphere and a proportionately longer main sequence lifespan.[28]
Luminosity-color variation
As non-fusing helium ash accumulates in the core of a main-sequence star, the reduction in the abundance of hydrogen per unit mass results in a gradual lowering of the fusion rate within that mass. To compensate, the core temperature and pressure slowly increase, which causes a net increase in the overall fusion rate (to support the greater density of the inner star). This produces a steady increase in the luminosity and radius of the star over time.[16] Thus, for example, the luminosity of the early Sun was only about 70% of its current value.[38] As a star ages this luminosity increase changes its position on the HR diagram. This effect results in a broadening of the main sequence band because stars are observed at random stages in their lifetime. That is, the main sequence band develops a thickness on the HR diagram; it is not simply a narrow line.[39]
Other factors that broaden the main sequence band on the HR diagram include uncertainty in the distance to stars and the presence of unresolved binary stars that can alter the observed stellar parameters. However, even perfect observation would show a fuzzy main sequence because mass is not the only parameter that affects a star's color and luminosity. In addition to variations in chemical composition—both because of the initial abundances and the star's evolutionary status,[40] interaction with a close companion,[41] rapid rotation,[42] or a magnetic field can also change a main-sequence star's position slightly on the HR diagram, to name just a few factors. As an example, there are stars that have a very low abundance of elements with higher atomic numbers than helium—known as metal-poor stars—that lie just below the main sequence. Known as subdwarfs, these stars are also fusing hydrogen in their core and so they mark the lower edge of the main sequence's fuzziness resulting from chemical composition.[43]
A nearly vertical region of the HR diagram, known as the instability strip, is occupied by pulsating variable stars known as Cepheid variables. These stars vary in magnitude at regular intervals, giving them a pulsating appearance. The strip intersects the upper part of the main sequence in the region of class A and F stars, which are between one and two solar masses. Pulsating stars in this part of the instability strip that intersects the upper part of the main sequence are called Delta Scuti variables. Main-sequence stars in this region experience only small changes in magnitude and so this variation is difficult to detect.[44] Other classes of unstable main-sequence stars, like beta Cephei variables, are unrelated to this instability strip.
Lifetime
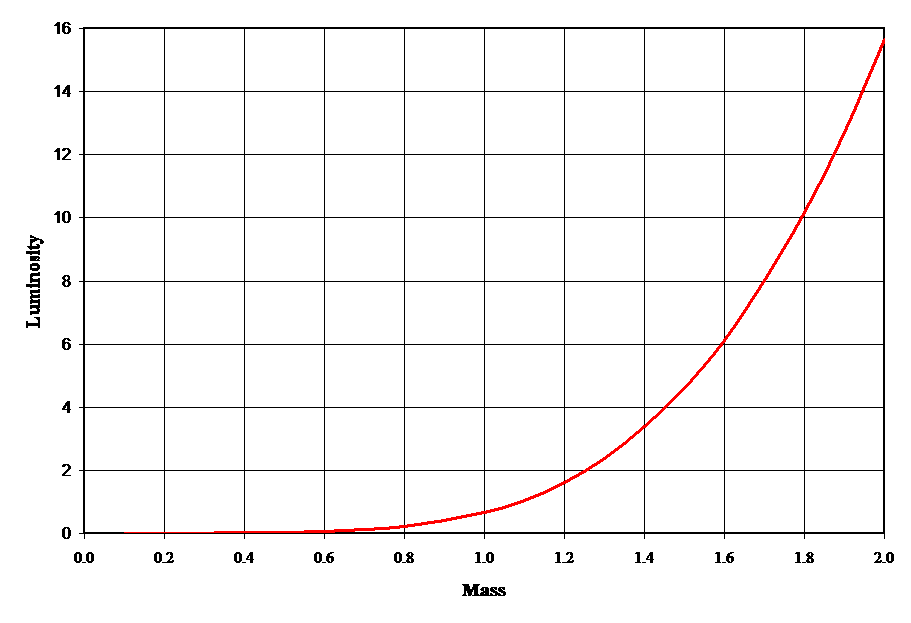
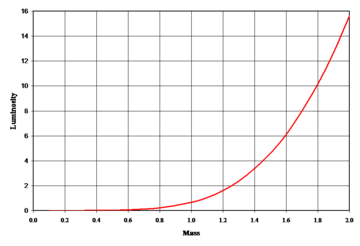 This plot gives an example of the mass-luminosity relationship for zero-age main-sequence stars. The mass and luminosity are relative to the present-day Sun.
The total amount of energy that a star can generate through nuclear fusion of hydrogen is limited by the amount of hydrogen fuel that can be consumed at the core. For a star in equilibrium, the energy generated at the core must be at least equal to the energy radiated at the surface. Since the luminosity gives the amount of energy radiated per unit time, the total life span can be estimated, to first approximation, as the total energy produced divided by the star's luminosity.[45]
For a star with at least 0.5 solar masses, once the hydrogen supply in its core is exhausted and it expands to become a red giant, it can start to fuse helium atoms to form carbon. The energy output of the helium fusion process per unit mass is only about a tenth the energy output of the hydrogen process, and the luminosity of the star increases.[46] This results in a much shorter length of time in this stage compared to the main sequence lifetime. (For example, the Sun is predicted to spend 130 million years burning helium, compared to about 12 billion years burning hydrogen.)[47] Thus, about 90% of the observed stars above 0.5 solar masses will be on the main sequence.[48] On average, main-sequence stars are known to follow an empirical mass-luminosity relationship.[49] The luminosity (L) of the star is roughly proportional to the total mass (M) as the following power law:
This relationship applies to main-sequence stars in the range 0.1–50 solar masses.[50]
The amount of fuel available for nuclear fusion is proportional to the mass of the star. Thus, the lifetime of a star on the main sequence can be estimated by comparing it to solar evolutionary models. The Sun has been a main-sequence star for about 4.5 billion years and it will become a red giant in 6.5 billion years,[51] for a total main sequence lifetime of roughly 1010 years. Hence:[52]
where M and L are the mass and luminosity of the star, respectively,
 is a solar mass,
  is the solar luminosity and τMS is the star's estimated main sequence lifetime.
Although more massive stars have more fuel to burn and might be expected to last longer, they also must radiate a proportionately greater amount with increased mass. Thus, the most massive stars may remain on the main sequence for only a few million years, while stars with less than a tenth of a solar mass may last for over a trillion years.[53]
The exact mass-luminosity relationship depends on how efficiently energy can be transported from the core to the surface. A higher opacity has an insulating effect that retains more energy at the core, so the star does not need to produce as much energy to remain in hydrostatic equilibrium. By contrast, a lower opacity means energy escapes more rapidly and the star must burn more fuel to remain in equilibrium.[54] Note, however, that a sufficiently high opacity can result in energy transport via convection, which changes the conditions needed to remain in equilibrium.[16]
In high-mass main-sequence stars, the opacity is dominated by electron scattering, which is nearly constant with increasing temperature. Thus the luminosity only increases as the cube of the star's mass.[46] For stars below 10 times the solar mass, the opacity becomes dependent on temperature, resulting in the luminosity varying approximately as the fourth power of the star's mass.[50] For very low mass stars, molecules in the atmosphere also contribute to the opacity. Below about 0.5 solar masses, the luminosity of the star varies as the mass to the power of 2.3, producing a flattening of the slope on a graph of mass versus luminosity. Even these refinements are only an approximation, however, and the mass-luminosity relation can vary depending on a star's composition.[13]
Evolutionary tracks
See also: Stellar evolution This shows the Hertzsprung-Russell diagrams for two open clusters. NGC 188 (blue) is older, and shows a lower turn off from the main sequence than that seen in M67 (yellow).
Once a main-sequence star consumes the hydrogen at its core, the loss of energy generation causes gravitational collapse to resume. For stars with less than 0.23 solar masses,[3] they are predicted to become white dwarfs once energy generation by nuclear fusion of hydrogen at the core comes to a halt. For stars above this threshold with up to 10 solar masses, the hydrogen surrounding the helium core reaches sufficient temperature and pressure to undergo fusion, forming a hydrogen-burning shell. In consequence of this change, the outer envelope of the star expands and decreases in temperature, turning it into a red giant. At this point the star is evolving off the main sequence and entering the giant branch. The path the star now follows across the HR diagram, to the upper right of the main sequence, is called an evolutionary track.
The helium core of a red giant continues to collapse until it is entirely supported by electron degeneracy pressure—a quantum mechanical effect that restricts how closely matter can be compacted. For stars of more than about 0.5 solar masses,[55] the core can reach a temperature where it becomes hot enough to burn helium into carbon via the triple alpha process.[56][57] Stars with more than 5–7.5 solar masses can also fuse elements with higher atomic numbers.[58][59] For stars with ten or more solar masses, this process can lead to an increasingly dense core that finally collapses, ejecting the star's overlying layers in a Type II supernova explosion,[4] Type Ib supernova or Type Ic supernova.
When a cluster of stars is formed at about the same time, the life span of these stars will depend on their individual masses. The most massive stars will leave the main sequence first, followed steadily in sequence by stars of ever lower masses. Thus the stars will evolve in order of their position on the main sequence, proceeding from the most massive at the left toward the right of the HR diagram. The current position where stars in this cluster are leaving the main sequence is known as the turn-off point. By knowing the main sequence lifespan of stars at this point, it becomes possible to estimate the age of the cluster.[60]
See also
- Hertzsprung-Russell diagram
- Hydrogen-burning process
Notes
- ^ By measuring the difference between these values, this eliminates the need to correct the magnitudes for distance. However, see extinction.
- ^ The Sun is a typical type G2V star.
References
- ^ Harding E. Smith (1999-04-21). "The Hertzsprung-Russell Diagram". Gene Smith's Astronomy Tutorial. Center for Astrophysics & Space Sciences, University of California, San Diego. http://cass.ucsd.edu/public/tutorial/HR.html. Retrieved 2009-10-29.
- ^ Richard Powell (2006). "The Hertzsprung Russell Diagram". An Atlas of the Universe. http://www.atlasoftheuniverse.com/hr.html. Retrieved 2009-10-29.
- ^ a b Adams, Fred C.; Laughlin, Gregory (April 1997). "A Dying Universe: The Long Term Fate and Evolution of Astrophysical Objects". Reviews of Modern Physics 69 (2): 337–372. arXiv:astro-ph/9701131. Bibcode 1997RvMP...69..337A. doi:10.1103/RevModPhys.69.337.
- ^ a b Gilmore, Gerry (2004). "The Short Spectacular Life of a Superstar". Science 304 (5697): 1915–1916. doi:10.1126/science.1100370. PMID 15218132. http://www.sciencemag.org/cgi/content/full/sci;304/5679/1915. Retrieved 2007-05-01.
- ^ Longair, Malcolm S. (2006). The Cosmic Century: A History of Astrophysics and Cosmology. Cambridge University Press. pp. 25–26. ISBN 0-521-47436-1.
- ^ a b Brown, Laurie M.; Pais, Abraham; Pippard, A. B., eds (1995). Twentieth Century Physics. Bristol; New York: Institute of Physics, American Institute of Physics. p. 1696. ISBN 0-7503-0310-7. OCLC 33102501.
- ^ a b Russell, H. N. (1913). ""Giant" and "dwarf" stars". The Observatory 36: 324–329. Bibcode 1913Obs....36..324R.
- ^ Strömgren, Bengt (1933). "On the Interpretation of the Hertzsprung-Russell-Diagram". Zeitschrift für Astrophysik 7: 222–248. Bibcode 1933ZA......7..222S.
- ^ Schatzman, Evry L.; Praderie, Francoise (1993). The Stars. Springer. pp. 96–97. ISBN 3-540-54196-9.
- ^ Morgan, W. W.; Keenan, P. C.; Kellman, E. (1943). An atlas of stellar spectra, with an outline of spectral classification. Chicago, Illinois: The University of Chicago press. http://nedwww.ipac.caltech.edu/level5/ASS_Atlas/MK_contents.html. Retrieved 2008-08-12.
- ^ a b c Unsöld, Albrecht (1969). The New Cosmos. Springer-Verlag New York Inc. p. 268. ISBN 0-387-90886-2.
- ^ Gloeckler, George; Geiss, Johannes (2004). "Composition of the local interstellar medium as diagnosed with pickup ions". Advances in Space Research 34 (1): 53–60. Bibcode 2004AdSpR..34...53G. doi:10.1016/j.asr.2003.02.054.
- ^ a b c Kroupa, Pavel (2002-01-04). "The Initial Mass Function of Stars: Evidence for Uniformity in Variable Systems". Science 295 (5552): 82–91. arXiv:astro-ph/0201098. Bibcode 2002Sci...295...82K. doi:10.1126/science.1067524. PMID 11778039. http://www.sciencemag.org/cgi/content/abstract/295/5552/82. Retrieved 2008-12-08.
- ^ Schilling, Govert (2001). "New Model Shows Sun Was a Hot Young Star". Science 293 (5538): 2188–2189. doi:10.1126/science.293.5538.2188. PMID 11567116. http://www.sciencemag.org/cgi/content/full/293/5538/2188. Retrieved 2007-02-04.
- ^ "Zero Age Main Sequence". The SAO Encyclopedia of Astronomy. Swinburne University. http://astronomy.swin.edu.au/cms/astro/cosmos/Z/Zero+Age+Main+Sequence. Retrieved 2007-12-09.
- ^ a b c d Clayton, Donald D. (1983). Principles of Stellar Evolution and Nucleosynthesis. University of Chicago Press. ISBN 0-226-10953-4.
- ^ "Main Sequence Stars". Australia Telescope Outreach and Education. http://outreach.atnf.csiro.au/education/senior/astrophysics/stellarevolution_mainsequence.html. Retrieved 2007-12-04.
- ^ Moore, Patrick (2006). The Amateur Astronomer. Springer. ISBN 1-85233-878-4.
- ^ "White Dwarf". COSMOS—The SAO Encyclopedia of Astronomy. Swinburne University. http://astronomy.swin.edu.au/cosmos/W/White+Dwarf. Retrieved 2007-12-04.
- ^ "Origin of the Hertzsprung-Russell Diagram". University of Nebraska. http://astro.unl.edu/naap/hr/hr_background3.html. Retrieved 2007-12-06.
- ^ "A course on stars' physical properties, formation and evolution". University of St. Andrews. http://www-star.st-and.ac.uk/~kw25/teaching/stars/STRUC4.pdf. Retrieved 2010-05-18.
- ^ Siess, Lionel (2000). "Computation of Isochrones". Institut d'Astronomie et d'Astrophysique, Université libre de Bruxelles. http://www-astro.ulb.ac.be/~siess/server/iso.html. Retrieved 2007-12-06.—Compare, for example, the model isochrones generated for a ZAMS of 1.1 solar masses. This is listed in the table as 1.26 times the solar luminosity. At metallicity Z=0.01 the luminosity is 1.34 times solar luminosity. At metallicity Z=0.04 the luminosity is 0.89 times the solar luminosity.
- ^ Zombeck, Martin V. (1990). Handbook of Space Astronomy and Astrophysics (2nd ed.). Cambridge University Press. ISBN 0-521-34787-4. http://ads.harvard.edu/books/hsaa/toc.html. Retrieved 2007-12-06.
- ^ "SIMBAD Astronomical Database". Centre de Données astronomiques de Strasbourg. http://simbad.u-strasbg.fr/simbad/. Retrieved 2008-11-21.
- ^ Luck, R. Earle; Heiter, Ulrike (2005). "Stars within 15 Parsecs: Abundances for a Northern Sample". The Astronomical Journal 129 (2): 1063–1083. Bibcode 2005AJ....129.1063L. doi:10.1086/427250.
- ^ 185 "LTT 2151 -- High proper-motion Star". Centre de Données astronomiques de Strasbourg. http://simbad.u-strasbg.fr/simbad/sim-basic?Ident=Gliese 185. Retrieved 2008-08-12.
- ^ Staff (2008-01-01). "List of the Nearest Hundred Nearest Star Systems". Research Consortium on Nearby Stars. http://www.chara.gsu.edu/RECONS/TOP100.posted.htm. Retrieved 2008-08-12.
- ^ a b c d Brainerd, Jerome James (2005-02-16). "Main-Sequence Stars". The Astrophysics Spectator. http://www.astrophysicsspectator.com/topics/stars/MainSequence.html. Retrieved 2007-12-04.
- ^ a b c Karttunen, Hannu (2003). Fundamental Astronomy. Springer. ISBN 3-540-00179-4.
- ^ Bahcall, John N.; Pinsonneault, M. H.; Basu, Sarbani (2001-07-10). "Solar Models: Current Epoch and Time Dependences, Neutrinos, and Helioseismological Properties". The Astrophysical Journal 555 (2): 990–1012. arXiv:astro-ph/0212331. Bibcode 2003PhRvL..90m1301B. doi:10.1086/321493.
- ^ Salaris, Maurizio; Cassisi, Santi (2005). Evolution of Stars and Stellar Populations. John Wiley and Sons. p. 128. ISBN 0-470-09220-3.
- ^ Oey, M. S.; Clarke, C. J. (2005). "Statistical Confirmation of a Stellar Upper Mass Limit". The Astrophysical Journal 620 (1): L43–L46. arXiv:astro-ph/0501135. Bibcode 2005ApJ...620L..43O. doi:10.1086/428396.
- ^ Ziebarth, Kenneth (1970). "On the Upper Mass Limit for Main-Sequence Stars". Astrophysical Journal 162: 947–962. Bibcode 1970ApJ...162..947Z. doi:10.1086/150726.
- ^ Burrows, A.; Hubbard, W. B.; Saumon, D.; Lunine, J. I. (March 1993). "An expanded set of brown dwarf and very low mass star models". Astrophysical Journal, Part 1 406 (1): 158–171. Bibcode 1993ApJ...406..158B. doi:10.1086/172427.
- ^ Aller, Lawrence H. (1991). Atoms, Stars, and Nebulae. Cambridge University Press. ISBN 0-521-31040-7.
- ^ Bressan, A. G.; Chiosi, C.; Bertelli, G. (1981). "Mass loss and overshooting in massive stars". Astronomy and Astrophysics 102 (1): 25–30. Bibcode 1981A&A...102...25B.
- ^ Lochner, Jim; Gibb, Meredith; Newman, Phil (2006-09-06). "Stars". NASA. http://imagine.gsfc.nasa.gov/docs/science/know_l2/stars.html. Retrieved 2007-12-05.
- ^ Gough, D. O. (1981). "Solar interior structure and luminosity variations". Solar Physics 74 (1): 21–34. Bibcode 1981SoPh...74...21G. doi:10.1007/BF00151270.
- ^ Padmanabhan, Thanu (2001). Theoretical Astrophysics. Cambridge University Press. ISBN 0-521-56241-4.
- ^ Wright, J. T. (2004). "Do We Know of Any Maunder Minimum Stars?". The Astronomical Journal 128 (3): 1273–1278. arXiv:astro-ph/0406338. Bibcode 2004AJ....128.1273W. doi:10.1086/423221. http://adsabs.harvard.edu/cgi-bin/bib_query?arXiv:astro-ph/0406338. Retrieved 2007-12-06.
- ^ Tayler, Roger John (1994). The Stars: Their Structure and Evolution. Cambridge University Press. ISBN 0-521-45885-4.
- ^ Sweet, I. P. A.; Roy, A. E. (1953). "The structure of rotating stars". Monthly Notices of the Royal Astronomical Society 113: 701–715. Bibcode 1953MNRAS.113..701S.
- ^ Burgasser, Adam J.; Kirkpatrick, J. Davy; Lepine, Sebastien (July 5–9, 2004). "Spitzer Studies of Ultracool Subdwarfs: Metal-poor Late-type M, L and T Dwarfs". Proceedings of the 13th Cambridge Workshop on Cool Stars, Stellar Systems and the Sun. Hamburg, Germany: Dordrecht, D. Reidel Publishing Co. pp. 237. http://adsabs.harvard.edu/cgi-bin/bib_query?arXiv:astro-ph/0409178. Retrieved 2007-12-06.
- ^ Green, S. F.; Jones, Mark Henry; Burnell, S. Jocelyn (2004). An Introduction to the Sun and Stars. Cambridge University Press. ISBN 0-521-54622-2.
- ^ Richmond, Michael W. (2004-11-10). "Stellar evolution on the main sequence". Rochester Institute of Technology. http://spiff.rit.edu/classes/phys230/lectures/star_age/star_age.html. Retrieved 2007-12-03.
- ^ a b Prialnik, Dina (2000). An Introduction to the Theory of Stellar Structure and Evolution. Cambridge University Press. ISBN 0-521-65937-X.
- ^ Schröder, K.-P.; Connon Smith, Robert (May 2008). "Distant future of the Sun and Earth revisited". Monthly Notices of the Royal Astronomical Society 386 (1): 155–163. Bibcode 2008MNRAS.386..155S. doi:10.1111/j.1365-2966.2008.13022.x.
- ^ Arnett, David (1996). Supernovae and Nucleosynthesis: An Investigation of the History of Matter, from the Big Bang to the Present. Princeton University Press. ISBN 0-691-01147-8.—Hydrogen fusion produces 8×10¹⁸ erg/g while helium fusion produces 8×10¹⁷ erg/g.
- ^ For a detailed historical reconstruction of the theoretical derivation of this relationship by Eddington in 1924, see: Lecchini, Stefano (2007). How Dwarfs Became Giants. The Discovery of the Mass-Luminosity Relation. Bern Studies in the History and Philosophy of Science. ISBN 3-9522882-6-8. http://www.amazon.de/Dwarfs-Giants-Discovery-Mass-Luminosity-Relation/dp/3952288268.
- ^ a b Rolfs, Claus E.; Rodney, William S. (1988). Cauldrons in the Cosmos: Nuclear Astrophysics. University of Chicago Press. p. 46. ISBN 0-226-72457-3.
- ^ Sackmann, I.-Juliana; Boothroyd, Arnold I.; Kraemer, Kathleen E. (November 1993). "Our Sun. III. Present and Future". Astrophysical Journal 418: 457–468. Bibcode 1993ApJ...418..457S. doi:10.1086/173407.
- ^ Hansen, Carl J.; Kawaler, Steven D. (1994). Stellar Interiors: Physical Principles, Structure, and Evolution. Birkhäuser. p. 28. ISBN 0-387-94138-X.
- ^ Laughlin, Gregory; Bodenheimer, Peter; Adams, Fred C. (1997). "The End of the Main Sequence". The Astrophysical Journal 482 (1): 420–432. Bibcode 1997ApJ...482..420L. doi:10.1086/304125.
- ^ Imamura, James N. (1995-02-07). "Mass-Luminosity Relationship". University of Oregon. Archived from the original on December 14, 2006. http://web.archive.org/web/20061214065335/http://zebu.uoregon.edu/~imamura/208/feb6/mass.html. Retrieved 2007-01-08.
- ^ Fynbo, Hans O. U. et al. (2004). "Revised rates for the stellar triple-α process from measurement of 12C nuclear resonances". Nature 433 (7022): 136–139. doi:10.1038/nature03219. PMID 15650733.
- ^ Sitko, Michael L. (2000-03-24). "Stellar Structure and Evolution". University of Cincinnati. http://www.physics.uc.edu/~sitko/Spring00/4-Starevol/starevol.html. Retrieved 2007-12-05.
- ^ Staff (2006-10-12). "Post-Main Sequence Stars". Australia Telescope Outreach and Education. http://outreach.atnf.csiro.au/education/senior/astrophysics/stellarevolution_postmain.html. Retrieved 2008-01-08.
- ^ Girardi, L.; Bressan, A.; Bertelli, G.; Chiosi, C. (2000). "Evolutionary tracks and isochrones for low- and intermediate-mass stars: From 0.15 to 7 Msun, and from Z=0.0004 to 0.03". Astronomy and Astrophysics Supplement 141 (3): 371–383. arXiv:astro-ph/9910164. Bibcode 2000A&AS..141..371G. doi:10.1051/aas:2000126.
- ^ Poelarends, A. J. T.; Herwig, F.; Langer, N.; Heger, A. (March 2008). "The Supernova Channel of Super-AGB Stars". The Astrophysical Journal 675 (1): 614–625. Bibcode 2008ApJ...675..614P. doi:10.1086/520872.
- ^ Krauss, Lawrence M.; Chaboyer, Brian (2003). "Age Estimates of Globular Clusters in the Milky Way: Constraints on Cosmology". Science 299 (5603): 65–69. Bibcode 2003Sci...299...65K. doi:10.1126/science.1075631. PMID 12511641.
External links
- A java based applet for stellar evolution.
- Charity, Mitchell (2001-06-04). "What color are the stars?". Vendian Systems. http://www.vendian.org/mncharity/dir3/starcolor/. Retrieved 2008-11-26.
Categories:- Hertzsprung-Russell classifications
- Main sequence stars
- Star types
- Stellar evolution


![\begin{smallmatrix} \tau_{\rm MS}\ \approx \ 10^{10} \text{years} \cdot \left[ \frac{M}{M_{\bigodot}} \right] \cdot \left[ \frac{L_{\bigodot}}{L} \right]\ =\ 10^{10} \text{years} \cdot \left[ \frac{M}{M_{\bigodot}} \right]^{-2.5} \end{smallmatrix}](2/692ee5b682564f34563381d8258ddba4.png)

Wikimedia Foundation. 2010.