- Color–color diagram
-
In astronomy, color–color diagrams are a means of comparing the apparent magnitudes of stars at different wavelengths. Astronomers typically observe at narrow bands around certain wavelengths, and objects observed will have different brightnesses in each band. The difference the brightness in two bands is referred to as color. On color–color diagrams, the color defined by two wavelength bands is plotted on the horizontal axis, and then the color defined by another brightness difference (though usually there is one band involved in determining both colors) will be plotted on the vertical axis.
Contents
Background
While stars are not perfect blackbodies, to first order the spectra of light emitted by stars conforms closely to a blackbody radiation curve, also referred to sometimes as a thermal radiation curve. The overall shape of a black body curve is uniquely determined by its temperature, and the wavelength of peak intensity is inversely proportional to temperature, a relation known as Wien's Displacement Law. Thus, observation of a stellar spectrum allows determination of its effective temperature. Obtaining complete spectra for stars through spectrometry is much more involved than simple photometry in a few bands. Thus by comparing the magnitude of the star in multiple different color indices, the effective temperature of the star can still be determined, as magnitude differences between each color will be unique for that temperature. As such, color-color diagrams can be used as a means of representing the stellar population, much like a Hertzsprung–Russell diagram, and stars of different spectral classes will inhabit different parts of the diagram. This feature leads to applications within various wavelength bands.
Applications
Photometric calibration
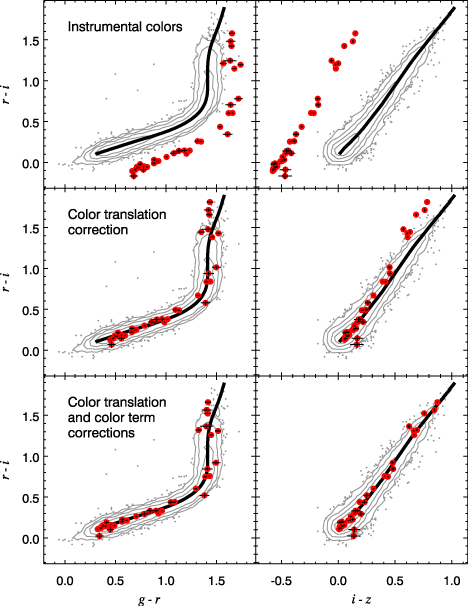
 A schematic illustration of the stellar locus regression method of photometric calibration in astronomy.
The color-color diagram of stars can be used to directly calibrate or to test colors and magnitudes in optical and infrared imaging data. Such methods take advantage of the fundamental distribution of stellar colors in our galaxy across the vast majority of the sky, and the fact that observed stellar colors (unlike apparent magnitudes) are independent of the distance to the stars. Stellar locus regression (SLR)[1] was a method developed to eliminate the need for standard star observations in photometric calibrations, except highly infrequently (once a year or less) to measure color terms. SLR has been used in a number of research initiatives. The NEWFIRM survey of the NOAO Deep Wide-Field Survey region used it to arrive at more accurate colors than would have otherwise been attainable by traditional calibration methods, and South Pole Telescope used SLR in the measurement of redshifts of galaxy clusters.[2] The blue-tip method[3] is closely related to SLR, but was used mainly to correct Galactic extinction predictions from IRAS data. Other surveys have used the stellar color-color diagram primarily as a calibration diagnostic tool, including The Oxford-Dartmouth Thirty Degree Survey[4] and Sloan Digital Sky Survey (SDSS).[5]
Color outliers
Analyzing data from large observational surveys, such as the SDSS or 2 Micron All Sky Survey (2MASS), can be challenging due to the huge number of data produced. For surveys such as these, color-color diagrams have been used to find outliers from the main sequence stellar population. Once these outliers are identified, they can then be studied in more detail. This method has been used to identify ultracool subdwarfs.[6][7] Unresolved binary stars, which appear photometrically to be points, have been identified by studying color-color outliers in cases where one member is off the main sequence.[8] The stages of the evolution of stars along the asymptotic giant branch from carbon star to planetary nebula appear on distinct regions of color–color diagrams.[9] Quasars also appear as color-color outliers.[8]
Star formation
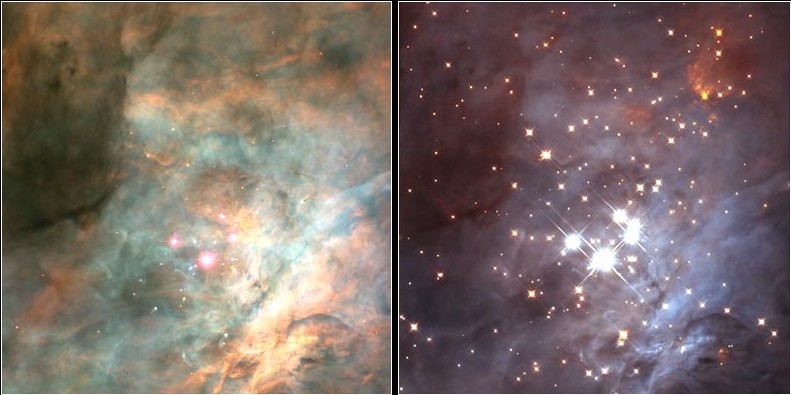
 The optical image (left) shows clouds of dust, while the infrared image (right) displays a number of young stars. Credit: C. R. O'Dell-Vanderbilt University, NASA, and ESA.
Color–color diagrams are often used in infrared astronomy to study star forming regions. Stars form in clouds of dust. As the star continues to contract, a circumstellar disk of dust is formed, and this dust is heated by the star inside. The dust itself then begins to radiate as a blackbody, though one much cooler than the star. As a result, an excess of infrared radiation is observed for the star. Even without circumstellar dust, regions undergoing star formation exhibit high infrared luminosities compared to stars on the main sequence.[10] Each of these effects is distinct from the reddening of starlight which occurs as a result of scattering off of dust in the interstellar medium.
 Color–color diagram of the Trapezium cluster shows that many cluster members exhibit infrared excess, which is characteristic of stars with circumstellar disks.
Color–color diagrams allow for these effects to be isolated. As the color–color relationships of main sequence stars are well known, a theoretical main sequence can be plotted for reference, as is done with the solid black line in the example to the right. Interstellar dust scattering is also well understood, allowing bands to be drawn on a color–color diagram defining the region in which stars reddened by interstellar dust are expected to be observed, indicated on the color–color diagram by dashed lines. The typical axes for infrared color–color diagrams have (H–K) on the horizontal axis and (J–H) on the vertical axis (see infrared astronomy for information on band color designations). On a diagram with these axes, stars which fall to the right of the main sequence and the reddening bands drawn are significantly brighter in the K band than main sequence stars, including main sequence stars which have experienced reddening due to interstellar dust. Of the J, H, and K bands, K is the longest wavelength, so objects which are anomalously bright in the K band are said to exhibit infrared excess. These objects are likely protostellar in nature, with the excess radiation at long wavelengths caused by suppression by the reflection nebula in which the protostars are embedded.[11] Color–color diagrams can be used then as a means of studying stellar formation, as the state of a star in its formation can be roughly determined by looking at its position on the diagram.[12]
See also
References
- ^ F. W. High et al. (2009). "Stellar Locus Regression: Accurate Color Calibration and the Real-Time Determination of Galaxy Cluster Photometric Redshifts". The Astronomical Journal 138 (1): 110–129. Bibcode 2009AJ....138..110H. doi:10.1088/0004-6256/138/1/110.
- ^ F. W. High et al. (2010). "Optical Redshift and Richness Estimates for Galaxy Clusters Selected with the Sunyaev-Zel'dovich Effect from 2008 South Pole Telescope Observations". The Astrophysical Journal 723 (2): 1736–1747. Bibcode 2010ApJ...723.1736H. doi:10.1088/0004-637X/723/2/1736.
- ^ E. Schlafly et al.. The Blue Tip of the Stellar Locus: Measuring Reddening with the SDSS. arXiv:1009.4933. Bibcode 2010ApJ...725.1175S. doi:10.1088/0004-637X/725/1/1175.
- ^ E. MacDonald et al. (2004). "The Oxford-Dartmouth Thirty Degree Survey - I. Observations and calibration of a wide-field multiband survey". Monthly Notices of the Royal Astronomical Society 352 (4): 1255–1272. arXiv:astro-ph/0405208. Bibcode 2004MNRAS.352.1255M. doi:10.1111/j.1365-2966.2004.08014.x.
- ^ Z. Ivezic et al. (2010). "Sloan Digital Sky Survey Standard Star Catalog for Stripe 82: The Dawn of Industrial 1% Optical Photometry". The Astronomical Journal 134 (3): 973–998. arXiv:astro-ph/0703157. Bibcode 2007AJ....134..973I. doi:10.1086/519976.
- ^ Burgasser, A. J., Cruz, K.L., Kirkpatrick, J.D. (2007). "Optical Spectroscopy of 2MASS Color-selected Ultracool Subdwarfs". Astrophysical Journal 657 (1): 494–510. arXiv:astro-ph/0610096. Bibcode 2006astro.ph.10096B. doi:10.1086/510148.
- ^ Gizis, J.E. et al. (2000). "New Neighbors from 2MASS: Activity and Kinematics at the Bottom of the Main Sequence". Astronomical Journal 120 (2): 1085–1099. arXiv:astro-ph/0004361. Bibcode 2000AJ....120.1085G. doi:10.1086/301456. http://www.iop.org/EJ/abstract/-link=9084013/1538-3881/120/2/1085.
- ^ a b Covey, K.R. et al. (2007). "Stellar SEDs from 0.3 to 2.5 micron: Tracing the Stellar Locus and Searching for Color Outliers in the SDSS and 2MASS". Astronomical Journal 134 (6): 2398–2417. Bibcode 2007AJ....134.2398C. doi:10.1086/522052. http://adsabs.harvard.edu/cgi-bin/bib_query?arXiv:0707.4473.
- ^ Ortiz, R. et al. (2005). "Evolution from AGB to planetary nebula in the MSX survey". Astronomy and Astrophysics 431 (2): 565–574. arXiv:astro-ph/0411769. Bibcode 2004astro.ph.11769O. doi:10.1051/0004-6361:20040401.
- ^ C. Struck-Marcell and B.M. Tinsley (1978). "Star formation rates and infrared radiation". Astrophysical Journal 221: 562–566. Bibcode 1978ApJ...221..562S. doi:10.1086/156057.
- ^ Lada, C.J. et al. (2000). "Infrared L-Band Observations of the Trapezium Cluster: A Census of Circumstellar Disks and Candidate Protostars". The Astronomical Journal 120 (6): 3162–3176. arXiv:astro-ph/0008280. Bibcode 2000AJ....120.3162L. doi:10.1086/316848.
- ^ Charles Lada and Fred Adams (1992). "Interpreting infrared color-color diagrams - Circumstellar disks around low- and intermediate-mass young stellar objects". Astrophysical Journal 393: 278–288. Bibcode 1992ApJ...393..278L. doi:10.1086/171505.
External links
- Stellar Locus Regression
- Color-Color and Color-Magnitude Diagrams (examples of color-color diagrams)
- Near-Infrared Photometric Variability of Stars Toward the Chamaeleon I Molecular Cloud
Categories:

Wikimedia Foundation. 2010.