- Diagram
-
Further information: Chart
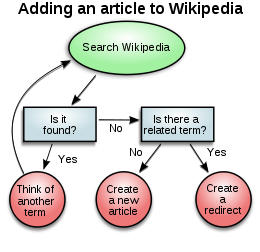 Sample flowchart representing the decision process to add a new article to Wikipedia.
A diagram is a two-dimensional geometric symbolic representation of information according to some visualization technique. Sometimes, the technique uses a three-dimensional visualization which is then projected onto the two-dimensional surface. The word graph is sometimes used as a synonym for diagram.
Today, most diagrams are generated using diagramming software.
Contents
Overview
A diagram is a 2D geometric symbolic representation of information according to some visualization technique. Sometimes, the technique uses a 3D visualization which is then projected onto the 2D surface. The term diagram in common sense can have two meanings.
- visual information device : Like the term "illustration" the diagram is used as a collective term standing for the whole class of technical genres, including graphs, technical drawings and tables.[1]
- specific kind of visual display : This is only the genre, that show qualitative data with shapes that are connected by lines, arrows, or other visual links.
In science the term is used in both ways. For example Anderson (1997) stated more generally: "diagrams are pictorial, yet abstract, representations of information, and maps, line graphs, bar charts, engineering blueprints, and architects' sketches are all examples of diagrams, whereas photographs and video are not".[2] On the other hand Lowe (1993) defined diagrams as specifically "abstract graphic portrayals of the subject matter they represent".[3]
In the specific sense diagrams and charts contrast computer graphics, technical illustrations, infographics, maps, and technical drawings, by show "abstract rather than literal representations of information".[1] The essences of a diagram can be seen as:[1]
- a form of visual formatting devices
- a display that do not show quantitative data, but rather relationships and abstract information
- with building blocks such as geometrical shapes connected by lines, arrows, or other visual links.
Or in Hall's (1996) words "diagrams are simplified figures, caricatures in a way, intended to convey essential meaning".[4] These simplified figures are often based on set of rules. The basic shape according to White (1984) can be characterized in terms of "elegance, clarity, ease, pattern, simplicity, and validity".[1] The elegance for a start is determined by whether or not the diagram is "the simplest and most fitting solution to a problem".[5]
Main diagram types
There are at least the following types of diagrams:
- Graph-based diagrams: these take a collection of items and relationships between them, and express them by giving each item a 2D position, while the relationships are expressed as connections between the items or overlaps between the items; examples of such techniques:
- Chart-like diagram techniques, which display a relationship between two variables that take either discrete or a continuous ranges of values; examples:
-

function graph
-

scatter plot
- Other types of diagrams, e.g.,
-

Three-dimensional diagram
Thousands of diagram techniques exist. Some more examples follow.
Specific diagram types
A–D
- A
- Activity diagram used in UML and SysML
- B
- Bachman diagram
- Booch – used in software engineering
- Block diagram
- Block Definition Diagram (BDD) used in SysML
- Business & IT Diagram (B&IT) - used in business and IT modelling
- C
- Cartogram
- Category theory diagrams
- Cause-and-effect diagram
- Circuit diagram
- Class diagram – from UML
- Collaboration diagram – from UML 1.x
- Communication diagram – from UML 2.0
- Commutative diagram
- Component diagram – from UML
- Composite structure diagram – from UML
- Concept map
- Constellation diagram
- Context diagram
- Control flow diagram
- Contour diagram
- Cordier diagram
- Cross functional flowchart
- D
- Database model diagram
- Data flow diagram
- Data structure diagram
- Dendrogram
- Dependency diagram
- Deployment diagram – from UML
- Dot and cross diagram
- Double bubble map - used in education
List of modeling languages
E–H
- E
- Entity-Relationship diagram (ERD)
- Event-driven process chain
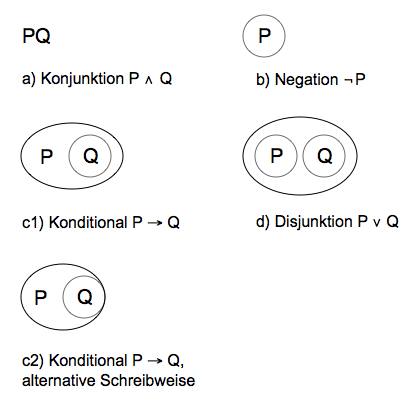
- Euler diagram
- Eye diagram - a diagram of a received telecommunications signal
- Express-G
- Extended Functional Flow Block Diagram (EFFBD)
- F
- Family tree
- Feynman diagram
- Flow chart
- Flow process chart
- Fusion diagram
- Free body diagram
- G
- Gantt chart – shows the timing of tasks or activities (used in project management)
- Grotrian diagram
- Goodman diagram - shows the fatigue data (example: for a wind turbine blades)
- H
- Hasse diagram
- HIPO diagram[6]
I–L
- I
- Internal Block Diagram (IBD) used in SysML
- IDEF0
- IDEF1 (entity relations)
- Interaction overview diagram – from UML
- Ishikawa diagram
- J
- K
- L
- Line of balance
M–P
- M
- Martin ERD
- Message Sequence Chart
- Mind map – used for learning, brainstorming, memory, visual thinking and problem solving
- N
- N2
- Nassi–Shneiderman diagram or structogram – a representation for structured programming
- Nomogram
- O
- Object diagram – from UML
- P
- Package diagram from UML and SysML
- Parametric diagram from SysML
- PERT
- Petri net – shows the structure of a distributed system as a directed bipartite graph with annotations
- Piping and instrumentation diagram (P&ID)
- Phase diagram used to present solid/liquid/gas information
- Plant Diagram
- Pressure volume diagram used to analyse engines
- Pourbaix diagram
- Process flow diagram or PFD – used in chemical engineering
- Program structure diagram
R–U
- R
- Radial Diagram
- Requirement Diagram Used in SysML
- Rich Picture
- S
- Sankey diagram - represents material, energy or cost flows with quantity proportional arrows in a process network.
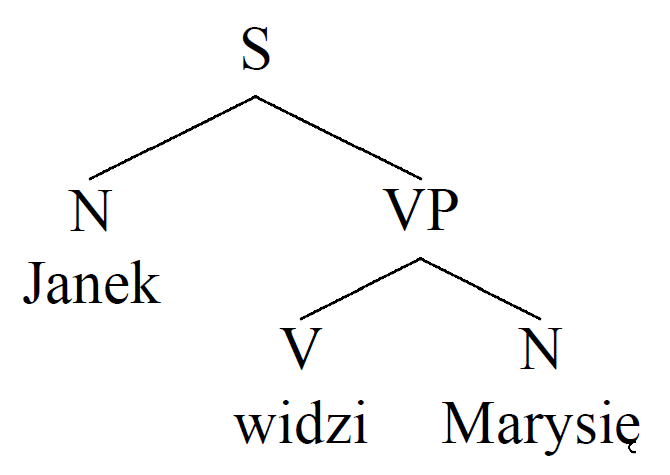
- Sentence diagram -- represents the grammatical structure of a natural language sentence.
- Sequence diagram from UML and SysML
- SDL/GR diagram – Specification and Description Language. SDL is a formal language used in computer science.
- Smith chart
- Spider chart
- Spray diagram
- SSADM – Structured Systems Analysis and Design Methodology (used in software engineering)
- Star chart/Celestial sphere
- State diagram are used for state machines in software engineering
- Swim lane
- Systems Biology Graphical Notation - a graphical notation used in diagrams of biochemical and cellular processes studied in Systems biology
- System context diagram
- System structure
- Systematic layout planning
- T
- Timing Diagram: Digital Timing Diagram
- Timing Diagram: UML Timing Diagram
- TQM Diagram
- U
- UML diagram – Unified Modeling Language (used in software engineering)
- Use case diagram – from UML and SysML
V–Z
- V
- W
- Warnier-Orr
- Y
- Yourdon-Coad – see Edward Yourdon, used in software engineering
See also
- Chart
- Diagramming Software
- Diagrammatic reasoning
- List of graphical methods
- Mathematical diagram
- Plot (graphics)
- commons:Specific diagram types - gallery of many diagram types.
- commons:Commons:Diagram resources
References
- ^ a b c d Brasseur, Lee E. (2003). Visualizing technical information: a cultural critique. Amityville, N.Y: Baywood Pub. ISBN 0-89503-240-6.
- ^ Michael Anderson (1997). "Introduction to Diagrammatic Reasoning". Retrieved 21 July 2008.
- ^ Lowe, Richard K. (1993). "Diagrammatic information: techniques for exploring its mental representation and processing". Information Design Journal 7 (1): 3–18. doi:10.1075/idj.7.1.01low.
- ^ Bert S. Hall (1996). "The Didactic and the Elegant: Some Thoughts on Scientific and Technological Illustrations in the Middle Ages and Renaissance". in: B. Braigie (ed.) Picturing knowledge: historical and philosophical problems concerning the use of art in science. Toronto: University of Toronto Press. p.9
- ^ White, Jan V. (1984). Using charts and graphs: 1000 ideas for visual persuasion. New York: Bowker. ISBN 0-8352-1894-5.
- ^ HIPO diagram
Further reading
- Bounford, Trevor (2000). Digital diagrams. New York: Watson-Guptill Publications. ISBN 9780823015726.
- Michael Anderson, Peter Cheng, Volker Haarslev (Eds.) (2000). Theory and Application of Diagrams: First International Conference, Diagrams 2000. Edinburgh, Scotland, UK, September 1–3, 2000. Proceedings.
Categories:- Infographics
- Diagrams


Wikimedia Foundation. 2010.