Data structure diagram

Data structure diagram
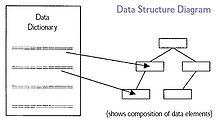
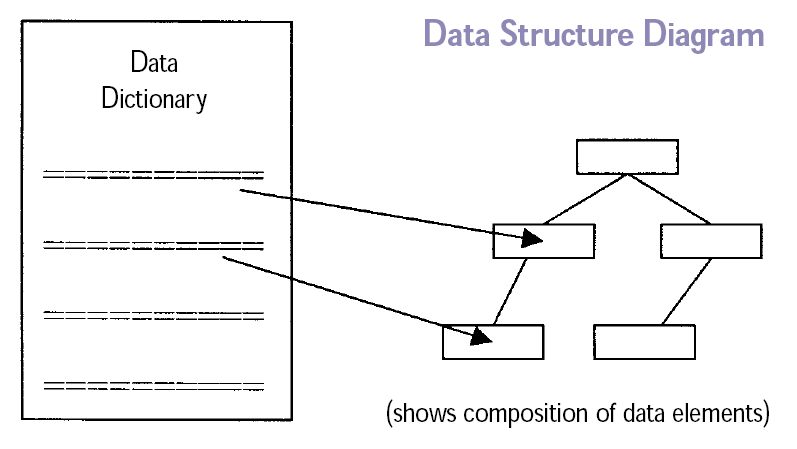
Example of a Data Structure Diagram.

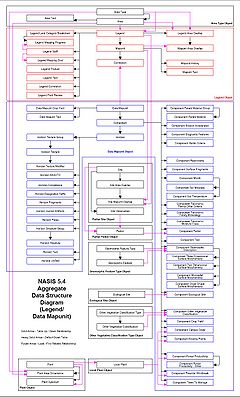
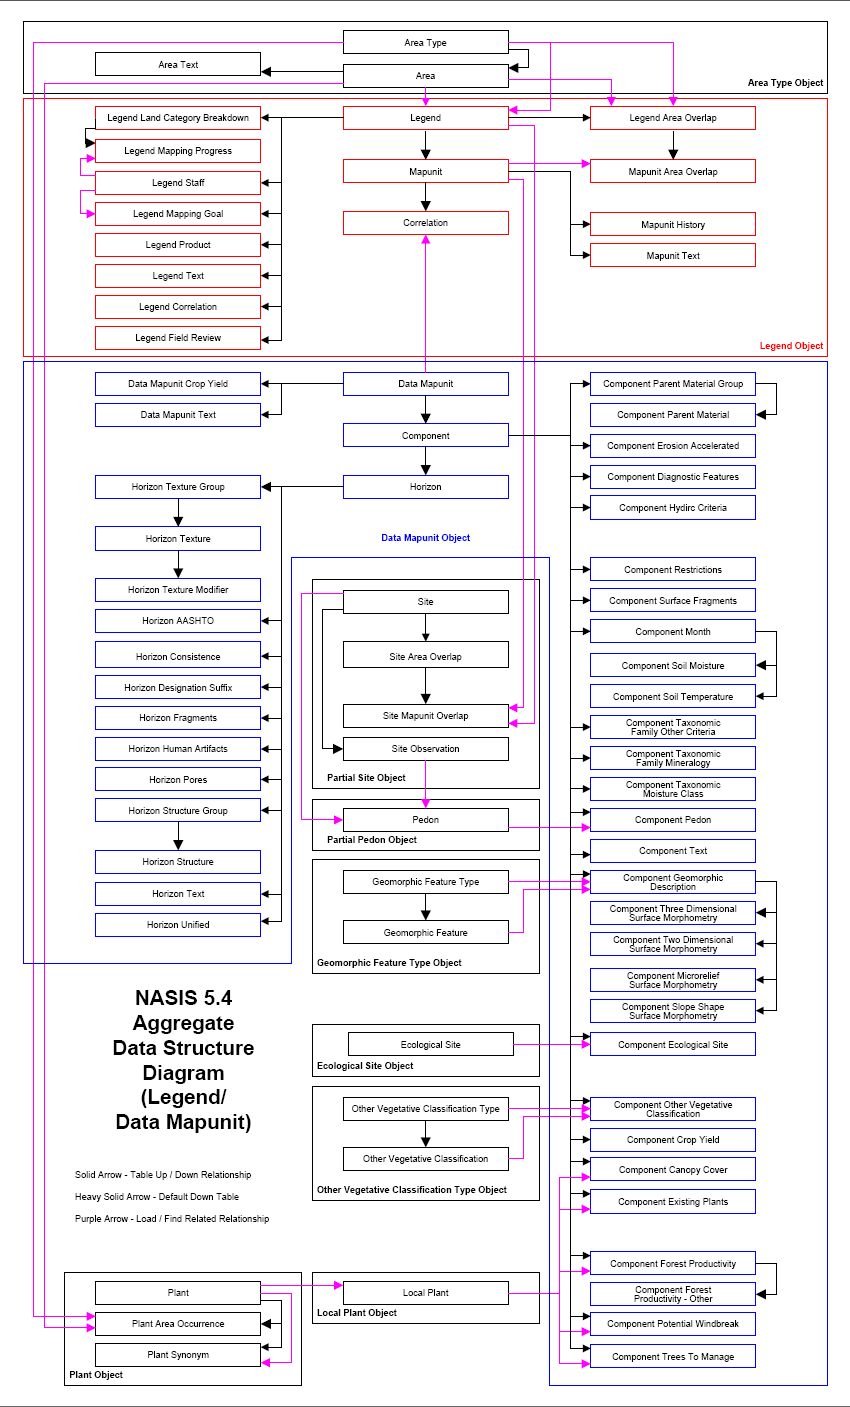
A Data Structure Diagram (DSD) is a data model used to describe conceptual data models by providing graphical notations which document entities and their relationships, and the constraints that binds them.

The basic graphic elements of DSDs are boxes, representing entities, and arrows, representing relationships. Data structure diagrams are most useful for documenting complex data entities.

Overview

Data Structure Diagram.

Data Structure Diagram is a diagram type that is used to depict the structure of data elements in the data dictionary. The data structure diagram is a graphical alternative to the composition specifications within such data dictionary entries..[1]

Data structure diagrams are an extension of the entity-relationship model (E-R model). In DSDs, attributes are specified inside the entity boxes rather than outside of them, while relationships are drawn as boxes composed of attributes which specify the constraints that bind entities together. The E-R model, while robust, doesn't provide a way to specify the constraints between relationships, and becomes visually cumbersome when representing entities with several attributes. DSDs differ from the E-R model in that the E-R model focuses on the relationships between different entities, whereas DSDs focus on the relationships of the elements within an entity and enable users to fully see the links and relationships between each entity.

There are several styles for representing data structure diagrams, with the notable difference in the manner of defining cardinality. The choices are between arrow heads, inverted arrow heads (crow's feet), or numerical representation of the cardinality.

References

  1. ^ Data Integration Glossary, U.S. Department of Transportation, August 2001.

Further reading


Wikimedia Foundation. 2010.

Игры ⚽ Нужно решить контрольную?

Look at other dictionaries:

  • Data flow diagram — example.[1] A data flow diagram (DFD) is a graphical representation of the flow of data through an information system, modelling its process aspects. Often they are a preliminary step used to create an overview of the system which can later be… …   Wikipedia

  • Control Structure Diagram — The Control Structure Diagram automatically documents the program flow within the source code and adds indentation with graphical symbols. Thereby the source code becomes visibly structured without sacrificing space. See also Diagram Entity… …   Wikipedia

  • Data structure — In computer science, a data structure is a particular way of storing and organizing data in a computer so that it can be used efficiently.[1][2] Different kinds of data structures are suited to different kinds of applications, and some are highly …   Wikipedia

  • Tree (data structure) — A simple unordered tree; in this diagram, the node labeled 7 has two children, labeled 2 and 6, and one parent, labeled 2. The root node, at the top, has no parent. In computer science, a tree is a widely used data structure that emulates a… …   Wikipedia

  • Container (data structure) — For the abstract notion of containers in Type theory, see Container (Type theory). In computer science, a container is a class, a data structure[1][2], or an abstract data type (ADT) whose instances are collections of other objects. In other… …   Wikipedia

  • Heap (data structure) — This article is about the programming data structure. For the dynamic memory area, see Dynamic memory allocation. Example of a complete binary max heap In computer science, a heap is a specialized tree based data structure that satisfies the heap …   Wikipedia

  • Data model — Overview of data modeling context: A data model provides the details of information to be stored, and is of primary use when the final product is the generation of computer software code for an application or the preparation of a functional… …   Wikipedia

  • Diagram — Further information: Chart Sample flowchart representing the decision process to add a new article to Wikipedia. A diagram is a two dimensional geometric symbolic representation of information according to some visualization technique. Sometimes …   Wikipedia

  • Data modeling — The data modeling process. The figure illustrates the way data models are developed and used today. A conceptual data model is developed based on the data requirements for the application that is being developed, perhaps in the context of an… …   Wikipedia

  • structure — /struk cheuhr/, n., v., structured, structuring. n. 1. mode of building, construction, or organization; arrangement of parts, elements, or constituents: a pyramidal structure. 2. something built or constructed, as a building, bridge, or dam. 3. a …   Universalium

Share the article and excerpts

Direct link
Do a right-click on the link above
and select “Copy Link”