- Karnaugh map
-
For former radio station KMAP (1962-1968) in Dallas-Fort Worth, see KRLD-FM.
 An example Karnaugh map
The Karnaugh map (K-map for short), Maurice Karnaugh's 1953 refinement of Edward Veitch's 1952 Veitch diagram, is a method to simplify Boolean algebra expressions. The Karnaugh map reduces the need for extensive calculations by taking advantage of humans' pattern-recognition capability, permitting the rapid identification and elimination of potential race conditions.
In a Karnaugh map the boolean variables are transferred (generally from a truth table) and ordered according to the principles of Gray code in which only one variable changes in between adjacent squares. Once the table is generated and the output possibilities are transcribed, the data is arranged into the largest possible groups containing 2n cells (n=0,1,2,3...)[1] and the minterm is generated through the axiom laws of boolean algebra.
Contents
Example
Karnaugh maps are used to facilitate the simplification of Boolean algebra functions. The following is an unsimplified Boolean Algebra function with Boolean variables A, B, C, D, and their inverses. They can be represented in two different notations:
- f(A,B,C,D) = ∑(6,8,9,10,11,12,13,14) Note: The values inside ∑ are the minterms to map (i.e. rows which have output 1 in the truth table).
Truth table
Using the defined minterms, the truth table can be created:
# A B C D f(A,B,C,D) 0 0 0 0 0 0 1 0 0 0 1 0 2 0 0 1 0 0 3 0 0 1 1 0 4 0 1 0 0 0 5 0 1 0 1 0 6 0 1 1 0 1 7 0 1 1 1 0 8 1 0 0 0 1 9 1 0 0 1 1 10 1 0 1 0 1 11 1 0 1 1 1 12 1 1 0 0 1 13 1 1 0 1 1 14 1 1 1 0 1 15 1 1 1 1 0 Karnaugh map
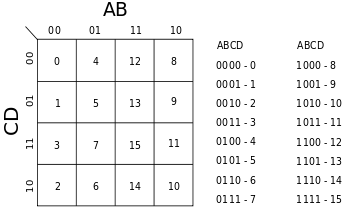 K-map construction.
The input variables can be combined in 16 different ways, so the Karnaugh map has 16 positions, and therefore is arranged in a 4 × 4 grid.
The binary digits in the map represent the function's output for any given combination of inputs. So 0 is written in the upper leftmost corner of the map because ƒ = 0 when A = 0, B = 0, C = 0, D = 0. Similarly we mark the bottom right corner as 10 because A = 1, B = 0, C = 1, D = 0 gives ƒ = 1. Note that the values are ordered in a Gray code, so that precisely one variable changes between any pair of adjacent cells.
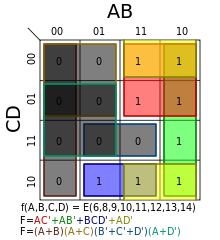
After the Karnaugh map has been constructed the next task is to find the minimal terms to use in the final expression. These terms are found by encircling groups of 1s in the map. The groups must be rectangular and must have an area that is a power of two (i.e. 1, 2, 4, 8…). The rectangles should be as large as possible without containing any 0s. The optimal groupings in this map are marked by the green, red and blue lines. Note that groups may overlap. In this example, the red and green groups overlap. The red group is a 2 × 2 square, the green group is a 4 × 1 rectangle, and the overlap area is indicated in brown.
The grid is toroidally connected, which means that the rectangular groups can wrap around edges, so
 is a valid term, although not part of the minimal set—this covers Minterms 8, 10, 12, and 14.
Perhaps the hardest-to-visualize wrap-around term is
 which covers the four corners—this covers minterms 0, 2, 8, 10.
Solution
 K-map showing minterms and boxes covering the desired minterms. The brown region is an overlapping of the red (square) and green regions.
Once the Karnaugh Map has been constructed and the groups derived, the solution can be found by eliminating extra variables within groups using the axioms of boolean algebra. It can be implied that rather than eliminating the variables that change within a grouping, the minimal function can be derived by noting which variables stay the same.
For the Red grouping:
- The variable A maintains the same state (1) in the whole encircling, therefore it should be included in the term for the red encircling.
- Variable B does not maintain the same state (it shifts from 1 to 0), and should therefore be excluded.
- C does not change: it is always 0. Because C is 0, it has to be negated before it is included (thus,
 ).
). - D changes, so it is excluded as well.
Thus the first term in the Boolean sum-of-products expression is

For the Green grouping we see that A,B maintain the same state, but C and D changes. B is 0 and has to be negated before it can be included. Thus the second term is

In the same way, the Blue grouping gives the term

The solutions of each grouping are combined into:

Inverse
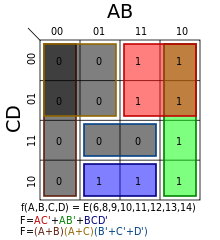
The inverse of a function is solved in the same way by grouping the 0s instead.
The three terms to cover the inverse are all shown with grey boxes with different colored borders:
- brown—

- gold—

- blue—BCD
This yields the inverse:
Through the use of De Morgan's laws, the product of sums can be determined:
Don't cares
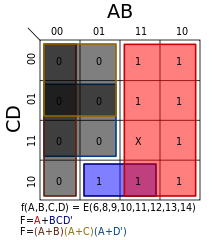 The minterm 15 is dropped and replaced as a don't care, this removes the green term completely but restricts the blue inverse term
Karnaugh maps also allow easy minimizations of functions whose truth tables include "don't care" conditions (that is, sets of inputs for which the designer doesn't care what the output is) because "don't care" conditions can be included in a circled group in an effort to make it larger. They are usually indicated on the map with a dash or X.
The example to the right is the same above example but with minterm 15 dropped and replaced as a don't care. This allows the red term to expand all the way down and, thus, removes the green term completely.
This yields the new minimum equation:
Note that the first term is just A not
 . In this case, the don't care has dropped a term (the green); simplified another (the red); and removed the race hazard (the yellow as shown in a following section).
Also, since the inverse case no longer has to cover minterm 15, minterm 7 can be covered with
 rather than
  with similar gains.
Race hazards
Elimination
Above k-map with the term added to avoid race hazards
Karnaugh maps are useful for detecting and eliminating race hazards. Race hazards are very easy to spot using a Karnaugh map, because a race condition may exist when moving between any pair of adjacent, but disjointed, regions circled on the map.
- In the example to the right, a potential race condition exists when C is 1 and D is 0, A is 1, and B changes from 1 to 0 (moving from the blue state to the green state). For this case, tition of the output to 0) exists.
- There is a second potential glitch in the same example that is more difficult to spot: when D is 0 and A and B are both 1, with C changing from 1 to 0 (moving from the blue state to the red state). In this case the glitch wraps around from the top of the map to the bottom.
Whether these glitches will actually occur depends on the physical nature of the implementation, and whether we need to worry about it depends on the application.
In this case, an additional term of
would eliminate the potential race hazard, bridging between the green and blue output states or blue and red output states: this is shown as the yellow region.The term is redundant in terms of the static logic of the system, but such redundant, or consensus terms, are often needed to assure race-free dynamic performance.
Similarly, an additional term of
 must be added to the inverse to eliminate another potential race hazard. Applying De Morgan's laws creates another product of sums expression for F, but with a new factor of
  .
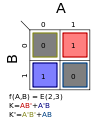
.2-variable map examples
The following are all the possible 2-variable, 2 × 2 Karnaugh maps. Listed with each is the minterms as a function of ∑() and the race hazard free (see previous section) minimum equation.
-
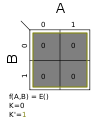
∑(0); K = 0
-
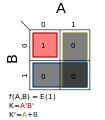
∑(1); K = A′B′
-
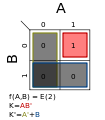
∑(2); K = AB′
-
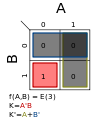
∑(3); K = A′B
-
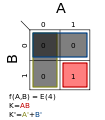
∑(4); K = AB
-
∑(1,2); K = B′
-
∑(1,3); K = A′
-
∑(1,4); K = A′B′ + AB
-
∑(2,3); K = AB′ + A′B
-
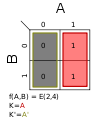
∑(2,4); K = A
-
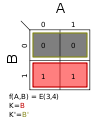
∑(3,4); K = B
-
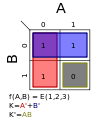
∑(1,2,3); K = A′ + B′
-
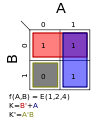
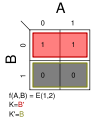
∑(1,2,4); K = A + B′
-
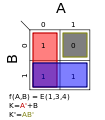
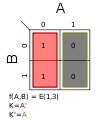
∑(1,3,4); K = A′ + B
-
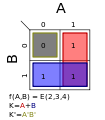
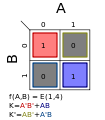
∑(2,3,4); K = A + B
-
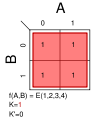
∑(1,2,3,4); K = 1
See also
- Circuit minimization
- Espresso heuristic logic minimizer
- List of boolean algebra topics
- Quine–McCluskey algorithm
- Venn diagram
References
Further reading
- Karnaugh, Maurice (November 1953). "The Map Method for Synthesis of Combinational Logic Circuits". Transactions of the American Institute of Electrical Engineers part I 72 (9): 593–599.
- Katz, Randy (1998) [1994]. Contemporary Logic Design. The Benjamin/Cummings. pp. 70–85. doi:10.1016/0026-2692(95)90052-7. ISBN 0-8053-2703-7.
- Veitch, Edward W. (1952). "A Chart Method for Simplifying Truth Functions". ACM Annual Conference/Annual Meeting: Proceedings of the 1952 ACM Annual Meeting (Pittsburg) (ACM, NY): pp. 127–133.
- Vingron, Dr. Shimon Peter (2004) [2004]. "Karnaugh Maps". Switching Theory: Insight Through Predicate Logic. Berlin, Heidelberg, New York: Springer-Verlag. pp. 57–76. ISBN 3-540-40343-4.
- Wickes, William E. (1968). Logic Design with Integrated Circuits. New York: John Wiley & Sons. pp. 36–49. Library of Congress Catalog Number: 68-21185. "A refinement of the Venn diagram in that circles are replaced by squares and arranged in a form of matrix. The Veitch diagram labels the squares with the minterms. Karnaugh assigned 1s and 0s to the squares and their labels and deduced the numbering scheme in common use."
External links
- Quine-McCluskey algorithm implementation with a search of all solutions, by Frédéric Carpon.
- Detect Overlapping Rectangles, by Herbert Glarner.
- Using Karnaugh maps in practical applications, Circuit design project to control traffic lights.
- K-Map Tutorial for 2,3,4 and 5 variables
- Karnaugh Map Example
Software
- Bmin, Qt Open Source application - Karnaugh maps and 3D Boolean n-cube visualization, Quine-McCluskey and Espresso minimization, PoS and SoP representation of functions and more.
- Karma, a set of logic synthesis tools including Karnaugh maps, Quine-McCluskey minimization, teaching module and more. Logic Circuit Synthesis Labs (LogiCS) - UFRGS, Brazil.
- Kmap minimizer Online Flash application, published 2009.
- Boolean Function Simplification Software, freeware application for the Palm OS.
- GKMap, free software application at SourceForge.net.
- GPA141, Java applet for solving 5-variable Karnaugh maps available only in French.
- Karnaugh Map Minimizer, free (but often incorrect, try with this equation : 0,1,5,8,10,13) software application at SourceForge.net.
- Karnaugh Map Explorer 2.0, JavaScript application (but false with this equation : 0,2,6,8,10,11,12,13,14,15).
- Simpogical, iPhone / iPad application for logic simplification.
- Gorgeous Karnaugh, freeware version of Gorgeous Karnaugh K-map minimization software.
- Usmania KMap Minimizer, lets you minimize a kmap of upto 25 variables.
Categories:- Boolean algebra
- Logic in computer science
- Diagrams
- Electronics optimization


Wikimedia Foundation. 2010.