- OBASHI
-
The OBASHI® methodology provides a framework and method for capturing, illustrating and modeling the relationships, dependencies and dataflows between business and Information technology (IT) assets and resources in a business context.
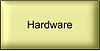
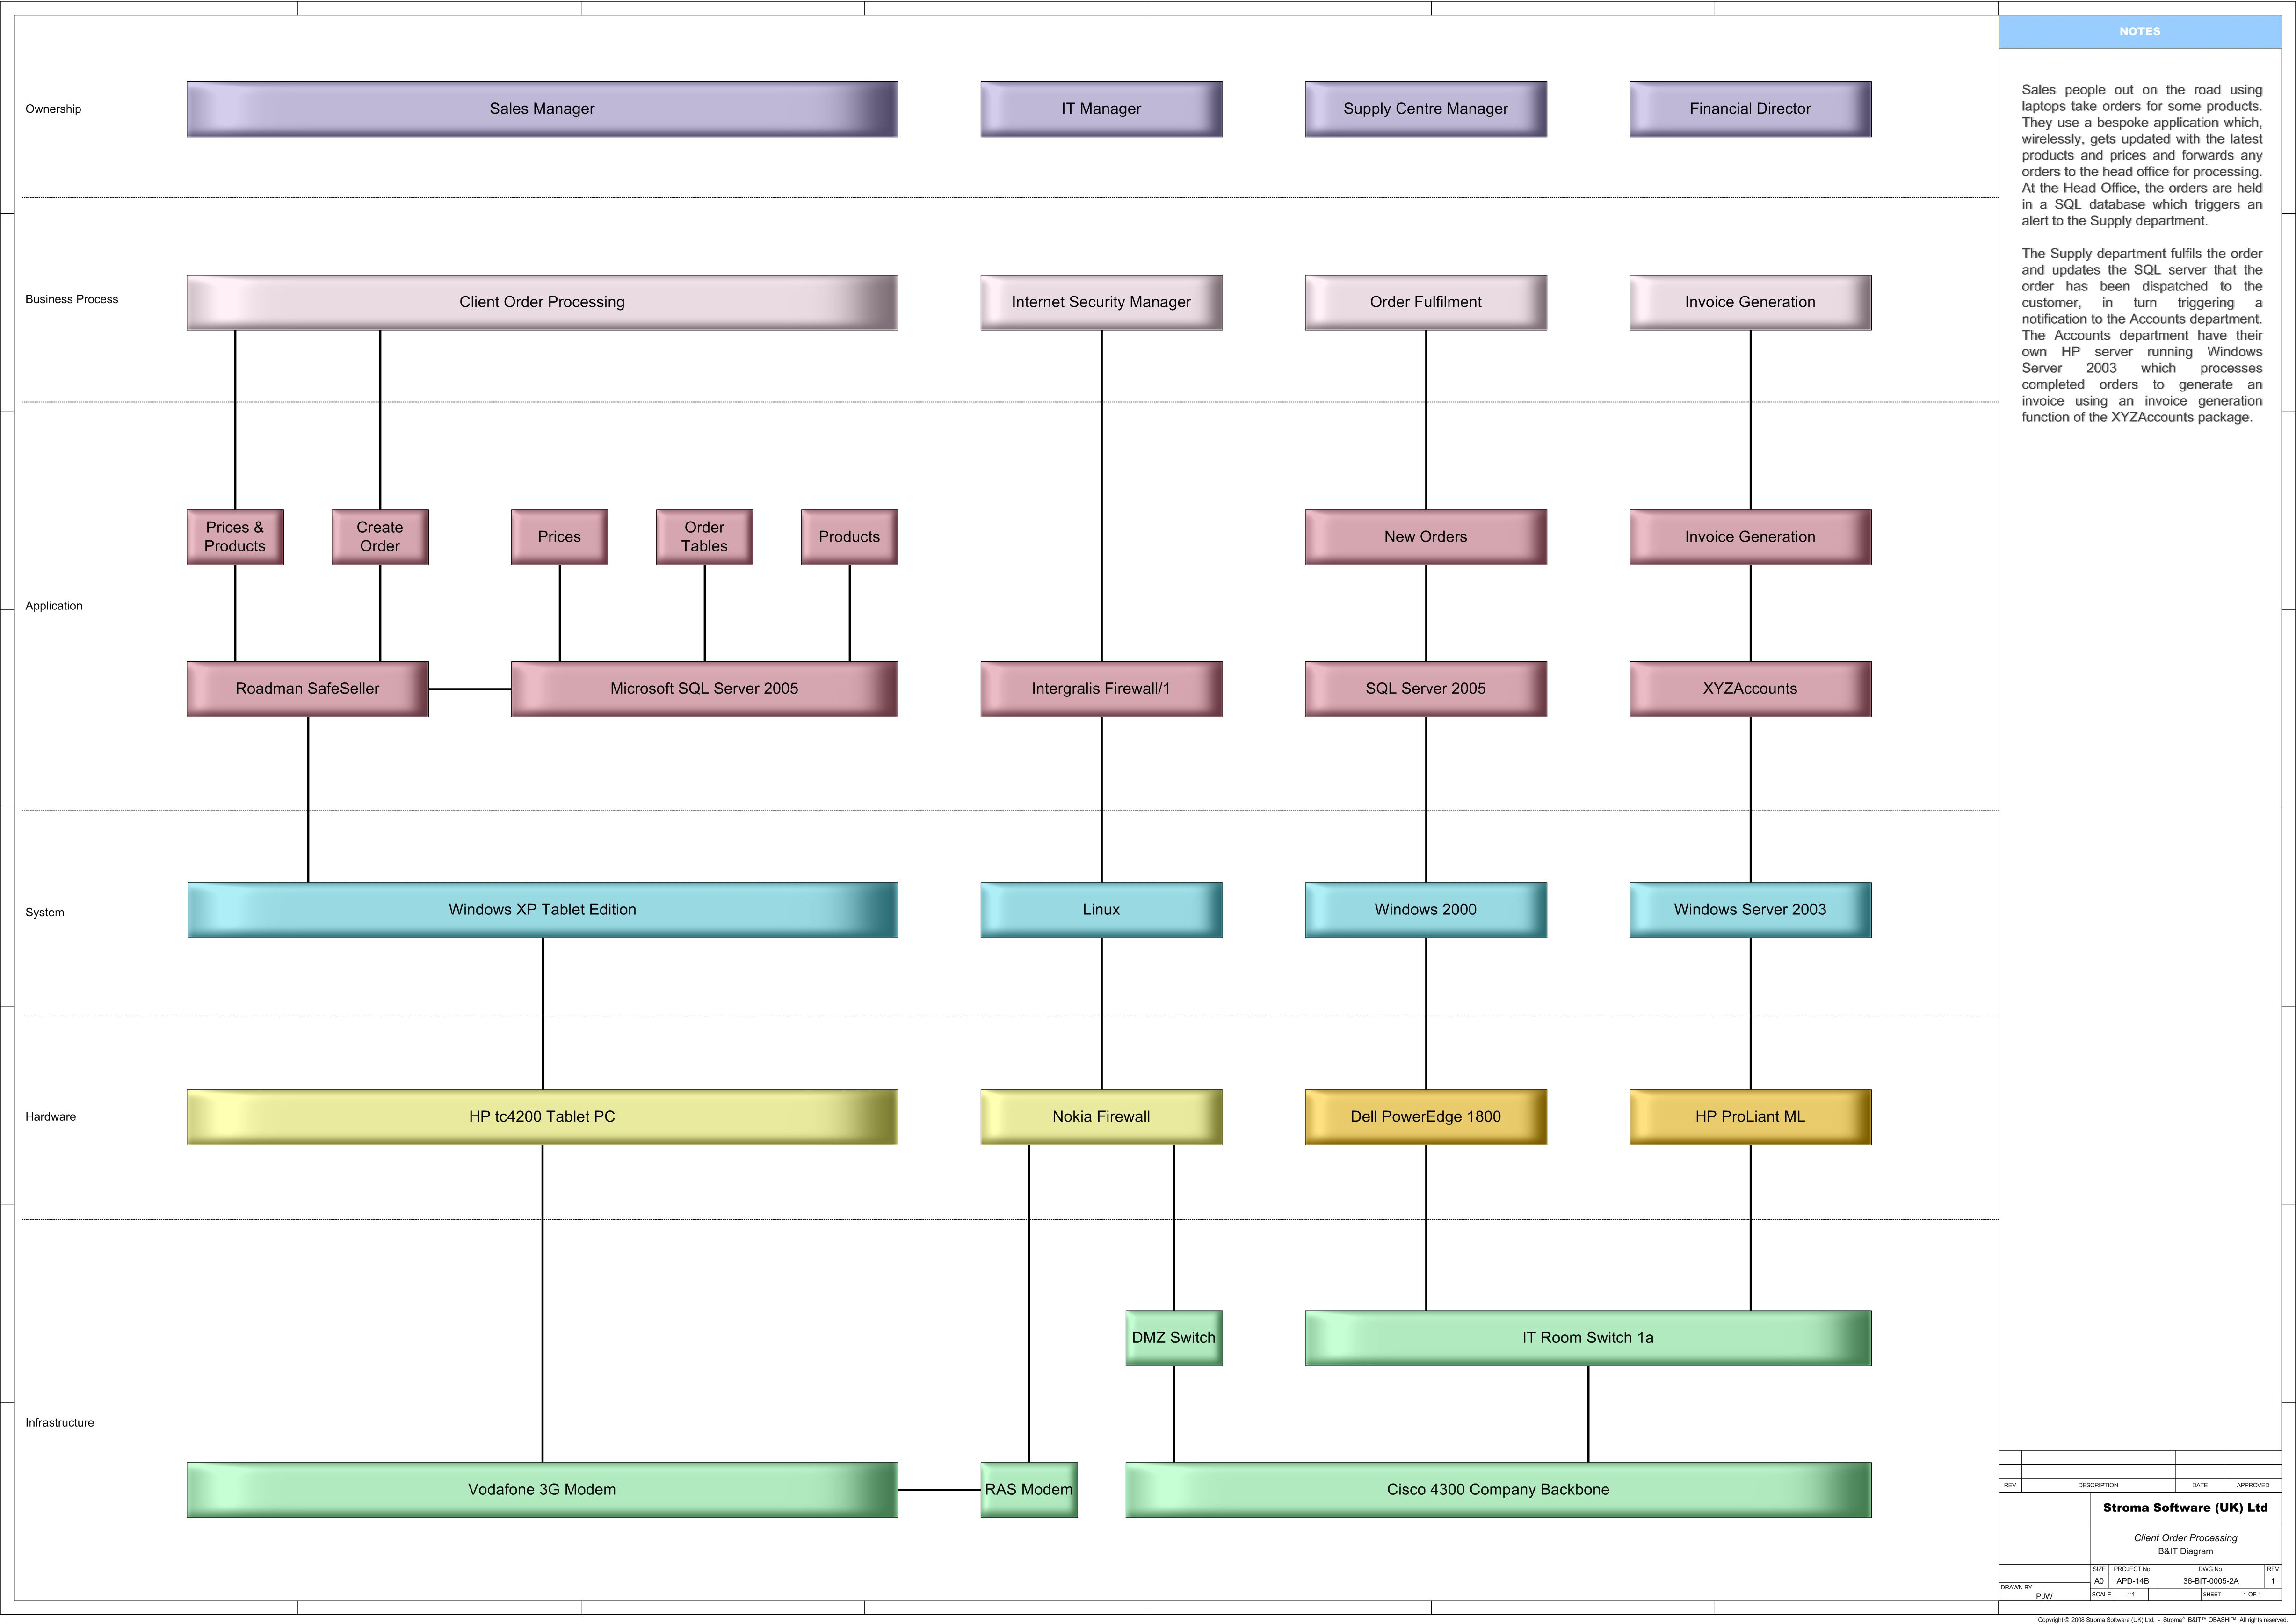
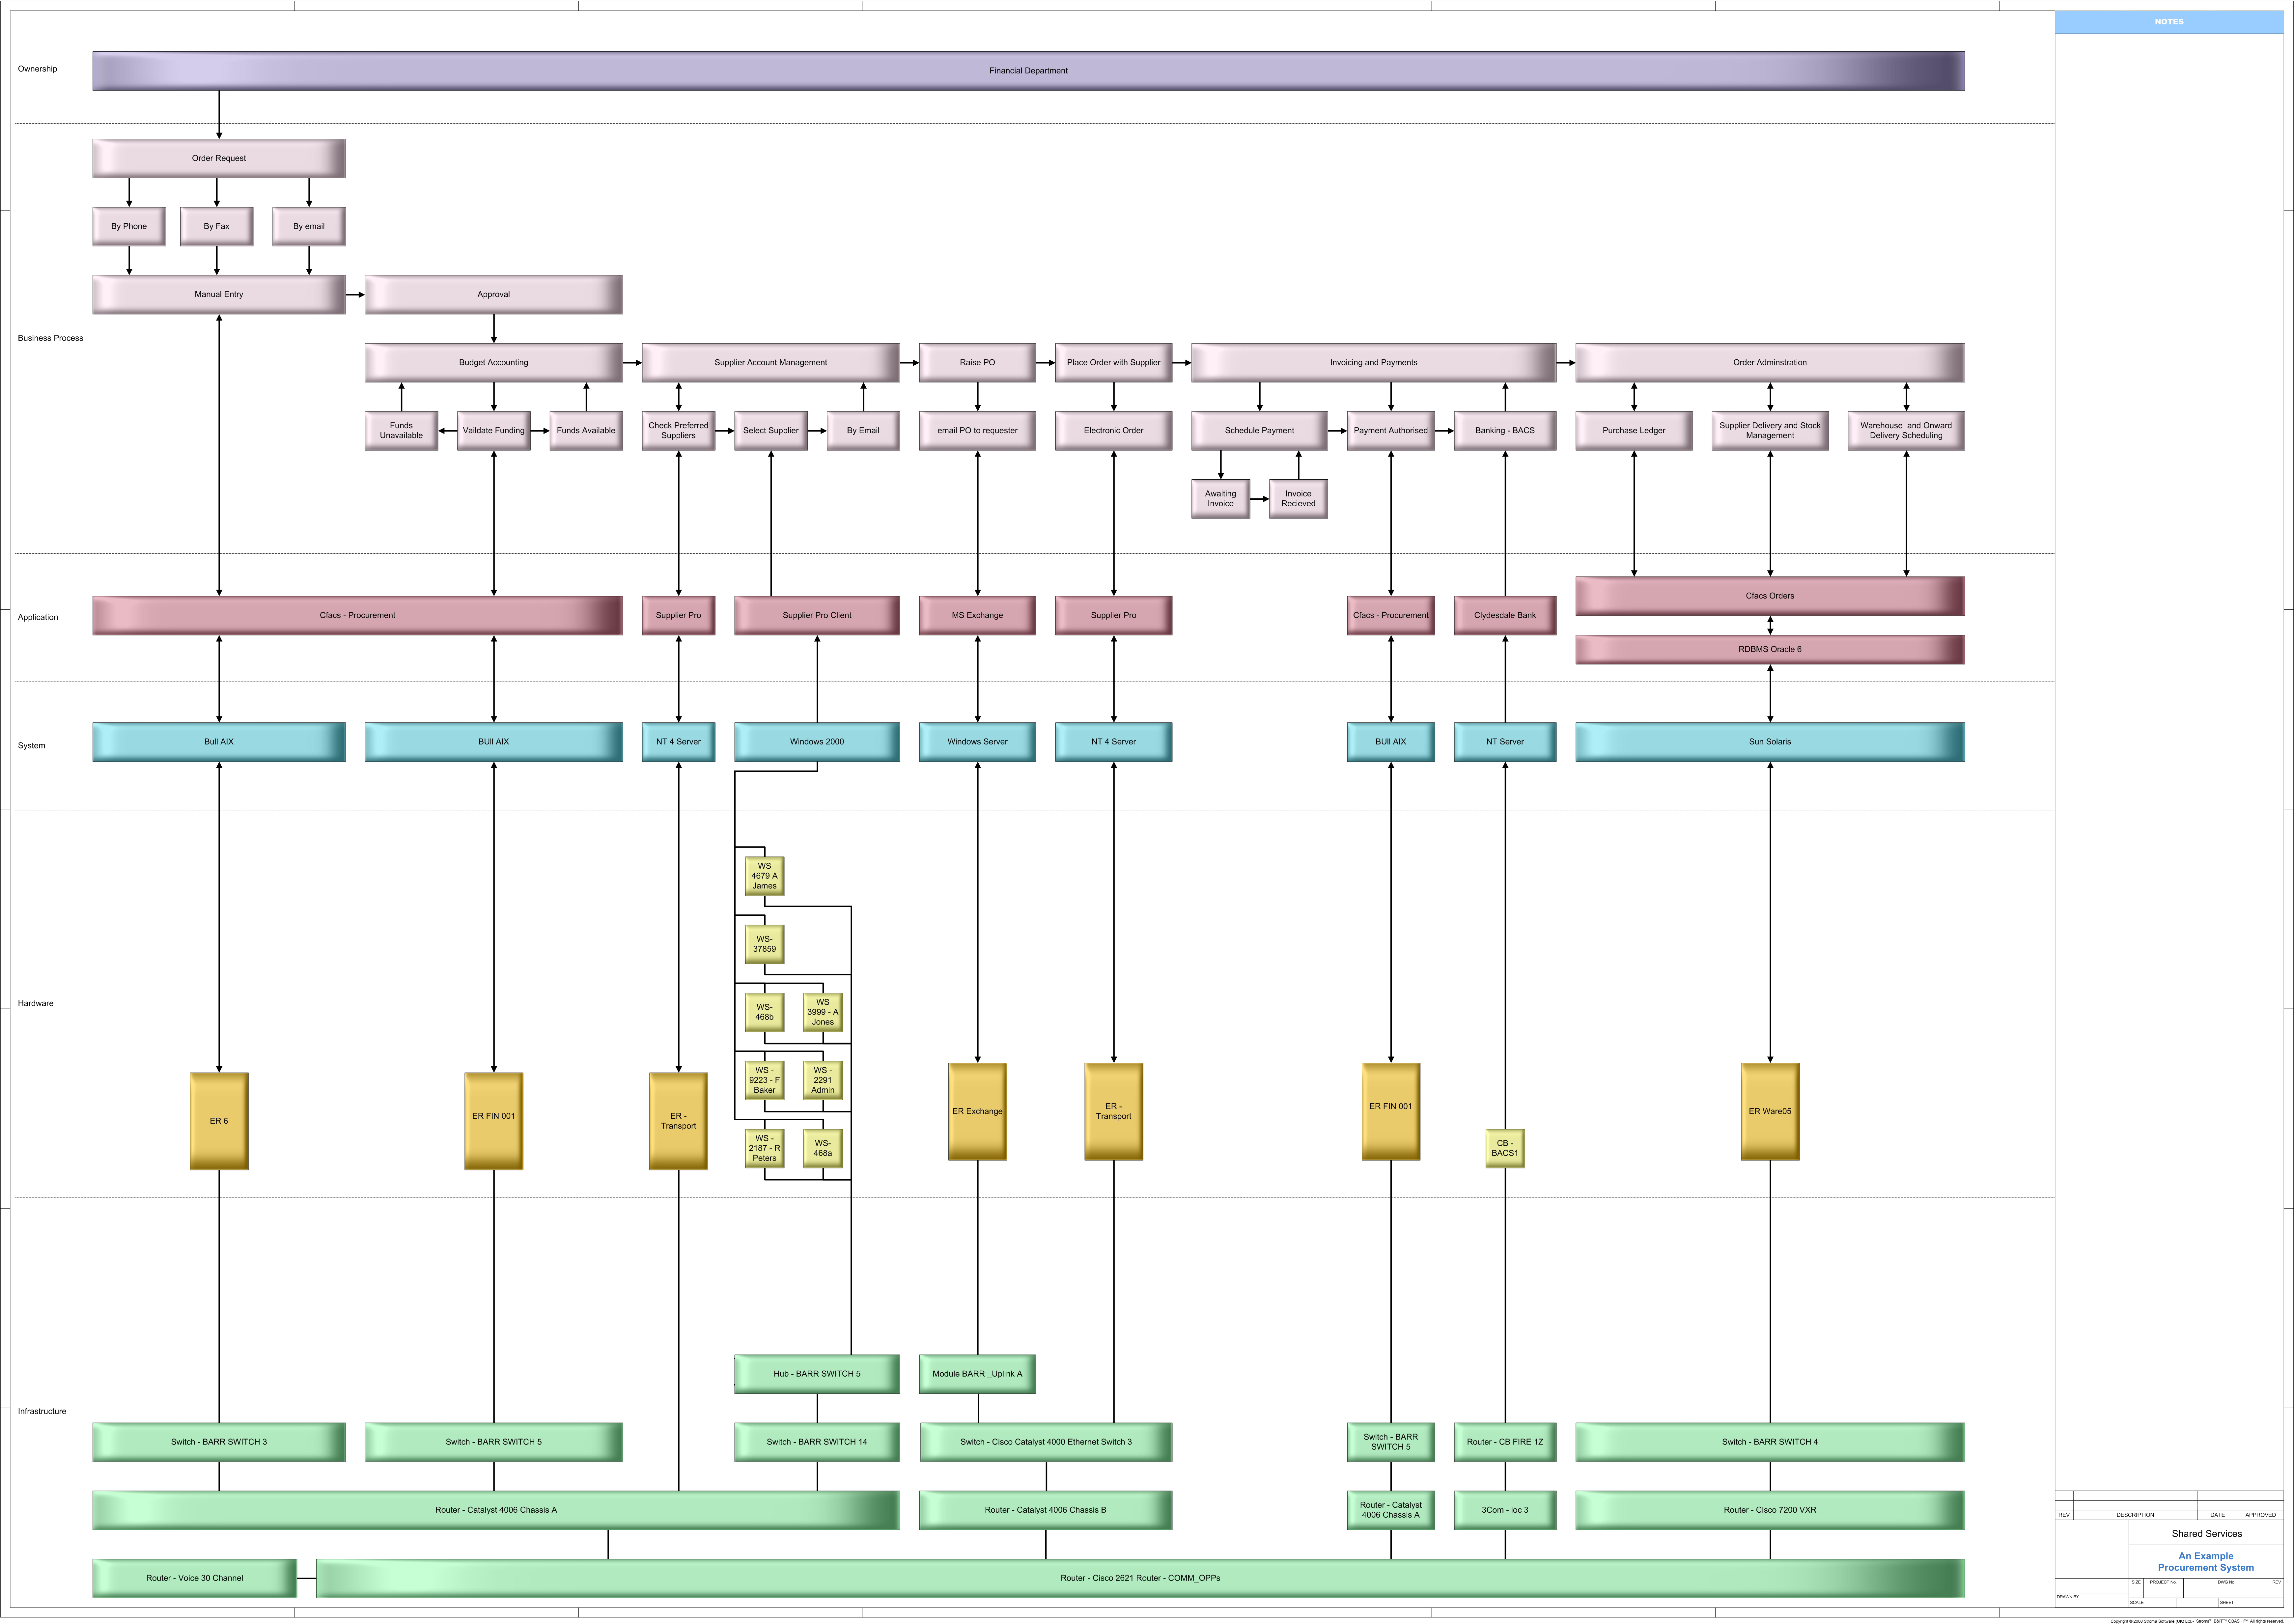
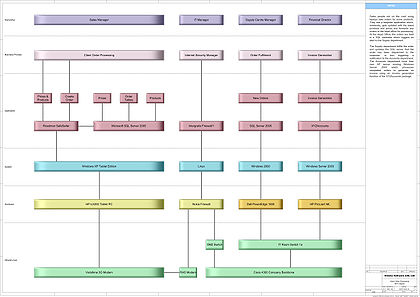 A Business and IT (B&IT) diagram built using the OBASHI Framework.
It is a formal and structured way of communicating the logical and physical relationships and dependencies between IT assets and resources (Ownership, Business Processes, Applications, Systems, Hardware, and Infrastructure) to define the business services of a modern enterprise.
The name OBASHI is a licensed trademark of OBASHI Ltd.
Contents
Core Principle
OBASHI is based around a core principle: that IT exists for one reason, namely, to manage the flow of data between business assets.
Business resources (which include people) and IT assets are either providers of data, consumers of data or provide the conduit through which the data can flow.
The role of IT is to support, process and optimise the flow of data to maximise business/organisational performance.
The Origins of OBASHI
The OBASHI framework was invented by Fergus Cloughley and Paul Wallis of Stroma Software Ltd. during late 2001, following their collaboration on a project to help plant managers visualise and understand how and why IT assets supported business services within British Petroleum, Grangemouth, Scotland.
The subsequent OBASHI methodology was born out of the need for business professionals to easily understand the dollar per second value of dataflow that supports their business services in a simple and meaningful way so accurate and better informed operational and strategic decisions could be made.
Cloughley and Wallis recognized that by developing a methodology around the OBASHI framework, the existing methods for costing and valuing the flow of data in the Oil & Gas / Process Control industry could be made universally appllicable to flows of data in all sectors.
The methodology entails capturing, documenting, modeling, analysing, simulating and optimizing the cost / value of the flow of data between assets and business resources.
DCS - CAD in Process control
The Oil & Gas, Chemical, Pharmaceutical, Power Generation, Water, Food and Beverage, Cement, Steelmaking and Paper industries have relied on Distributed Control Systems (DCS) to manage and control their Manufacturing and Process Control systems.
The flow of data for I/O control purposes is fundamental to the safe and efficient function of plant operations. A clear and concise understanding of the cause and effect of this data flow is a prerequisite to plant operations, business optimization and Health and Safety governance.
This clear and concise understanding is supported by a rigorous approach to documentation, namely: Computer Aided Design (CAD) diagrams & models; Piping and Instrumentation diagrams (P&IDs); Process Flow Diagrams (PFDs); and Cause and Effect diagrams.
Many other add-on technologies can be linked to the flows of plant data to support and optimise the plant running conditions, for example: Chemical Process modeling, Computer simulation, Process optimization and plant maintenance management systems.
The OBASHI Framework and methodology were developed to mimic this rigorous approach and provide contextual documentation to support safe and efficient IT & Business operational practices.
Data flows in the Oil and Gas Industries
Computer models are used within manufacturing and process industries to control and simulate the operation of the plant. These models derive real-time input from digital sensors attached to physical equipment throughout the manufacturing process and are built to understand the contextual relationship between the assets and process flow.
By linking the model to the commodities markets the real costs/values of flow can be displayed, monitored and trended as dollars per second, enabling the transposition from tonnes per hour. In turn, this enables business processes to be optimised around value, and each asset’s contribution to the cost/value of the flow be evaluated in financial terms.
Data flows in the modern business
The contextual understanding of the relationships between physical assets and flows is used within OBASHI to model the flow of data between business services and IT equipment.
Within the OBASHI methodology, business resources and IT assets are regarded as either providers of data, consumers of data, or provide the conduit through which the data can flow.
People provide and consume data daily, as do applications and systems. Hardware and cables act as conduits through which data flows: between desks, through office and corporate networks, across the internet, through deep sea cables and via satellites.
Across all businesses, the equivalents of the pipes, valves, pumps, meters and sensors of the oil and gas industry are the people, hubs, cables, routers, servers, and desktops through which data flows.
By utilising comparable contextual relationships the OBASHI methodology enables dataflow to be analysed in a similar manner to that of process flow within the manufacturing industry, which is central to business performance optimisation.
Characteristics
The OBASHI Methodology models the enterprise/an organisation in six horizontal layers. The layers provide a framework (the OBASHI framework) for organising individual elements that represent individual Business or IT assets and resources. The layers are:
- Ownership
- Business Process
- Application
- System
- Hardware
- Infrastructure
Placing the elements above or below each other within the framework signifies a relationship between the elements. For example, placing an Owner element above a Business Process element signifies that the business processes belongs to that owner. Placing a business function above an application signifies that the process uses that application etc...
Elements can be connected on the diagram to denote a physical relationship, such as the connection between a hardware element and an infrastructure element. Dependencies can also be documented on the diagram to show explicit non-obvious relationships between elements, such as the reliance of a business process on a third party resource.
Each element can be referenced to supporting documentation to provide a supporting context for that element.
The flow of data (dataflows) can be superimposed on the diagrams to depict a sequence of elements required to support a business service.
The combination of one or more OBASHI diagrams form a contextual model for analysis.
The OBASHI Framework
These Layers provide the framework for organising the elements that represent individual Business or IT assets / resources.
The six layers are:
- Ownership
- Business Process
- Application
- System
- Hardware
- Infrastructure
They are collectively known as OBASHI

Ownership Layer
The Ownership Layer contains elements representing the person(s) or group(s) that ‘owns’, or is responsible for, business processes portrayed in the Business Layer. Ownership elements can be positioned beneath other ownership elements to create a hierarchy of owners. Example owners could be: Accountancy, Planning Manager, Logistics, New York, Purchasing Officer and Environmental Health.

Business Layer
The Business Layer contains elements representing the business processes or functions that are being used by the ‘Owner(s)’. These elements are positioned under their appropriate ‘Owner’. Examples could be: Monthly Balance, Sales Transactions, Tank Stock Management, Production Data and Capture Budgeting.

Application Layer
The Application Layer contains elements representing software applications. These are positioned beneath the business processes that utilise them. Examples could include: Excel, Oracle, Sage, SAP and PeopleSoft.

System Layer
The System Layer contains elements representing the operating systems on which the applications run. These elements are positioned beneath the appropriate applications. Examples could be: Windows XP, Unix, Solaris, Linux and Vista.
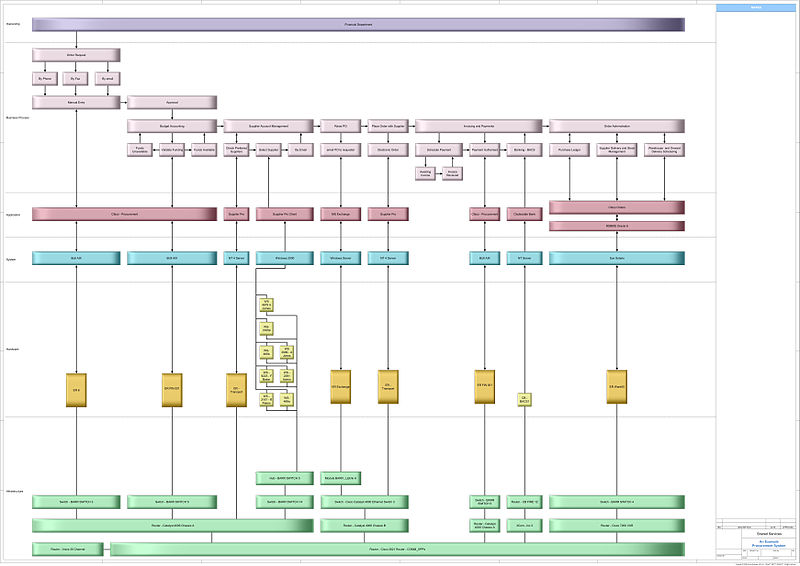
Hardware Layer
The Hardware Layer contains elements representing the computer hardware on which the operating systems run. These elements are positioned beneath the appropriate operating systems. Examples could be: Workstations, Servers, Laptops, Tablet PCs, and Mainframes.

Infrastructure Layer
The Infrastructure Layer contains elements representing the network infrastructure into which the hardware is connected. Infrastructure elements can be positioned beneath other infrastructure elements to create a hierarchy that supports the business. Examples could be: Switches, Routers, Multiplexers, Bridges and Hubs.
B&IT Diagrams
The OBASHI framework is used to create Business and IT (B&IT) diagrams. A B&IT diagram is a diagrammatic representation of the logical and physical relationships (connectivity) between an organisation’s IT assets and resources and the business operations which they support.
A B&IT diagram is made up of elements. Individual elements represent individual business and IT assets and resources.
By employing the OBASHI framework, B&IT diagrams are able to accurately depict the complex inter-relationships and dependencies of business processes, IT resources and dataflows in an easy-to-understand visual format.
Through the use of a tool which supports the OBASHI Framework a repository of elements and relationships can be established. By using a graphical interface to create the B&IT diagrams the tool can build an interactive model of these relationships, with the B&IT diagram acting as a dynamic interface.
Behind each element information can be stored within the repository: business, financial and/or technical. This data may be captured manually, or automatically from data held within existing systems. This information can then be viewed, manipulated and analysed within its business context.
Rules
The OBASHI Framework comprises the following rules which govern the implicit and explicit relationships between elements.
-
- An element placed beneath or above another element has an implicit relationship with that element.
- All elements within the same layer have an implicit relationship to each other.
- Connected elements have an explicit relationship to each other, with the following rules governing connectivity:
- A connection is a bi-directional relationship
- An Infrastructure element may be connected to one or more Infrastructure or Hardware elements.
- A Hardware element may be connected to one or more Infrastructure or System elements.
- A System element may be connected to one or more Hardware or Application elements.
- An Application element may be connected to one or more System, Application or Business elements.
- A Business element may be connected to one or more Application, Business or Owner elements.
- An Owner element may be connected to one or more Business or Owner elements.
- A dependency is a uni-directional relationship i.e. element X may be dependent on element Y, but element Y might not be dependent on element X.
- An element may have one or more instances within a layer.
- An element can exist on more than one OBASHI diagram.
- A dataflow comprises two or more connected elements.
- A dataflow can contain one or more dataflows, enabling a hierarchy of dataflows.
- A dataflow may span multiple Business and IT diagrams.
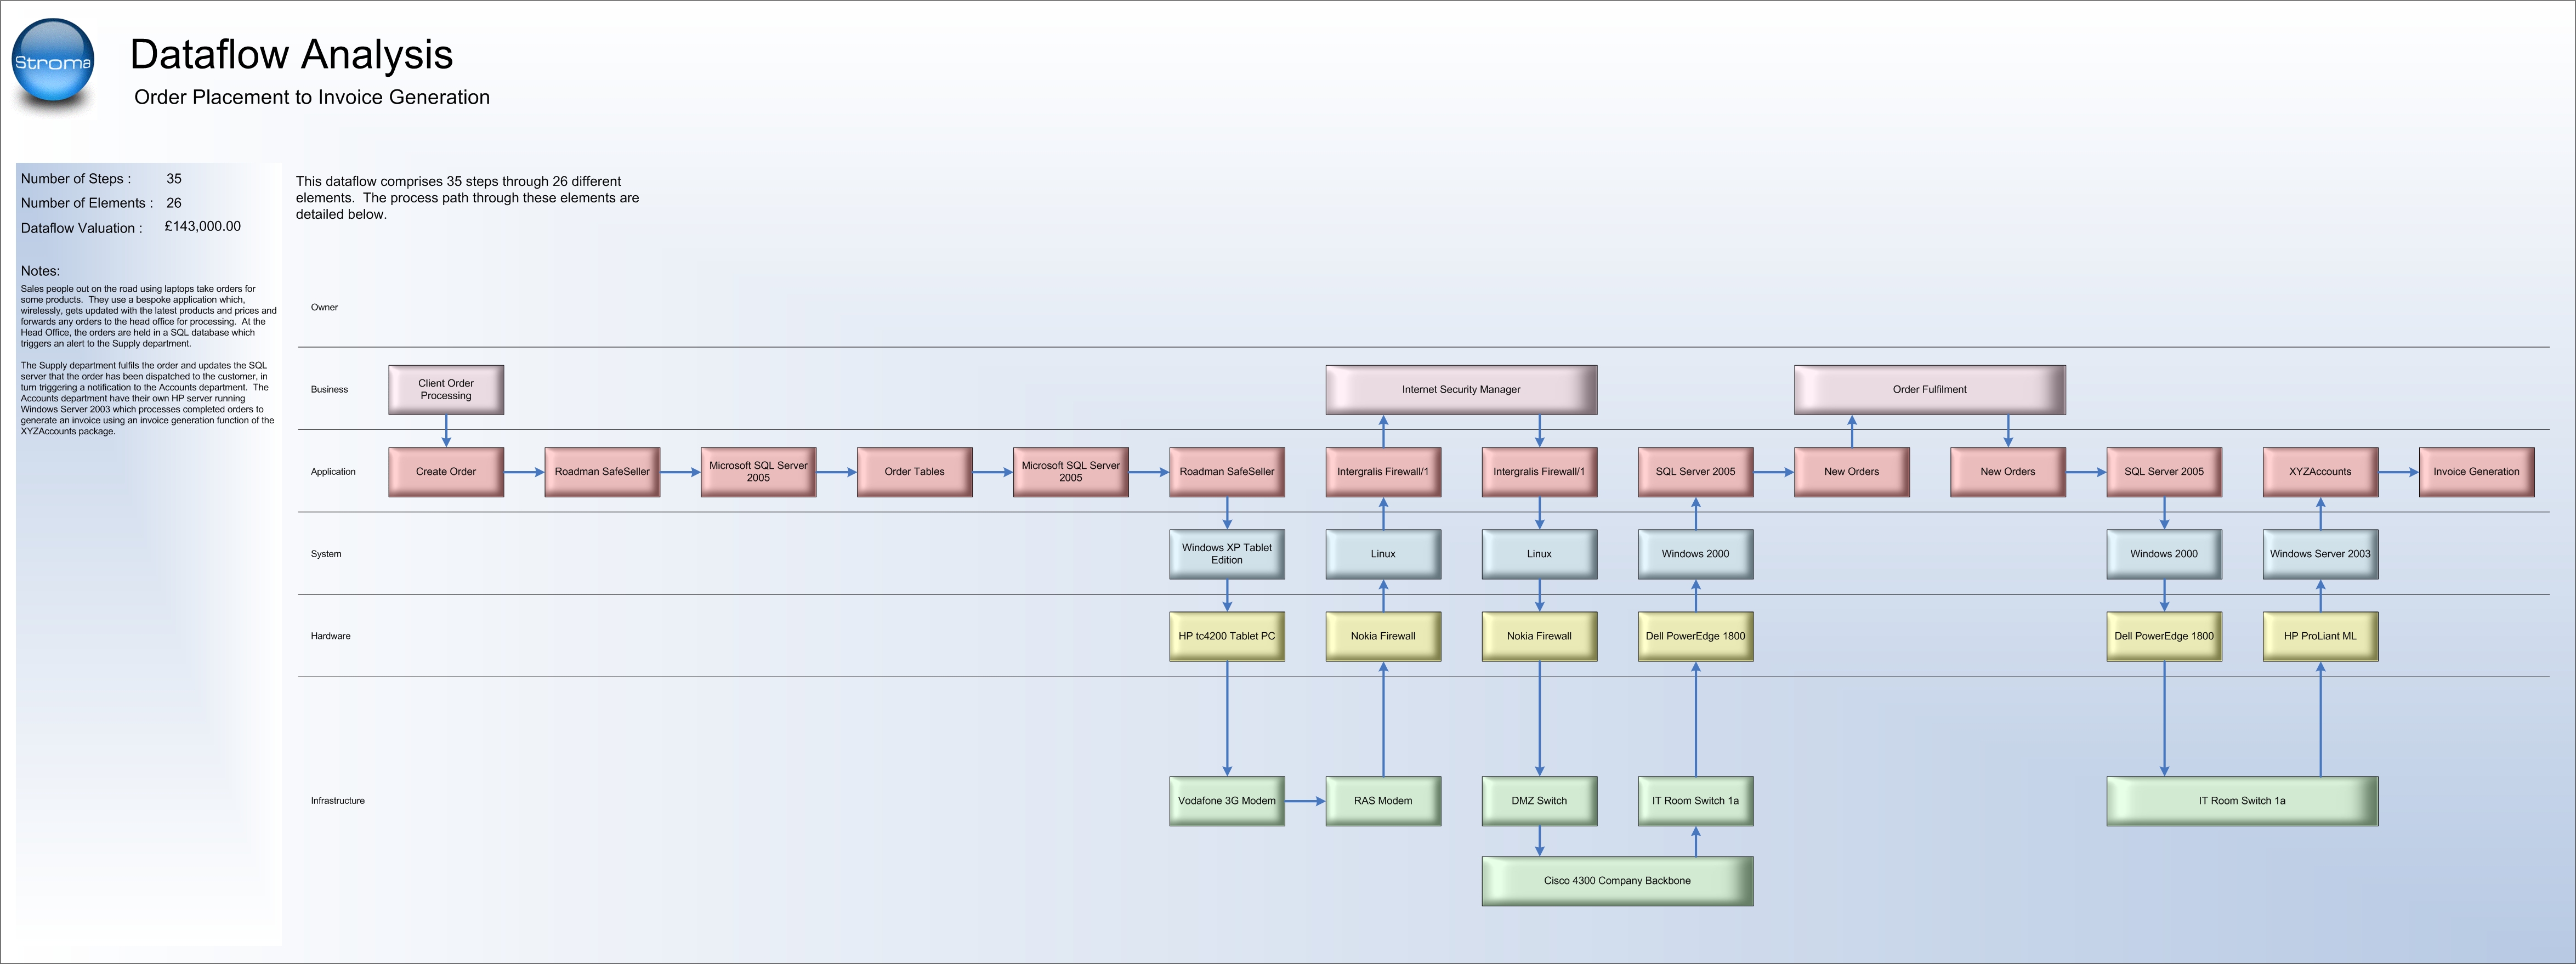
The Dataflow Analysis View (DAV)
The OBASHI Dataflow Analysis View (DAV) is a graphical and statistical representation of all the business and IT resources, and attributed financial values, that support an individual data flow. A DAV illustrates to business professionals how and why IT systems interact with day to day business processes.
All of the physical assets required for the logical data flow to exist are documented as a sequence. A sequence shows all of the IT and Business assets and resources involved in the data flow.
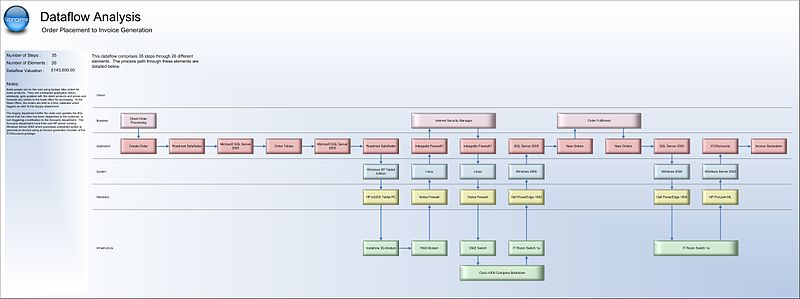
The DAV enables cost/value statistics to be generated to understand the contribution IT assets make to the business. Analysis of the DAV can highlight vulnerabilities, mis-alignment and areas for consolidation.
Fields of use
The OBASHI Methodology can be used in the following fields:
- Availability
- Business Architecture
- Business Continuity
- Business Process Management (BPM)
- Business Service Management
- Business Technology Optimisation (BTO)
- Change Management
- CHAZOP (Computer Hazardous Operation Analysis)
- COBIT
- Data Center Management
- Enterprise Architecture (EA)
- Governance & Auditing
- Grid Computing
- Information Architecture (IA)
- Enterprise Information Security Architecture (EISA)
- Infrastructure Management
- IT Service Management
- IT Security
- ITIL
- On Demand/Utility Computing
- Performability
- Risk Management
- Service Oriented Architecture (SOA)
- SOX
- Technical Architecture
See also
- Business Strategy
References
- APMG-International (2010), The OBASHI Methodology. The Stationery Office ISBN 978-0-11-706857-5.
- Neil McNaughton, Editor, Oil Information Technology Journal, Oilit.com. Business and IT Mapping, Petroleum Exploration Society Great Britain Data Management Conference, Technology Watch Report, London (December 11, 2007)
- Karl Jeffery, Editor, Seeing IT in a Business Context Digital Energy Journal, Feature Article, (August 7, 2007)
External links
Categories:


Wikimedia Foundation. 2010.